T
Submitted to the Proceedings of the International Conference dedicated to the 30th anniversary of the Rozhen Observatory, 27-30 September 2011. Bulgarian Astronomical Journal 17, 2011
he Synchronous Network of distant Telescopes
s)
B. Zhilyaev1, O. Svyatogorov1, I. Verlyuk1, M.
Andreev2, A. Sergeev2,
M. Lovkaya3, S. Antov4, R. Konstantinova-Antova4, R. Bogdanovski5,6,
S. Avgoloupis7, J. Seiradakis7, and M. Contadakis8
1 Main Astronomical Observatory, NAS
of Ukraine, Kiev, Ukraine
e-mail: zhilyaev@mao.kiev.ua
2International Centre for Astronomical,
Medical and Ecological Research, Terskol, Kabardino-Balkaria, Russia
3Crimean Astrophysical Observatory, Nauchny, Crimea, Ukraine
4Institute of Astronomy and Rozhen NAO, Bulgaria
5Space Research Institute, Bulgarian Academy of Sciences, Sofia, Bulgaria
6Institute of Mathematics and Informatics, Sofia, Bulgaria
7University of Thessaloniki, Departament
of Physics, Thessaloniki, Greece
8University of Thessaloniki, Departament of Geodesy and
Surveying, Thessaloniki, Greece
Abstract
The Synchronous Network of distant Telescopes (SNT) represents an innovative approach in observational astrophysics. Authors present the unique existing realization of the SNT-conception. It was founded within the international collaboration between astronomical observatories of Ukraine, Russia, Bulgaria and Greece. All the telescopes of the Network are equipped with standardized photometric systems (based on photomultipliers). The unified timing systems (based on GPS-receivers) synchronize all the apertures to UTC with an accuracy of 1 microsecond and better. The essential parts of the SNT are the original software for operating and data processing. Described international Network successfully works for more then 10 years. The obtained unique observational data made it possible to discover new fine-scale features and flare-triggered phenomena in flaring red dwarfs, as well as the recently found high-frequency variability in some chromospherically active stars. keywords stars: flare – stars: individual: EV Lac – stars: activity – methods: observational – techniques: photometric
1 Introduction
The basic idea of the SNT-conception is to consider a number of optic telescopes as a single instrument. Such an instrument provides an elegant solution of wide scope of problems, which remain irresolvable for single-site observations. Synchronous tracking the same source with different distant telescopes enables user to obtain data sets with the same true signal and independent uncorrelated noise. These obvious advantages enable state-of-the-art experiments, providing observational information of unprecedented quality. Authors discuss the following questions: (a) a new observational technology with the Synchronous Network of distant Telescopes and new methodology of data processing; (b) description of the optical High Frequency Oscillations (HFO) in EV Lac flares; (c) the technique and results of spectroscopic monitoring of transient events with low-resolution grism spectrometer; etc.
2 Observations
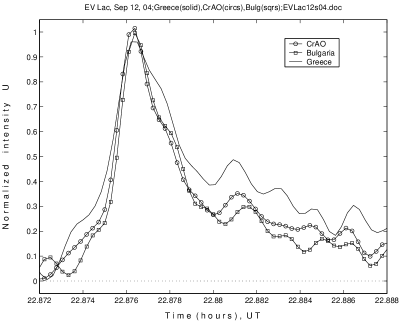
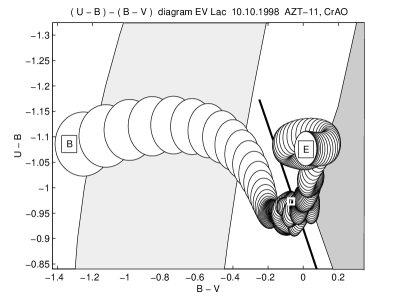
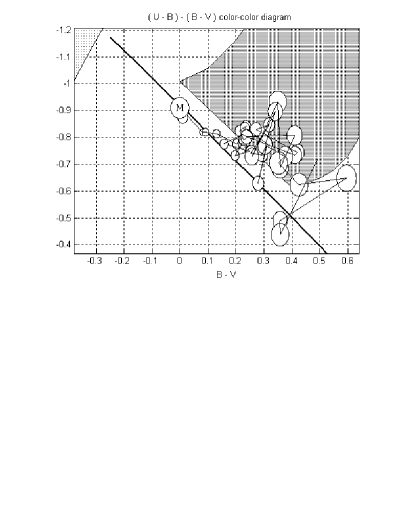
The Synchronous Network of Telescopes, involving telescopes at four observatories in Ukraine, Russia, Greece and Bulgaria allows studying small-scale activity of stars with the high time resolution (Zhilyaev et al. 2003). The instruments used are the following: the 2 m Ritchey-Chretien and the 60-cm Cassegrain telescopes at Peak Terskol (North Caucasus, 3100 m a.s.l.) with a high-speed two-channel UBVR photometer (Zhilyaev et al. 1992); the 30 inch telescope at Stephanion Observatory in Greece, equipped with a single-channel photometer with digitized readings in the U band (Mavridis et al. 1982); the 1.25 m reflector AZT-11 at the Crimean Observatory with a UBVRI photometer-polarimeter (Kalmin & Shakhovskoy 1995); the 2 m Ritchey-Chretien telescope at the Rozhen Observatory and the 60-cm Cassegrain telescope at the Belogradchik Observatory with a single-channel UBV photon-counting photometer (Antov & Konstantinova-Antova 1995). All the telescopes of SNT are equipped with standardized photometric systems based on photomultipliers. The unified timing systems based on GPS technology synchronize all the apertures to UTC with an accuracy of 1 microsecond and better. For operating and processing of the SNT data the original software was developed. The typical integration time is 0.1 s. To increase the signal-to-noise ratio we perform digital filtering of the available photometric data. We use the Kaiser convolution to obtain a low-frequency outburst light curve from the sets of flaring stars data and a moving-average to suppress high-frequency noises (see details in Zhilyaev et al. 2000). The SNT team carries out usually two observing campaigns yearly, the winter and the autumn. Figure 1 represents the light curves of the flare detected on Sept. 12, 2004. All sites in the Ukraine, Russia, Greece, and Bulgaria had registered this flare event. Figure 1 demonstrates the remarkable consistency of the U-band light curves simultaneously obtained by three instruments of the Crimean, Stephanion, and Belogradchik observatories. The smoothed data show clear presence of high-frequency oscillations (HFO) in the descending part of the flare. The application of new observational technology and new methodology of data processing - a high-speed, multi-site monitoring and digital filtering - provided new results: we confirmed HFO in stellar flares and discovered fast color variations of the flare s radiation (Zhilyaev et al. 2007). The color-indices and time tracks in the UBVR color-color diagrams are based on the data obtained with the Crimean 1.25 m reflector AZT-11. An example of such color time tracks can be seen in Figure 2. Figure 2 shows the color tracks of the flare from October 10, 1998. According to the theoretical color-color diagrams (Chalenko 1999), the flare’s onset (and 95% error ellipse) falls in the region corresponding to the radiation of hydrogen plasma optically thin in the Balmer continuum. The flare in its oneset shows extremely blue colors U-B = -1.1, B-V = -1.3. Using the blackbody model for the photosphere of EV Lac in a quiet state and the observed flare amplitudes in the U-band, one may estimate the size of flare (Alekseev & Gershberg 1997). For EV Lac in quiescence one may adopt (Pettersen 1980). Changes in the color-color diagram prove that the flare in its maximum is similar to a blackbody source with the most probable temperature of 16 000 K.
3 The grism spectroscopy of transient events
The slitless UBVR grism spectrometer is established on the Zeiss-600 telescope at Peak Terskol in North Caucasus. It allows to carry out parallel recording of the spectrum with subsecond temporal resolution while working the SNT. A blazed transmission grating is included in the converging beam in the telescope filter wheel. The wavelength scale after calibration is accurate to about . The grating spectrum has a resolution of at . The grism spectrometer can provide moderate signal-to-noise ratio for stars up to 16 magnitude. It allows measuring the equivalent widths of the non blended lines down to . The grism tools can be used to study temporal variations in the spectra of variable stars. We use customized software that relies on the theory of count statistics to identify intrinsic activity in spectra. This allows us to detect the relative power of fluctuations down to in the optics. The obtained unique observational data made it possible to discover new fine-scale features and flare-triggered phenomena in flaring red dwarfs, as well as low-amplitude rapid variability of spectra in chromospherically active stars. Detailed colorimetric analysis based on the fast grism spectroscopic data allowed estimating important characteristics of flares on some red dwarf flaring stars: the temperature at brightness maximum and size. The high temporal resolution monitoring of some chromospherically active stars revealed variations in the Balmer and CaII H, K lines at time span of seconds to minutes with amplitudes of a few percents. This allows us first to assert the existence of intense microflaring activity in these stars.
4 Some results
4.1 The flare star EV Lac
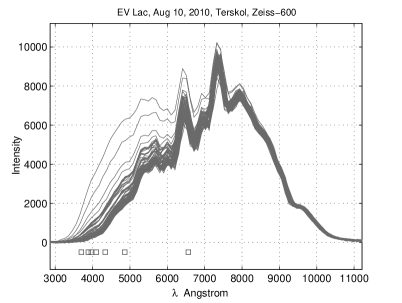
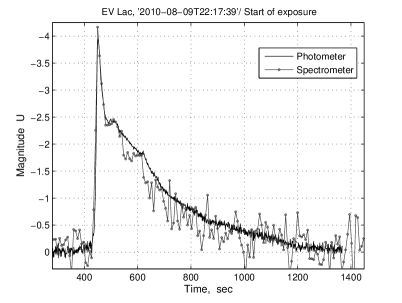
100 spectra of strong flare on EV Lac with a time resolution of 7.5 sec are shown in Figure 3. One can easily see a dramatic change in the short wavelength during a flare. By mathematical convolution of spectra with the transmission curves of filters one can obtain estimates of the UBVR magnitudes. The U band light curve of strong flare of EV Lac on Aug 10, 2010 is shown in Figure 4. The synchronous registration of the flare with the 2 m telescope displays in Figure 4 too. Detailed colorimetric analysis allowed estimating the temperature at maximum brightness and its size. The two-color (U-B) - (B-V) diagram in Figure 5 confirms that the flare at maximum light radiates as a black body with a temperature of about 13 400 K. The linear size of the flare at the maximum luminosity is about 3.9% of the stellar radius.
4.2 The chromospherically active star SAO 52355
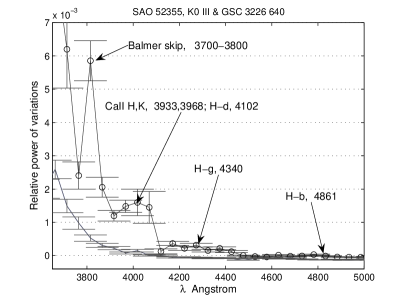
We have carried out low-resolution spectroscopy of SAO 52355 with the Zeiss-600 telescopes at Peak Terskol. SAO 52355 is a field star of the spectral type K0 III. We came out on this star in search of reference stars for the variable EV Lac. The X-ray observations taken by Ginga and ROSAT indicate in SAO 52355 coronae plasma temperatures as high as K. This star is supposed to have high-powered chromosphere. On May 30, 2010, we obtained 200 low-resolution grating spectrograms of SAO 52355. For SAO 52355 we used GSC 3226 640 as the reference star, Johnson V magnitude: 10.69. Data inferred from the Tycho catalog: BT magnitude , VT magnitude . Johnson B-V color, computed from BT and VT: 0.270. In Figure 6 the relative power of variations in grating spectra of SAO 52355 and its reference star GSC 3226 640 are shown. Note the ”smooth” spectral energy distribution in the power spectra of the reference star and the ”emission” features at wavelengths of the Balmer lines and the CaII H, K lines, as well as at the wavelength of the Balmer jump in SAO 52355. From the power spectrum data one can find that variations in the intensities of the CaII H, K and lines are 3.2% and 1.5%, respectively.
It is found that chromospherically active stars show strong Hydrogen and Ca II emission lines as well as high X-ray luminosity. As mentioned by Gondoin (2003), the high X-ray flux from chromospherically active stars detected by space observatories could be explained by assuming that the heating of its corona results from a large number of small flares. It is well-known that the stellar coronae are heated by the two most favored agents involving magnetic fields, namely MHD waves and transients, such as flares, and microflares (see Narain & Pandey 2006, and references therein). It is thought that flares are associated with conversion of magnetic energy of plasma to thermal energy via magnetic reconnection. The reconnect heating by foot-point motions was proposed first by Parker (1991). A forest of closed magnetic loops has foot points ankered in photospheric regions. The mechanical energy flux is generated by foot point motions. These motions increase the energy stored in the entwined magnetic field. This system can return to a minimum energy configuration only after a reconnection (or a cascade of reconnections). It is thought that these small and frequent reconnection events give rise to the microflare heating (Narain & Ulmschneider 1996). Thus, our observations allows us to assert the existence of intense microflaring activity in the chromospherically active star SAO 52355.
Conclusion
The application of new observational technology with the Synchronous Network of distant Telescopes and new methodology of data processing, provided new results: we confirmed High-Frequency optical brightness Oscillations (HFO) in stellar flares and discovered fast color variations of the flare radiation. Our first description of the optical HFO in the EV Lac flares (Zhilyaev et al. 2000) was interpreted by Kouprianova et al. (2004) and Stepanov et al. (2005). They concluded that a source of such an HFO is located at a magnetic loop footpoint, the pulsations are determined by modulation of the flux of energetic particles descending along a loop with fast magnetoacoustic oscillations. Spectroscopic monitoring of the chromospherically active star SAO 52355 showed variations of intensity in the Balmer lines and in the CaII H, K lines at time intervals ranging from seconds to minutes. From the power spectrum data one can find that variations in the intensities of the CaII H, K and lines are 3.2% and 1.5%, respectively. Satellite surveys at X-ray indicate high temperature coronae plasma in many chromospherically active stars. High-frequency changes, which were found in SAO 52355, suggests the existence of intense microflaring activity in this star.
References
- [1] Alekseev I.Yu., Gershberg R.E., 1997, In: The Earth and the Universe, Eds. Asteriadis G., Bantelas A., Contadakis M.E., Katsambalos K., Papadimitriou A., and Tsiavos I.N., Aristotle University of Thessaloniki, Thessaloniki, Ziti Editions, p. 53
- [2] Antov A. and Konstantinova-Antova R., 1995, in: Robotic observatories, edited by M.F. Bode, 69, Praxis Publishing Ltd, Chichester, England
- [3] Chalenko N., 1999, Astron. Reports, No. 7, 459
- [4] Gondoin P., 2003, A&A , 404, 355
- [5] Kalmin S.Yu. and Shakhovskoy D.N., 1995, Kinematika i Fizika Nebesnyh Tel, 11, No. 3, 85
- [2004] Kouprianova, E. G., Tsap, Y. T., Kopylova, Y. G., & Stepanov, A. V. 2004, In Multi-wavelength investigations of solar activity (Cambridge Univ. Press), ed. A. V. Stepanov et al., Proc. IAU Symp., 223, 391
- [6] Kunkel W.E., 1970, ApJ, 161, 503
- [7] Mavridis L.N., Asteriadis G. and Mahmoud F.H., 1982, in: Compendium in Astronomy, eds. E.G. Mariolopoulos, B.S. Theocaris and L.N. Mavridis, 253, Reidel Dortrecht
- [8] Narain U., Ulmschneider P., 1996, Space Sci. Rev., 75, 453
- [9] Narain U. , Pandey K., 2006, J. Astrophys. Astr., 27, 93
- [10] Parker E.N., 1991, In: Mechanism of Chromospheric and Coronal Heating, ed. P. Ulmschneider, E.R. Priest, & R.Rosner, Heidelberg: Springer Verlag, 615
- [11] Stepanov, A. V., et al. 2005, Azh Lett., 31, 684
- [12] Zhilyaev B.E., Romanyuk Ya.O. and Svyatogorov O.A. 1992, AZh., 69, 895
- [13] Zhilyaev B. E., Romanyuk Ya. O., Verlyuk I. A., et al., 2000, A&A, 364, 641
- [14] Zhilyaev B.E., Romanyuk Ya.O. Svyatogorov O.A., 2003, Principles and Applications of the Synchronous Network of distant Telescopes, Vilnius-2003, Baltic Astronomy, Vol. 12, 2003, pp. 561-567
- [15] B.E. Zhilyaev, Ya.O. Romanyuk, O.A. Svyatogorov, I.A. Verlyuk, B. Kaminsky, M. Andreev, A.V. Sergeev, R.E. Gershberg, M.N. Lovkaya, S.J. Avgoloupis, J.H. Seiradakis, M.E. Contadakis, A.P. Antov, R.K. Konstantinova-Antova, and R. Bogdanovski, 2007, Fast colorimetry of the flare star EV Lacertae from UBVRI observations in 2004, Astronomy and Astrophysics, Volume 465, Issue 1, April I 2007, pp. 235-240
- [16] B.E. Zhilyaev, K.O. Stetsenko, M.V. Andreev, A.V. Sergeev, Yu.S. Ivanov, O.A. Svyatogorov, 2010, Kinematika i Fizika Nebesnyh Tel, Supplement, No. 6, 422-425
- [17] B.E. Zhilyaev, M.V. Andreev, A.V. Sergeev, 2011, Detection of high-frequency variability in chromospherically active stars, arXiv:1109.5207v1 [astro-ph.SR] 23 Sep 2011