Distances to Galaxies from the Brightest Stars in the Universe
Abstract
Blue Supergiants (BSGs) are the brightest stars in the universe at visual light with absolute magnitudes up to MV = -10 mag. They are ideal stellar objects for the determination of extragalactic distances, in particular, because the perennial uncertainties troubling most of the other stellar distance indicators, interstellar extinction and metallicity, do not affect them. The quantitative spectral analysis of low resolution spectra of individual BSGs provides accurate stellar parameters and chemical composition, which are then used to determine accurate reddening and extinction from photometry for each individual object. Accurate distances can be determined from stellar gravities and effective temperatures using the "Flux Weighted Gravity - Luminosity Relationship (FGLR)".
Most recent results of the quantitative spectral analysis of BSGs in galaxies within and beyond the Local Group based on medium and low resolution spectra obtained with the ESO VLT and the Keck telescopes on Mauna Kea are presented and distances obtained with the FGLR-method are discussed together with the effects of patchy extinction and abundance gradients in galaxies. BSG metallicities and metallicity gradients are compared with results from strong-line H II region studies and the consequences for the empirical calibration of the metallicity dependence of the Cepheid period - luminosity relationship are pointed out. The perspectives of future work are discussed, the use of the giant ground-based telescopes of the next generation such as the TMT on Mauna Kea and the E-ELT and the tremendous value of the GAIA mission to allow for the ultimate calibration of the FGLR using galactic BSGs.
Keywords galaxies: distances and redshifts — galaxies: individual(M81, M33, NGC 300, WLM) — stars: abundances — stars: early-type — supergiants
1 Introduction
After the detection of the accelerated expansion of the universe the physical explanation of dark energy has become the major challenge of astronomy and physics. One way to constrain the physics behind dark energy is to measure the equation-of-state parameter w = p/(c2). This requires an extremely accurate determination of the extragalactic distance scale and the Hubble Constant H0. As is well known (Macri et al., 2006), the determination of cosmological parameters from the cosmic microwave background is affected by degeneracies in parameter space and cannot provide strong constraints on the value of H0 (Spergel, 2006; Tegmark et al., 2004). Only if additional assumptions are made, for instance that the universe is flat, H0 can be predicted with high precision (i.e. 2%) from the observations of the cosmic microwave background, baryonic acoustic oscillations and type I high redshift supernovae. If these assumptions are relaxed, then much larger uncertainties are introduced (Spergel et al., 2007; Komatsu et al., 2009). The uncertainty of the determination of w is related to the uncertainty of H0 through w/w 2H0/H0. Thus, an independent determination of H0 with an accuracy of 5% will allow the uncertainty of w to be reduced to 0.1 or, even more ambitious, H0 accurate to 1% will yield w accurate to 0.02.
Extremely promising steps towards this goal have been made recently by Macri et al. (2006) and by Riess et al. (2009a, b, 2011), who in a most ambitious approach use the maser galaxy NGC 4258 and its Cepheids as a new anchor point for the extragalactic distance scale. HST detections of Cepheids out to 30 Mpc in galaxies with SNIa, which were detected recently and have accurate and well understood light cuves, are then used to consistently calibrate SNIa as far reaching standard candles using HST H-band photometry of the host galaxy Cepheids. In this way, Riess et al. (2011) have been able to determine H0 with unprecedented accuracy. They estimate an error of only 4% including both systematic and random uncertainties (see papers by Lucas Macri and Adam Riess in this volume).
However, it is clear that the complexity of this bold and courageous approach requires additional and independent tests. There are two long-standing issues with the use of Cepheids as stellar distance indicators, the perennial problem of interstellar extinction and the uncertainty about a potential metallicity dependence of the period-luminosity relationship. While both problems can be mitigated to some extend by near IR observations and a strictly differential approach, as applied by Riess et al. (2011), at a few percent accuracy level of H0 they continue to be a major concern.
In order to address these concerns, an independent and complementary method is desirable, which can overcome the problems of interstellar extinction and variations of chemical composition. In this paper, we introduce such a method, the flux weighted gravity - luminosity relationship (FGLR), which is based on the quantitative spectroscopy of blue supergiant stars (BSGs).
In the following we briefly illustrate the still acute problems caused by extinction and metallicity. We then introduce the spectroscopy of BSGs as an ideal tool to obtain accurate information about reddening, metallicity and distance. We will discuss most recent applications of the BSG-method and future work.
2 The perennial problem of interstellar extinction
Among the remaining uncertainties affecting the extragalactic distance scale, probably the most important one is interstellar reddening. As young stars, Cepheids tend to be embedded in dusty regions which produce a significant internal extinction, in addition to the galactic foreground extinction. Since Cepheids and BSGs belong to the same population and have a similar age, we can use the observations of BSGs to test whether reddening estimates for Cepheids seem reliable or not. Fig. 1 shows the reddening distributions of BSGs in three galaxies, NGC 300, M33 and M81, compared with the reddening value obtained in the HST Key Project (KP) (Freedman et al., 2001). We note that the reddening in these star forming spirals is extremely patchy and leads to a wide distribution of E(B-V). Moreover, the average reddening values obtain by the KP are in disagreement with the observed BSG reddening distribution. For NGC 300 and M81, reddening is underestimated and the opposite is the case for M33. This is alarming, since reddening errors of 0.1 to 0.2 mag transform into errors of 0.3 to 0.6 mag in the extinction corrected distance modulus.


In order to avoid distance moduli errors due to reddening the KP and most of the more recent Cepheid work, which used optical photometry (B, V, I), has applied the Wesenheit method, where a “reddening-free” combination of Cepheid V and I magnitudes, W=V-RVI(V-I) with RVI=AV/(AV-AI) is used for the fit of the period-luminosity relationship (PLR) (Gieren et al., 2004; Macri et al., 2006; McCommas et al., 2009; Shappee & Stanek, 2011; Gerke et al., 2011). AV and AI are the extinction at V- and I-band, respectively, and the ratio RVI=2.45 is obtained from Schlegel et al. (1998), who used the MW “standard reddening-law” in the analytical formulation given by Cardelli et al. (1989) for RV = 3.1. After the determination of the distance, the fit of the PLRs in V and I band allow for an estimate of average reddening. As illustrated by Fig. 1 this approach does not always lead to good agreement with the reddening information obtained from BSGs, although in some cases good agreement is found (compare Gieren et al. 2004 and Kudritzki et al. 2008).
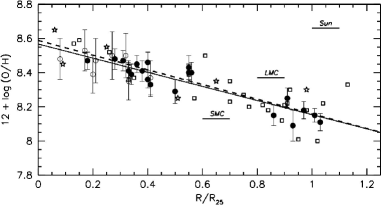
It is important to remember that in star forming galaxies large deviations from the standard value RV = 3.1 are frequently encountered. Fig. 2 shows the result of a very recent BSGs study in the LMC. How would such deviations affect the “reddening-free” W-magnitude as defined above? Fig. 3 demonstrates that the effects can be alarmingly large and certainly have the potential to influence the determination of distance moduli. The shift of W-magnitude W caused by a change of RV is well descibed by W=0.454(RV-3.1)*E(B-V).
Reddening effects become less important at near-IR wavelengths. In the Araucaria-Project, the combination of B, V, I photometry with J- and K-band observations has been used very successfully (see, for instance, Gieren et al. 2005). In a similar way, Riess et al. (2009b, 2011) have used H-band photometry with HST. However, while extinction is much smaller in the near-IR, it is not zero, as illustrated by Fig. 3. For “normal” reddening with RV = 3.1 an error of E(B-V)=0.2 mag leads to an extinction error AH=0.12 mag equivalent to a distance error d/d=5.5%. Equivalently, a reddening law with RV=4.6 at E(B-V)=0.3 mag produces a similar effect.Obviously, with the ambitious goal determine the H0 accurate to 1% this is something to keep in mind. This means that entirely independent and complementary approach to address the issue of reddening is highly desirable.
3 The important role of metallicity
An equally important uncertainty in the use of Cepheids as distance indicators is the dependence of the PLR on metallicity. Comparing HST photometry of Cepheids in inner and outer galactic fields Kennicutt et al. (1998) (for M101) and Macri et al. (2006) (for the maser galaxy NGC 4258) have found that inner field Cepheids yield shorter distance moduli by about 0.2 mag than the ones in the outer fields. They conclude that this is caused by the metallicity gradient of spiral galaxies and that the brightness of Cepheids increases with metallicity. Using metallicity information from H II region oxygen emission lines they adopt a metallicity correction of the distance modulus of the form =([Z]-[Z]LMC), where [Z]=logZ/Z⊙ is the metallicity relative to the sun on a logarithmic scale. -values between -0.2 and -0.3 were found. This agrees with Sakai et al. (2004), who related the difference between TRGB and Cepheid distances to the galactic H II region metallicities (not taking into account metallicity gradients, though) and derived a similar PLR dependence on metallicity.
However, these results are highly uncertain. Rizzi et al. (2007) have argued that many of the TRGB distances used by Sakai et al. (2004) need to be revised. With the Rizzi et al. (2007) TRGB distances the Sakai et al. (2004) dependence of the PLR on metallicity disappears and the results are in much closer agreement with stellar pulsation theory (Fiorentino et al., 2002, 2007; Marconi et al., 2005; Bono et al., 2008), which predicts just the opposite, namely that the brightness of Cepheid decreases with metallicity.
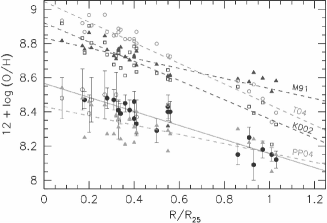
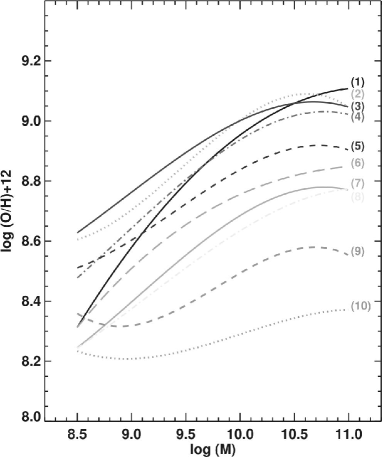
It is very important to note that all the H II region (oxygen) metallicities adopted, when comparing Cepheid distances with TRGB distances or when using metallicity gradients, are highly uncertain. They result from the application of a simplified analysis method, the so called “strong-line method”, which uses only the fluxes of the strongest forbidden lines of (most commonly) [OII] and [OIII] relative to Hβ. Unfortunately, abundances obtained with the strong-line method depend heavily on the calibration used. As a striking example, Kewley & Ellison (2008) have demonstrated that the quantitative shape of the mass-metallicity relationship of galaxies can change from very steep to almost flat depending on the calibration used (Fig. 4). In the same way, as shown by Kudritzki et al. (2008) and Bresolin et al. (2009), metallicity gradients of spiral galaxies can change from steep to flat and absolute values of metallicity can shift by as much as 0.6 dex, again as the result of different calibrations of the strong line method (Fig. 5). The Cepheid work on spiral galaxies usually uses the calibration by Zaritsky et al. (1994). As shown by Kudritzki et al. (2008), this calibration gives far too high metallicities.
The results displayed in Fig. 4 and 5 are shocking. They reveal that at present galaxy metallicities based on strong-line methods are uncertain by 0.6 to 0.8 dex because of the systematic uncertainties inherent in the strong line methods used. Even with a strictly differential approach in the use of Cepheids as distance indicators as applied by Riess et al. (2011) this still creates residual uncertainties, which become important in view of the ambitious goal to determine H0 with an accuracy of a few percent. This major problem requires a fresh approach and is begging for the development of a new and independent method less affected by systematic uncertainties. Very obviously, in order to better assess the systematic uncertainties of the determination of distances to star-forming spiral and irregular galaxies in the local universe an independent and complementary method is desirable, which can overcome the problems of interstellar extinction and variations of chemical composition. In the next section we introduce such a method, which is based on the quantitative spectroscopy of BSGs. The method makes use of the enormous intrinsic brightness of these objects.


4 Blue supergiants come to rescue
An obvious alternative method to constrain metallicity is the detailed quantitative spectroscopic analysis of individual stars in galaxies. While this may sound unfeasible at first glance, it is well within the capabilities of current technology. The brightest stars in the universe at visual light, blue supergiants (BSGs) of spectral type A and B are the perfect choice for this purpose. BSGs are massive stars in the mass range between 12 to 40 M⊙ in the short-lived evolutionary phase (103 to 105 years) when they leave the hydrogen main sequence and cross the HR-diagram at constant luminosity and almost constant mass to become red supergiants. Because of Wien’s law massive stars increase their brightness in visual light dramatically when evolving towards lower temperatures and reach absolute visual magnitudes up to M -9.5 mag in the BSG phase, rivaling with the integrated light of globular clusters and dwarf galaxies. Because of their extreme brightness they are ideal tools to accurately determine the chemical composition of young stellar populations in galaxies.
BSG spectra are rich in metal absorption lines from several elements (C, N, O, Mg, Al, S, Si, Ti, Fe, among others). As young objects with ages of 10 Myrs they provide important probes of the current composition of the interstellar medium. Abundance determinations of these objects can therefore be used to trace the present abundance patterns in galaxies, with the ultimate goal of recovering their chemical and dynamical evolution history. In addition to the -elements the spectral analysis of supergiants provides the only accurate way to obtain information about the spatial distribution of Fe-group element abundances in external star-forming galaxies. As outlined above, beyond the Local Group most of the information about the chemical properties of spiral galaxies has so far been obtained through the study of H II regions emission lines using strong-line methods, which have huge systematic uncertainties arising from their calibrations. Direct stellar abundance studies of BSGs open a completely new and more accurate way to investigate the chemical evolution of galaxies and are free of such uncertainties.


Based on detailed high resolution, very high signal-to-noise (S/N) studies of blue supergiants, which yield abundances as accurate as 0.05 dex (Przybilla et al., 2006; Schiller & Przybilla, 2008; Przybilla et al., 2008), Kudritzki et al. (2008) developed an efficient new spectral diagnostic technique for low resolution spectra (FWHM Å) with good S/N ratio (50 or better), which allows for an accurate determination of effective temperature, gravity, metallicity, interstellar reddening and extinction. Metallicities accurate to 0.1 to 0.2 dex for each individual target can be obtained at this lower resolution and S/N. The method has been applied to irregular and spiral galaxies in the Local Group (WLM – Bresolin et al. 2006; Urbaneja et al. 2008; NGC 3109 – Evans et al. 2007; IC 1613 – Bresolin et al. 2007; M33 – U et al. 2009) and beyond ( NGC 300– Kudritzki et al. 2008; M81– Kudritzki et al. 2011). In the following, we describe the diagnostic technique.
Targets are selected from HST or ground-based photometry, usually B, V, I (Fig. 6). Spectra are then taken using MOS spectrographs such as FORS at the VLT or LRIS at Keck providing both flux calibrated and continuum rectified spectra. The effective temperature Teff is determined from the fit of the Balmer jump and gravity log g from the Balmer lines (Fig. 7). For the values of Teff and log g obtained we can then calculate synthetic spectra as a function of metallicity and compare them with the observed spectrum in several selected spectral windows. A -fit obtained from the comparison of observed and calculated spectra then yields the metallicity with an accuracy between 0.1 to 0.2 dex per object. Fig. 8, 9, and 10 illustrate the method. We also emphasize that with , log g and [Z] determined we know the intrinsic SEDs and colors of the BSGs studied and, thus, can accurately determine reddening and extinction by comparing with the observed colors and SEDs.

Bresolin et al. (2009) carried out the crucial test to compare blue supergiant with H II region metallicities in NGC 300, the latter obtained through very deep and long exposures revealing the weak nebular electron temperature sensitive auroral lines such as [OIII]4363. Auroral lines provide a classical and physically well-understood method to measure abundances of ionized nebulae, but its use requires a substantial additional observational effort at higher metallicity, where these lines are very weak. The excellent agreement between BSGs and the information obtained from H II regions using auroral lines is encouraging and promising (Fig. 11).
Bresolin et al. (2009) also perform an important experiment. They use their new and very accurate measurements of strong line fluxes and simply apply a set of different strong line calibrations to obtain oxygen abundances without using the information from the auroral lines. The result of this experiment compared with the oxygen abundances using the auroral lines is shown in Fig. 5. As already discussed, the comparison is shocking. The abundance offsets introduced by the application of inappropriate strong-line calibrations can be as large as 0.6 dex, putting the whole business of defining metallicity corrections for Cepheid distance moduli through the measurement of nebular metallicities and metallicity gradients into jeopardy.
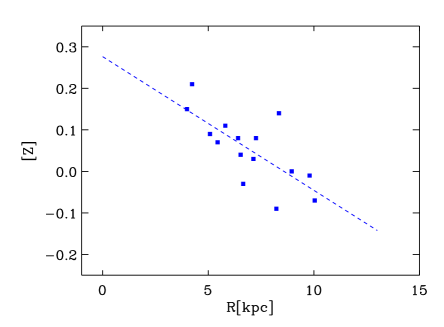
On the other hand, BSGs are an excellent tool to obtain accurate metallicity information about the young stellar population in galaxies. Fig. 12 gives an example for the giant spiral M81 at 3.5 Mpc distance. This galaxy has slightly super-solar metallicity (0.2 dex) in the inner regions and a very shallow abundance gradient of 0.034 dex kpc-1. A linear regression yields [Z]=0.286-0.034R/kpc. We note that the H II region strong-line study by Zaritsky et al. (1994) obtains much higher metallicities and a slightly steeper gradient [Z]=0.51-0.041R/kpc, which is crucial for the Cepheid distance modulus metallicity correction (see section 7). (Here, oxygen is taken as a proxy for metallicity and we use [O/H]=12+log(O/H)=8.69 from Allende Prieto et al. 2001 as the value for the solar oxygen abundance).
The BSG studies of the less massive galaxies NGC 300 (Kudritzki et al., 2008) and M33 (U et al., 2009) resulted in gradients of 0.08 and 0.07 dex kpc-1, respectively, steeper than M81 but still very shallow. For the metallicity correction of Cepheid distance moduli this has severe consequences, as will be discussed in section 7.


5 BSGs as extragalactic distance indicators – the FGLR-method
As first demonstrated by Kudritzki et al. (2003) there is a very simple and compelling way to use BSGs for distance determinations. Massive stars with masses in the range from 12 to 40 M⊙ evolve through the BSG stage at roughly constant luminosity. In addition, since the evolutionary timescale is very short when crossing through the BSG domain, the amount of mass lost in this stage is small. As a consequence, the evolution proceeds at constant mass and constant luminosity. This has a very simple, but very important consequence for the relationship between gravity and effective temperature along the evolution towards the RSG stage, namely that the flux-weighted gravity log gF, defined as log gF = log g - 4log (Teff/104), stays constant. As shown in detail by Kudritzki et al. (2008) this immediately leads to the flux-weighted gravity–luminosity relationship (FGLR):
| (1) |
In practice this means that, after careful calibration the luminosity of BSGs can be inferred by a purely spectroscopic method from measurements of the effective temperature and effective gravity alone. Using the new spectral diagnostic techniques described above, Kudritzki et al. (2008) determined blue supergiant temperatures and gravities for a large sample of BSGs in NGC 300. They then used the comparison of the calculated spectral energy distributions with multi-color HST photometry to precisely determine interstellar reddening and extinction, in order to obtain de-reddened visual and bolometric magnitudes. This revealed a beautiful and tight FGLR (Fig. 13). Including the results from quantitative spectroscopy of eight more galaxies then led to a first calibration (Fig. 14 ). With a relatively small residual scatter of 0.3 mag the observed FGLR is an excellent tool to determine accurate spectroscopic distance to galaxies. It requires multicolor photometry and low resolution (5Å) spectroscopy to determine effective temperature and gravity and, thus, flux-weighed gravity directly from the spectrum. With effective temperature, gravity and metallicity determined one also knows the bolometric correction, which is small for A supergiants, which means that errors in the stellar parameters do not largely affect the determination of bolometric magnitudes. Moreover, one knows the intrinsic stellar SED and, therefore, can determine interstellar reddening and extinction from the multicolor photometry, which then allows for the accurate determination of the reddening-free apparent bolometric magnitude. The application of the FGLR then yields absolute magnitudes and, thus, the distance modulus.


6 First distance determinations with the FGLR
The first distance determination of this type has been carried out by Urbaneja et al. (2008) who studied blue supergiants in WLM, one of the faintest dwarf irregular galaxies in the Local Group. The quantitative spectral analysis of VLT FORS spectra yields an extremely low metallicity of the young stellar population in this galaxy with an average of -0.9 dex below the solar value. The interstellar extinction is again extremely patchy ranging from 0.03 to 0.30 mag in E(B-V) (note that the foreground value given by Schlegel et al. 1998 is 0.037 mag). The individually de-reddened FGLR - in apparent bolometric magnitude - is shown in Fig. 15 yielding a distance modulus of 24.99 mag in very good agreement with the TRGB distance (Rizzi et al., 2007) and the K-band Cepheid distance (Gieren et al., 2008).
U et al. (2009) have used KECK DEIMOS and ESI spectra to determine a distance to the Triangulum galaxy M33. The case of M33 is particularly interesting, since many independent distance determinations have been carried out for this galaxy during the last decade using a variety of techniques, including Cepheids, RR Lyrae, TRGB, red clump stars, planetary nebulae, horizontal branch stars and long-period variables. The surprising result of all of these studies has been that the distance moduli obtained with these different methods differ by as much as 0.6 mag, which is more than 30% in linear distance. The FGLR-method yields a long distance modulus for M33 of 24.93 mag, in basic agreement with a TRGB distance of 24.84 mag obtained by the same authors from HST ACS imaging. The long distance modulus agrees also very well with the eclipsing binary distance obtained by Bonanos et al. (2006). U et al. relate the difference between their result and the published Cepheid distances to the difference in accounting for interstellar reddening (see Fig. 1).
Kudritzki et al. (2011) analyzed Keck LRIS spectra of BSGs in M81 and applied the FGLR method to obtain a distance modulus of 27.7 mag in good agreement with recent TRGB work (Fig. 16). The comparison with Cepheid distances is discussed in the next section.
These successful first applications of the FGLR-method for distance determinations indicate the very promising potential of the method to provide an independent constraint on the extragalactic distance scale.
7 BSG metallicity and distance determinations and the metallicity dependence of the Cepheid period-luminosity relationship
In this section we use the results from the BSG studies to discuss Cepheid distances and the “standard” approach for their metallicity correction. We start with M81 (the discussion presented here closely follows the one given by Kudritzki et al. 2011). In addition to the HST Key Project work on M81 (Freedman et al., 1994, 2001) there are two recent Cepheid studies by McCommas et al. (2009) and by Gerke et al. (2011). McCommas et al. (2009) use HST light curves of 11 fundamental and two first overtone short period Cepheids in the outer disk of M81 at 13.5 kpc galactocentric distance. Gerke et al. (2011) investigate 107 long period Cepheids observed with the LBT in a galactocentric range of 3.5 to 10.5 kpc with ground-based B, V, I photometry. Applying the Wesenheit VI method, both studies obtain a distance modulus relative to the LMC which is 0.17 mag longer than the BSG result. However, this is based on a metallicity correction = ([Z] - [Z]LMC), which is motivated by the fact that the inner field Cepheids observed by the KP yield a distance modulus, which is 0.23 mag shorter relative to the outer fields without such a correction applied. They use Zaritsky et al. (1994) for metallicity [Z] and the metallicity gradient and [Z]LMC=-0.19 for the LMC oxygen abundance (see section 4, 2nd to last paragraph). This metallicity gradient requires a highly negative value of , = -0.55 mag dex-1, to account for the inner and outer field Cepheid distance moduli differences.
Applying the BSG metallicity gradient would require an even more negative value of , namely = -0.65 mag dex-1. Moreover, the LMC oxygen abundance in these corrections is too large compared with the LMC oxygen abundance of B-stars found by Hunter et al. (2007) ([Z]LMC = -0.36 dex), the iron abundances of LMC Cepheids determined by Romaniello et al. (2008) and Luck et al. (1998) ([Z]LMC = -0.33 dex), and the LMC H II region oxygen abundances obtained by Bresolin (2011) ([Z]LMC = -0.33 dex). This means that with the BSG metallicity values in M81 the Cepheids in the outer field have a metallicity 0.11 dex higher than the LMC. If one would apply the metallicity correction with = -0.65 mag dex-1 accordingly, this would enlarge the distance modulus by another 0.07 mag.
However, with such a large negative value of it is important to note that this empirical correction, which claims that Cepheids become brighter with increasing metallicity, is in striking disagreement with pulsation theory, which predicts exactly the opposite, namely that the Cepheid brightness decreases with increasing metallicity (Fiorentino et al., 2002; Marconi et al., 2005; Fiorentino et al., 2007; Bono et al., 2008). It also disagrees with the recent high S/N, high spectral resolution quantitative spectroscopy in the Milky Way and the LMC carried out by Romaniello et al. (2008), which confirms the prediction by pulsation theory. According to this work, the value of should be positive and not negative. In other words, as careful spectroscopic metallicity studies compared with observed differences of distance moduli between inner and outer field Cepheids push to increasingly negative values, an explanation of that distance modulus differences in terms of metallicity seems unlikely. It must be something else and it is an additional systematic effect not understood.
We also note that U et al. (2009) have demonstrated from their quantitative spectroscopy of blue supergiants in M33 that the difference of distance moduli between inner field and outer field Cepheids found by Scowcroft et al. (2009) would require a -value of -0.55 mag dex-1. Even worse, Bresolin et al. (2010) re-determined H II region abundances in M33 using auroral lines and applying their abundance gradient to the Cepheid fields in M33 yields = - 1.2 mag dex-1 (see discussion in Bresolin 2011).
Another galaxy where the comparison of Cepheids in the inner and outer fields leads to a significantly different distance modulus is the maser galaxy NGC 4258. This galaxy is of particular importance, since it has been used as the new anchor point for the extragalactic distance scale by Riess et al. (2009a, b, 2011) because of its accurately known distance from the Keplerian motion of water masers orbiting the central black hole (Humphreys et al., 2008). Macri et al. (2006) based on the H II region strong line method oxygen abundances by Zaritsky et al. (1994) derived a -value of -0.29 mag dex-1. However, most recently, Bresolin (2011) re-determined the H II region metallicities in this galaxy including the observation of auroral lines in a few cases. This led to a downward substantial revision of the metallicity, which seems to be close to the LMC and not strongly super-solar, and a very shallow abundance gradient. Based on these results, Bresolin (2011) show that = - 0.69 mag dex-1 would be needed to explain the distance modulus difference between inner and outer fields, again a value much too negative, when compared with pulsation theory and observational work on Milky Way and LMC Cepheids. While the improved H II region work on this important galaxy still awaits an independent confirmation through a study of BSGs, it is an additional clear indication of a systematic effect on Cepheid distance moduli not understood at this point. Majaess et al. (2011) discuss the large metallicity corrections suggested by Gerke et al. (2011) and by the recent HST/ACS Cepheid study of M101 by Shappee & Stanek (2011) and demonstrate that such corrections lead to very improbable distances of the LMC and SMC. The work by Storm et al. (2011) indicates that a lower limit for is -0.2 mag dex-1 (see also the contribution by Jesper Storm in this volume). Majaess et al. (2011) argue that crowding is very likely responsible for the distance modulus differences obtained between inner and outer field Cepheids and not metallicity. We think that a careful spectroscopic investigation of galactic metallicities and their gradients and distance determinations using the FGLR as an independent method will help to clarify the situation.
8 The potential of BSG spectroscopy
In this paper we have demonstrated that the quantitative spectroscopy of BSGs is a promising tool to constrain the chemical evolution of galaxies and to determine their distances through the FGLR-method. The BSG results with regard to metallicity and metallicity gradient confirmed previous studies based on the use of auroral lines of H II regions that the systematic differences between distance moduli obtained from inner and outer field Cepheids (found in M33, M81, M101, NGC 4258) are very likely not caused by a metallicity dependence of the period-luminosity relationship of Cepheids. There must be another reason for these systematic differences.
The FGLR technique has the unique advantage that individual reddening and extinction values, together with metallicity, can be determined for each supergiant target directly from spectroscopy combined with photometry. This reduces significantly the systematic uncertainties affecting competing methods such as Cepheids or TRGB. The results by Kudritzki et al. (2008, 2011) and U et al. (2009) for NGC 300, M 81 and M33, respectively, demonstrate that the reddening in spiral galaxies is extremely patchy so that the application of an ‘average extinction’ correction, even with the correct value, is questionable. The FGLR technique is robust. Bresolin et al. (2004, 2006) have shown, from observations in NGC 300 and WLM, that the photometric variability of BSGs has negligible effect on the distances determined through the FGLR. Moreover, the study by Bresolin et al. (2005) also confirms that with HST photometry the FGLR method is not affected by crowding out to distances of at least 30 Mpc. This is the consequence of the enormous intrinsic brightness of these objects, which are 3 to 6 magnitudes brighter than Cepheids. It is evident that the type of work described in this paper can be in a straightforward way extended to the many spiral galaxies and star forming galaxies in a surprisingly large volume the local universe. By using present day 8m to 10m class telescopes and the existing very efficient multi-object spectrographs one can reach down with sufficient S/N to V = 22.5 mag in two nights of observing time under very good conditions. For objects brighter than MV = -8 mag this means metallicities and distances can be determined out to distances of 12 Mpc ( = 30.5mag). With the next generation of extremely large telescopes such as the TMT, GMT or the E-ELT the limiting magnitude can be pushed to V = 24.5 equivalent to distances of 30 Mpc ( = 32.5 mag).
The application of the FGLR-method and the metallicity diagnostic on a large sample of galaxies will provide an independent check of the systematics of the well established methods, such as the use of Cepheids and the TRGB. In this way we will be able to investigate the effects of metallicity and extinction, which continue to be important issues. One first crucial step will be the spectroscopic investigation of the population of BSGs in the maser galaxy NGC 4258, the very promising new anchor point of the extragalactic distance scale. This work is under way.
One weakness of the FGLR-method at this stage is that its calibration relies on the assumption of a distance to the LMC. No reliable parallaxes are available for a sufficiently large sample of BSGs in the MW. However, this will change with GAIA mission, which will deliver accurate distances to hundreds of MW BSGs allowing for a precise galactic calibration of the FGLR. With this calibration BSGs will become powerful primary distance indicators enabling a very accurate determination of the Hubble constant.
Acknowledgements This work is the result of an ongoing collaborative effort over many years. We wish to thank the “Araucarians” Wolfgang Gieren and Grzegorz Pietrzynski for inviting us to join their project and for their many contributions. Norbert Przybilla from Bamberg Observatory and Joachim Puls from Munich University Observatory have developed and provided the model atmosphere and radiative transfer framework, which is essential for our work. Special thanks go to our colleagues in Hawaii, Fabio Bresolin, Zach Gazak, and Vivian U for their tremendous dedication and skillful contributions to make this project happen.
This work was supported by the National Science Foundation under grant AST-1008798. In addition, RPK acknowledges support by the Alexander-von-Humboldt Foundation and the hospitality of the Max-Planck-Institute for Astrophysics in Garching and the University Observatory Munich.
References
- Allende Prieto et al. (2001) Allende Prieto, C., Lambert, D. L., & Asplund, M. 2001, ApJ, 556, L63
- Bonanos et al. (2006) Bonanos, A. Z., Stanek, K. Z., Kudritzki, R. P., et al., 2006, ApJ, 652, 313
- Bono et al. (2008) Bono, G., Caputo, F., Fiorentino, G., et al. 2008, ApJ, 684, 102
- Bresolin et al. (2004) Bresolin, F., Pietrzyński, G., Gieren, W.., et al. 2004, ApJ, 600, 182
- Bresolin et al. (2005) Bresolin, F., Pietrzyński, G., Gieren, W.., et al. 2005, ApJ, 634, 1020
- Bresolin et al. (2006) Bresolin, F., Pietrzyński, G., Urbaneja, M. A., et al. 2006, ApJ, 648, 1007
- Bresolin et al. (2007) Bresolin, F., Urbaneja, M. A., Gieren, W., Pietrzyński, G., & Kudritzki, R.-P. 2007, ApJ, 671, 2028
- Bresolin et al. (2009) Bresolin, F., Gieren, W., Kudritzki, R.-P., et al. 2009, ApJ, 700, 309
- Bresolin et al. (2010) Bresolin, F., Stasińska, G., Vílchez, J. M., Simon, J. D., et al. 2010, MNRAS, 404, 1679
- Bresolin (2011) Bresolin, F. 2011, ApJ, 729, 56
- Cardelli et al. (1989) Cardelli, J. A., Clayton, G. C., & Mathis, J. S. 1989, ApJ, 345, 245
- Dalcanton et al. (2009) Dalcanton, J. J., Williams, B. F., Seth, A. C., et al. 2009, ApJS, 183, 67
- Evans et al. (2007) Evans, C. J., Bresolin, F., Urbaneja, M. A., et al. 2007, ApJ, 659, 1198
- Fiorentino et al. (2002) Fiorentino, G., Caputo, F., Marconi, M., et al. 2002, ApJ, 576, 402
- Fiorentino et al. (2007) Fiorentino, G., Marconi, M., Musella, I., et al. 2007, A&A, 476, 863
- Freedman et al. (1994) Freedman, W. L., Hughes, S. M., Madore, B. F., et al. 1994, ApJ, 427, 628
- Freedman et al. (2001) Freedman, W. L., Madore, B. F., Gibson, B. K., et al. 2001, ApJ, 553, 47
- Gerke et al. (2011) Gerke, J. R., et al. 2011, arXiv:1103.0549
- Gieren et al. (2004) Gieren, W., et al. 2004, AJ, 128, 1167
- Gieren et al. (2005) Gieren, W., Pietrzynski, G., Soszynski, I., et al. 2005, ApJ, 628, 695
- Gieren et al. (2008) Gieren, W., Pietrzynski, G., Szewcyk, O., et al. 2008, ApJ, 683, 611
- Hunter et al. (2007) Hunter, I., Dufton, P. L., Smartt, S. J., et al. 2007, A&A, 466, 277
- Humphreys et al. (2008) Humphreys, E. M. L., Reid, M. J., Greenhill, L. J., et al. 2008, ApJ, 672, 800
- Kennicutt et al. (1998) Kennicutt, R. C., Stetson, P. B., Saha, A., et al. 1998, ApJ, 498, 181
- Kewley & Dopita (2002) Kewley, L. J., & Dopita, M. A. 2002, ApJS, 142, 35
- Kewley & Ellison (2008) Kewley, L. J., & Ellison, S. L. 2008, ApJ, 681, 1183
- Kobulnicky & Kewley (2004) Kobulnicky, H. A., & Kewley, L. J. 2004, ApJ, 617, 240
- Komatsu et al. (2009) Komatsu, E., Dunkley, J., Nolta, M. R., et al. 2009, ApJS, 180, 330
- Kudritzki et al. (2003) Kudritzki, R. P., Bresolin, F., & Przybilla, N. 2003, ApJ, 582, L83
- Kudritzki et al. (2008) Kudritzki, R.-P., Urbaneja, M. A., Bresolin, F., et al. 2008, ApJ, 681, 269
- Kudritzki et al. (2011) Kudritzki, R. P., Urbaneja, M. A., Gazak, J. Z., et al. 2011, ApJ, in press (arXiv: 1112.3643)
- Luck et al. (1998) Luck, R. E., Moffett, T. J., Barnes, T. G., & Gieren, W. 1998, AJ, 115, 605
- Macri et al. (2006) Macri, L. M., Stanek, K. Z., Bersier, D., et al. 2006, ApJ, 652, 1133
- Majaess et al. (2011) Majaess, D., Turner, D., & Gieren, W. 2011, ApJ, 741 L36
- Marconi et al. (2005) Marconi, M., Musella, I., & Fiorentino, G. 2005, ApJ, 632, 590
- McCommas et al. (2009) McCommas, L. P., Yoachim, P., Williams, B. F., et al. 2009, AJ, 137, 4707
- McGaugh (1991) McGaugh, S. S. 1991, ApJ, 380, 140
- Pettini & Pagel (2004) Pettini, M., & Pagel, B. E. J. 2004, MNRAS, 348, L59
- Przybilla et al. (2006) Przybilla, N., Butler, K., Becker, S. R., & Kudritzki, R. P. 2006, A&A, 445, 1099
- Przybilla et al. (2008) Przybilla, N., Nieva, M. F., Heber, U., & Butler, K. 2008, ApJ, 684, L103 (a)
- Riess et al. (2009a) Riess, A. G., Macri, L., Li, W., et al. 2009, ApJS, 183, 109 (a)
- Riess et al. (2009b) Riess, A. G., Macri, L., Casertano, S., et al. 2009, ApJ, 699, 539 (b)
- Riess et al. (2011) Riess, A. G., Macri, L., Casertano, S., et al. 2011, ApJ, 730, 119
- Rizzi et al. (2007) Rizzi, L., Tully, R. B., Makarov, D., et al. 2007, ApJ, 661, 815
- Romaniello et al. (2008) Romaniello, M., Primas, F., Mottini, M., et al. 2008, A&A, 488, 731
- Sakai et al. (2004) Sakai, S., Ferrarese, L., Kennicutt, R. C., Jr., & Saha, A. 2004, ApJ, 608, 42
- Schlegel et al. (1998) Schlegel, D. J., Finkbeiner, D. P., & Davis, M. 1998, ApJ, 500, 525
- Scowcroft et al. (2009) Scowcroft, V., Bersier, D., Mould, J. R., & Wood, P. R. 2009, MNRAS, 396, 1287
- Schiller & Przybilla (2008) Schiller, F., & Przybilla, N. 2008, A&A, 479, 849
- Shappee & Stanek (2011) Shappee, B. J, & Stanek, K. Z., 2011, ApJ, 733, 124
- Spergel (2006) Spergel, D. 2006, APS April Meeting Abstracts, 5002
- Spergel et al. (2007) Spergel, D. N., Bean, R., Doré, O., et al. 2007, ApJS, 170, 377
- Storm et al. (2011) Storm, J., Gieren, W., Fouque, P., et al. 2011, arXiv:1109.2016
- Tegmark et al. (2004) Tegmark, M., Strauss, M. A., Blanton, M. R., et al. 2004, Phys. Rev. D, 69, 103501
- Tremonti et al. (2004) Tremonti, C. A., Heckman, T. M., Kauffmann, G., et al. 2004, ApJ, 613, 898
- U et al. (2009) U, V., Urbaneja, M. A., Kudritzki, R.-P., et al. 2009, ApJ, 704, 1120
- Urbaneja et al. (2005a) Urbaneja, M. A., Herrero, A., Bresolin, F., et al. 2005, ApJ, 622, 862
- Urbaneja et al. (2005b) Urbaneja, M. A., Herrero, A., Kudritzki, R.P., et al. 2005, ApJ, 635, 311
- Urbaneja et al. (2008) Urbaneja, M. A., Kudritzki, R.-P., Bresolin, F., et al. 2008, ApJ, 684, 118
- Urbaneja et al. (2011) Urbaneja, M. A., Kudritzki, R.-P., Pietrzynski, G., et al. 2011, in preparation for ApJ
- Zaritsky et al. (1994) Zaritsky, D., Kennicutt, R. C., Jr., & Huchra, J. P. 1994, ApJ, 420, 87