Chemical evolution of the Milky Way: the origin of phosphorus
Abstract
Context. Recently, for the first time the abundance of P has been measured in disk stars. This provides the opportunity of comparing the observed abundances with predictions from theoretical models.
Aims. We aim at predicting the chemical evolution of P in the Milky Way and compare our results with the observed P abundances in disk stars in order to put constraints on the P nucleosynthesis.
Methods. To do that we adopt the two-infall model of galactic chemical evolution, which is a good model for the Milky Way, and compute the evolution of the abundances of P and Fe. We adopt stellar yields for these elements from different sources. The element P should have been formed mainly in Type II supernovae. Finally, Fe is mainly produced by Type Ia supernovae.
Results. Our results confirm that to reproduce the observed trend of [P/Fe] vs. [Fe/H] in disk stars, P is formed mainly in massive stars. However, none of the available yields for P can reproduce the solar abundance of this element. In other words, to reproduce the data one should assume that massive stars produce more P than predicted by a factor of 3.
Conclusions. We conclude that all the available yields of P from massive stars are largely underestimated and that nucleosynthesis calculations should be revised. We also predict the [P/Fe] expected in halo stars.
Key Words.:
Galaxy: abundances - Galaxy: evolution - Stars: Gamma-ray burst: general - Stars: supernovae: general1 Introduction
Recently, Caffau et al. (2011a) have measured the P abundance in a sample of 20 cool stars in the Galactic disk. They found that the [P/Fe] ratio behaves like the [S/Fe] ratio, namely increasing towards lower metallicity stars. This was the first time that P was observed in Galactic stars in spite of the fact that P is among the top 20 most abundant elements in the Universe. There is only one single stable isotope of P, 31P, which is thought to be formed by neutron capture on 29Si and 30Si in massive stars. By means of a detailed model for the chemical evolution of the Milky Way one can compute the P evolution and compare it to the observations. This can allow us to understand the origin of this element and impose constraints on its formation inside stars. In this paper, we adopt a good model for the chemical evolution on the Galaxy, already tested on a large number of chemical species (François et al. 2004). In particular, the model takes into account detailed stellar nucleosynthesis and supernova progenitors (SNe Ia, II, Ib/c) as well as the stellar lifetimes. The stellar yields of P have been computed by several authors such as Woosley & Weaver (1995), Kobayashi et al. (2006) as functions of the initial stellar metallicity. In this paper we like to compare the predictions of our chemical evolution model for P, obtained by including different stellar yields, with the recent data. In Section 2 we briefly describe the chemical evolution model adopted, in Section 3 we describe the observational data. In Section 4 the results are compared to the data and finally, in Section 5, some conclusions are drawn.
2 The chemical evolution model
The role played by SNe of different Type in the chemical evolution of the Galaxy has been computed by several authors in the past years (Matteucci & Greggio, 1986; Matteucci & François 1989; Yoshii et al. 1996; Chiappini et al. 1997, 2001; Kobayashi etal. 2006; Boissier & Prantzos 1999; François et al . 2004 among others). Here we refer to the model of Chiappini et al. (1997), the so-called two-infall model for the evolution of the Milky Way. A thorough description of this model can be found in Chiappini et al. (1997; 2001) and François et al. (2004) and we address the reader to these papers for details. In this model it is assumed that the stellar halo formed on a relatively short timescale (1-2 Gyr) by means of a first infall episode, whereas the disk formed much more slowly, mainly out of extragalactic gas, thanks to a second infall episode. The timescale for the disk formation is assumed to increase with the galactocentric distance ( Gyr at the solar circle), thus producing an “inside-out” scenario for the disk formation. The Galactic disk is divided in several rings, 2Kpc wide, without exchange of matter between them. The model can follow in detail the evolution of several chemical elements including H, D, He, C, N, O, -elements, Fe and Fe-peak elements, s- and r-process elements. The star formation rate (SFR) adopted for the Milky Way is a function of both surface gas density and total surface mass density. Such a SFR is proportional to a power of the surface gas density and to a power of the total surface mass density. In the Milky Way model we also assume a surface density threshold below which the SFR stops, according to Kennicutt (1989). As a consequence of this, the star formation rate goes to zero every time that the gas density decreases below the threshold (). The efficiency of SF is during the disk and 2 in the halo phase. This model reproduces the majority of the features of the solar vicinity and the whole disk.
2.1 Nucleosynthesis and stellar evolution prescriptions
We have adopted the yields for P and Fe originating in massive stars from Woosley & Weaver (1995, hereafter WW95) and Kobayashi et al. (2006, hereafter K06) as functions of stellar metallicity. The yields for the same elements originating from SNe Ia are from Iwamoto et al. (1999), their model W7. In particular, each SN Ia is assumed to eject the same mass, the Chandrasekhar mass (); of this mass is in the form of Fe and are in the form of P. It is therefore clear that SNe Ia are negligible producers of P. On the other hand, 31P should be produced during O- and Ne- shell burnings in massive stars, although a large fraction of 31P can be destroyed by (p,) reactions to become 28Si.
3 The observational data
The sample of observed stars is formed by 20 G-F bright dwarfs (), with stellar parameters in the ranges: K, , .
The phosphorus abundance has been derived from CRIRES spectra observed at VLT-Antu 8 m telescope, in service mode during ESO period 86. The setting was centered at 1059.6 nm in order 54. Four P lines of Mult. 1 are visible in detectors 2 and 3. The spectral resolution was R=100 000, the signal-to-noise ratios achieved were in the range 50-400. For the Adaptive Optics correction, computed on axis, the target star itself was used.
4 Results for phosphorous
We have run several models including different prescriptions for the P and Fe yields from massive stars. In some of the models we mixed yields from different sources and this is allowed by the fact that yields of some specific elements, in particular those of P and Fe, are still uncertain, because of the different input physics adopted by different authors. As a consequence, by means of our chemical evolution models we can put constraints on the nucleosynthesis calculations.
The models are:
-
•
Model 1: with the P yields from massive stars of K06 and the Fe yields from massive stars of WW95 considering only the solar chemical composition. This choice is dictated by the fact that these Fe yields better reproduce the [X/Fe] vs. [Fe/H] relations (see François et al. 2004);
-
•
Model 2: with the P yields from massive stars of K06 and metallicity dependent Fe yields from massive stars of WW95;
-
•
Model 3: with the metallicity dependent P yields from massive stars of WW95 and the Fe yields from massive stars of WW95 considering only the solar chemical composition;
-
•
Model 4: with metallicity dependent P and Fe yields from massive stars of WW95;
-
•
Model 5: with P and Fe metallicity dependent yields from massive stars of K06;
-
•
Model 6: where the yields of P and Fe from massive stars are from K06 and include also hypernovae (hypernovae are stars with and explosion energies larger than normal SNe II);
-
•
Model 7: the only difference compared to model 5 is that in this model the P yields in massive stars are artificially increased by a factor of 3;
-
•
Model 8: the only difference compared to model 6 is that in this model the P yields in massive stars are artificially increased by a factor of 2.75.
In order to obtain the [P/Fe] ratios, we have normalized our model results for P and Fe with the observed absolute solar abundances obtained by Caffau et al. (2011b). In this way, one can see at the same time whether the model predictions fit the trend as well as the solar abundances. The predicted solar abundances are the abundances that the model predicts for the ISM 4.5 Gyr ago, the time of formation of the solar system.
In Table 1 we show a summary of the nucleosynthesis prescriptions used for P and Fe in the models and the difference between the predicted solar abundances and the observed ones by Caffau et al. (2011b). Note that the yields of P and Fe from SNe Ia are from Iwamoto et al. (1999) in all models.
| Model | P from massive stars | Fe from massive stars | [P/Fe]⊙ model |
|---|---|---|---|
| 1 | K06 | WW95 solar chem. comp. | -0.41 |
| 2 | K06 | WW95 met.dep. | -0.42 |
| 3 | WW95 met. dep. | WW95 solar chem comp. | +0.06 |
| 4 | WW95 met. dep. | WW95 met.dep. | +0.05 |
| 5 | K06 | K06 | -0.40 |
| 6 | K06+ Hypern. | K06+ Hypern | -0.37 |
| 7 | 3 K06 | K06 | 0.00 |
| 8 | 2.75 K06 + Hypern. | K06+ Hypern. | 0.00 |
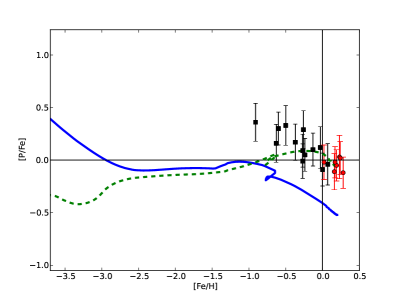
In Figure 1 are shown the results of Models 1 and 3. As one can see, for Model 1 the agreement with the observed trend in the Galactic disk is good, although the curve is shifted to lower values than observed. This is due to the fact that while the solar Fe abundance predicted by this model is in good agreement with the observed one, the P solar abundance is too low. In particular, in order to reproduce the P solar abundance we need to increase artificially the yields of P from massive stars by a factor of 3. On the other hand, we note that the results of Model 3 are not able to reproduce the trend of the [P/Fe] ratio in the Galactic disk although the predicted solar value is almost acceptable (+0.06 dex, in Table 1).
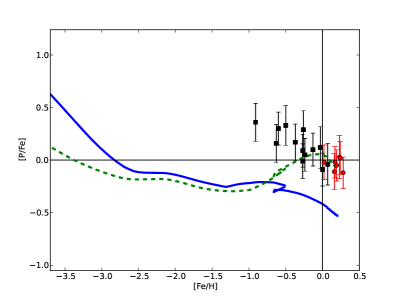
In Fig. 2 are shown Models 2 and 4: for Model 2 the agreement with the observed trend in the Galactic disk is good, whereas for Model 4 the trend is not reproduced, although, as for Model 3, the predicted solar value could be acceptable (+0.05, Table 1). To obtain a good agreement with the observed solar abundance of P for Model 2, we need again to increase artificially the yields of P by a factor of 3.
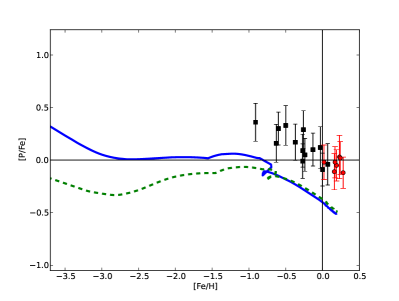
In Figure 3 we show the predictions of Model 5 with metallicity dependent yields from K06 for both P and Fe. Even for these yields we predict a too low solar ratio of dex. In other words, although the trend of [P/Fe] in the Galactic disk is well reproduced, to have good agreement with the data the whole curve should be shifted upwards by 0.4 dex.
In the same Figure 3 we also show the predictions of Model 6 with the metallicity dependent yields from K06 for both P and Fe, but for stars more massive than 20M⊙ we adopted the yields for hypernovae, instead of those for normal SNe II. The agreement with the observed solar ratio here is slightly better being dex, although the problem of the too low predicted solar P abundance remains.
The agreement of Models 1,2,5 and 6 with the trend of the data and the disagreement with the observed solar abundances, suggests that the major producers of P in the Universe should be core-collapse supernovae and that the theoretical yields from these supernovae are underestimated by a factor of 3. However, the results of Model 6 with yields from hypernovae differ substantially from those obtained with normal yields from SNe II at low metallicities. In fact, the model with normal SNII yields predicts an overabundance of P relative to Fe at low metallicity of +0.5 dex, whereas the model with hypernova yields predict a lower [P/Fe] ratio, namely an overabundance of + 0.2-0.3 dex. Clearly these predictions await to be proven by future data in low metallicity halo stars.
On the other hand, the trend of abundances of [P/Fe] in the Galactic disk as predicted by Models 3 and 4, adopting the metallicity dependent yields of P and Fe from massive stars by WW95, is at variance with observations even if we normalize the model results to their predicted solar abundances. Actually, the predictions of Model 4 are very similar to those of Timmes & al. (1995): these authors adopted, in fact, the same yields from massive stars for P and Fe as in Model 4, and showed the predicted [P/Fe] vs. [Fe/H], but no data for P were available at that time.
From our numerical simulations, we can also infer that the theoretical predictions from different authors for Fe are similar, whereas for P the yields by K06 and by WW95 are significantly different. We should therefore conclude that the yields of P by K06 are better than those of WW95, since the former can well reproduce the trend of [P/Fe] vs. [Fe/H] and the P solar abundance by increasing them by a factor of .
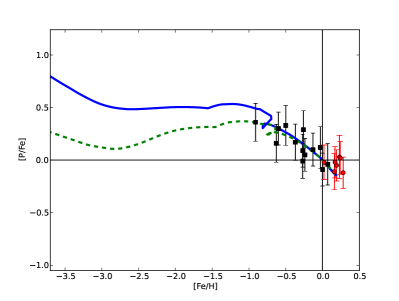
For this reason and for the sake of having a more homogeneous set of yields, we only show in the next figure the results obtained by including the K06 yields either with or without hypernovae. In particular, Model 7 is based on normal massive stars yields whereas Model 8 is based on hypernovae yields. In these models, shown in Fig. 4, we apply the necessary factor in the production of P in massive stars to reproduce the observed solar abundance of P. In fact, as one can see in Figure 4, the predicted curve passes exactly by zero and this is because our model can reproduce, at the same time, the solar abundance of Fe and that of P. It is worth noting that adopting the hypernova yields which are larger for P than those for normal core-collapse SNe, the yields need to be increased by a factor of 2.75, instead of 3. With the corrected yields and the observed solar abundance, the predicted [P/Fe] for [Fe/H] -1.0 dex is on average +0.2-0.3 dex.
5 Conclusions
In this paper we have compared model predictions adopting different sets of yields with recent data on the abundance of P in the Galactic disk. Our conclusions can be summarized as follows:
-
•
The observed fall of the abundance of [P/Fe] in Galactic disk stars suggests that P is mainly produced by core-collapse SNe with a small contribution from SNe Ia. Otherwise, if SNe Ia were important the [P/Fe] ratio would remain fairly constant.
-
•
The metallicity dependent yields of P from massive stars of K06 together with the P yields from SNe Ia from Iwamoto et al. (1999) well reproduce the data if the yields from massive stars are increased by a factor of 3. This suggests that the yields of P available in the literature are underestimated. Both the neutron rich isotopes of 29,30Si and 31P, which derives from neutron capture on the two Si isotopes, are produced in the oxygen and neon burning shells in massive stars (WW95). Therefore, in order to have a larger P production, the O and Ne shell- burnings as well as the neutron capture on the 29,30Si isotopes and the destruction of 31P by (p, ) reactions should be revised.
-
•
We predict also the behaviour of [P/Fe] in halo stars and we suggest that it should show a plateau between [Fe/H] =-1.0 and -3.0 dex corresponding to [P/Fe] +0.5 dex if yields (corrected) from normal SNe II are adopted, and to +0.2dex if hypernova yields (corrected) are adopted. In order to distinguish between these two cases we await for observations of the P abundance in halo stars.
References
- Boissier (99) Boissier, S. & Prantzos, N., 1999, MNRAS, 307, 857
- (2) Caffau, E., Ludwig, H.-G., Steffen, M., Freytag, B. & Bonifacio, P., 2011b, SoPh, 268, 255
- (3) Caffau, E., Bonifacio, P., Faraggiana, R.& Steffen, M. 2011a, A&A, 532, 98
- Chiappini (97) Chiappini, C., Matteucci, F. & Gratton, R., 1997, ApJ, 477, 765
- Chiappini (01) Chiappini, C., Matteucci, F. & Romano, D., 2001, ApJ, 554, 1044
- Francois (04) François, P., Matteucci, F., Cayrel & al., 2004, A&A, 421, 613
- Iwamo (99) Iwamoto, K., Brachwitz, F., Nomoto, K. & al., 1999, ApJS, 125, 439
- Kenn (89) Kennicutt, R.C. Jr, 1989, ApJ, 344, 685
- Koba (06) Kobayashi, C., Umeda, H., Nomoto, K, Tominaga, N. & Ohkubo, T., 2006, ApJ, 653, 1145 (K06)
- (10) Matteucci, F. & Greggio, L., 1986, A&A, 154, 279
- (11) Matteucci, F.& François, P., 1989, MNRAS, 239, 885
- Timmes (95) Timmes, F. X., Woosley, S. E. & Weaver, T. A., 1995, ApJS, 98, 617
- yoshii (96) Yoshii, Y., Tsujimoto, T. & Nomoto, K., 1996, ApJ, 462, 266
- WW (95) Woosley, S.E. & Weaver, T.A., 1995, ApJS, 101, 181 (WW95)