High–latitude supergiants: anomalies in the spectrum of LN Hya in 2010
Abstract
High-resolution echelle spectra taken with the 6-m telescope in 2003–2011 are used to study features of the optical spectrum and the velocity field in the atmosphere of the semiregular variable LN Hya in detail. The weak symmetric photospheric absorptions indicate radial velocity variations from night to night (by as much as 3 km/s), resulting from small pulsations. Peculiarities and profile variations were found for strong lines of Fe I, Fe II, Ba II, Si II, etc. The profiles of these lines were asymmetric: their short-wave wings were extended and their cores were either split or distorted by emission. During the 2010 observing season, the position and depth of the H absorption component, the intensities of the shortand long-wave emission components, and the intensity ratio of the latter components varied from spectrum to spectrum. Weak emissions of neutral atoms (VI, MnI, CoI, NiI, FeI) appeared in the spectrum of June 1, 2010. All these spectral peculiarities, recorded for the first time, suggest that we have detected rapid changes in the physical conditions in the upper atmospheric layers of LN Hya in 2010.
1 Introduction
The semiregular variable LN Hya (HD 112374, IRAS 125382611) is located at a high Galactic latitude (b = 36.o4), indicating that the star belongs to an old Galactic population. Its brightness variation amplitude is B = 0.32m ; the variability period is not firmly established, and possible durations range from 44 to 86 days [1]. Semiregular variables are far evolved post-AGB stars. Stars of intermediate masses (with initial masses of ) are observed in this short-lived stage; they lose matter via their stellar winds as they evolve of the AGB. The secular variability of the principal parameters of post–AGB stars has stimulated spectroscopic monitoring. Such spectroscopic monitoring of selected AGB and post-AGB stars has been performed with the 6-m telescope of the Special Astrophysical Observatory over the past decade. The main aim of our monitoring is to detect peculiarities and possible variations of the spectrum, and to study the time behavior of the velocity field in the stellar atmospheres and shells. Observations on the 6-m telescope have detected variations in the spectra of V510 Pup [2, 3], V2324 Cyg [4], and the optical counterpart of the IR–ray source IRAS 01005 + 7910 [5]. New results concerning variations of the optical spectra and atmospheric velocity fields have also been obtained for the variable stars QY Sge [6], V354 Lac [7, 8], V448 Lac [9], CY CMi [10].
Stellar evolution from the AGB stage to the planetary-nebula stage remains incompletely understood. This concerns the mechanisms and details of the stellar mass loss and the complex morphology of their circumstellar gaseous-dusty shells. The role of pulsations and binarity has also been poorly studied, and the detection of these effects for stars with complex atmospheric velocity fields is laborious and time consuming. These considerations also apply to studies of the variable supergiant LN Hya. An image taken with the Hubble Space Telescope [11] shows LN Hya as a point-like object. The star is surrounded with a gas and dust shell, whose presence in the optical is revealed by the emission profile of the H line. After publication of the IRAS results and optical identification of IRAS objects via catalog cross correlation, LN Hya was identified with the infrared source IRAS 125382611. However, the fluxes in the IRAS bands are low [12] compared to the star’s radiation in the visible. Note that low IR–fluxes have also been observed for several peculiar UU Her-type supergiants at high Galactic latitudes. LN Hya is usually considered to be a member of this rare Galactic population (e.g. [13, 14]). No infrared excess was detected for the high-latitude supergiant UU Her, whose properties will also be discussed below.
The brightest star in its class, LN Hya has been studied spectroscopically many times. Already in the early 1980s, Luck et al. [15] determined the main parameters (effective temperature Teff = 6000 K, surface gravity log g = 0.4 and 0.8) and detailed chemical composition of LN Hya, which displays a metal deficiency, [Fe/H] =, and large nitrogen excess, [N/Fe] = +0.5. Somewhat later, Klochkova and Panchuk [16] used photographic spectra taken with the main stellar spectrograph of the 6-m telescope to study the spectrum of LN Hya among a sample of supergiants at high Galactic latitudes, and confirmed the main conclusion of Luck et al. [15]: LN Hya is a post-AGB star with a deficiency of heavy elements. Ten years later, Giridhar et al. [17] obtained new estimates of the fundamental parameters and chemical composition of LN Hya based on CCD spectra, reaching similar conclusions. The main focus of the recent study [18] was abundances of elements with low condensation temperatures, which are not subject to selective separation processes (C, N, O, S, Zn).
Thus, several papers devoted to the chemical composition of LN Hya have been published over the last 30 years, but very little information is available about the peculiarities of its spectrum or possible time variability. We have obtained new high-quality optical spectra of LN Hya over the last decade. This paper presents our results on variability and previously unknown peculiarities of the star’s spectrum and its detailed radial-velocity pattern.
| Date | JD 2450000+ | ,Å | Vr, km/s | ||
|---|---|---|---|---|---|
| Vr(metals) | Vr(Habs) | Vr(NaIemis) | |||
| 21.02.2003 | 2692.52 | 5150–6660 | 23.200.12 (125) | 25.5 | 21.9 |
| 02.04.2010 | 5289.39 | 5160–6680 | 23.680.08 (304) | 20.5 | 21.1 |
| 05.04.2010 | 5292.33 | 5160–6680 | 21.930.07 (312) | 20.7 | 22.0 |
| 01.06.2010 | 5349.27 | 5220–6690 | 28.220.11 (211) | 7.8 | 21.6 |
| 12.01.2011 | 5574.59 | 5210–6680 | 23.300.06 (235) | 22.3 | 21.8 |
| 14.03.2011 | 5635.42 | 5220–6690 | 24.880.07 (153) | 23.6 | 21.6 |
Vr(metals) is the mean velocity from symmetric absorption features; the number of lines used to derived the mean velocity is given in brackets. Vr(Habs) is the velocity from the H absorption component, and Vr(Naemis) the velocity from the emission components of the D–lines NaI.
2 Obseravtions, reduction, and spectral analysis
We taken spectroscopic data on LN Hya at the Nasmyth focus of the 6-meter telescope using the NES echelle spectrograph [19, 20]. These observations used a 20482048-pixel CCD and an image slicer [20]. The spectroscopic resolution was R60000 and the S/N ratio S/N100. To increase the time interval covered by our observations of LN Hya, we added a spectrum with resolution R = 25000 we had earlier obtained at the Nasmyth focus of the 6-m telescope using the “Lynx” echelle spectrograph [21]. The mean times of our observations (JD) and the recorded spectral ranges are presented in Table 1.
We extracted 1D spectra from the 2D echelle frames using modified version [22] of the ECHELLE context of the MIDAS package. To remove cosmic-ray traces, we performed median averaging of two successive spectra. Our wavelength calibration were done using spectra from a ThAr hollow cathode lamp. We checked the instrumental agreement between the stellar and lamp spectra using telluric [OI], O2, and H2O lines. A more detailed description of the procedure used to measure radial velocities Vr from spectra obtained with the NES spectrograph and various sources of uncertainty can be found in [23]. The rms uncertainty of the Vr measurements for stars with narrow absorption lines is 1.0 km/s (from a single line).
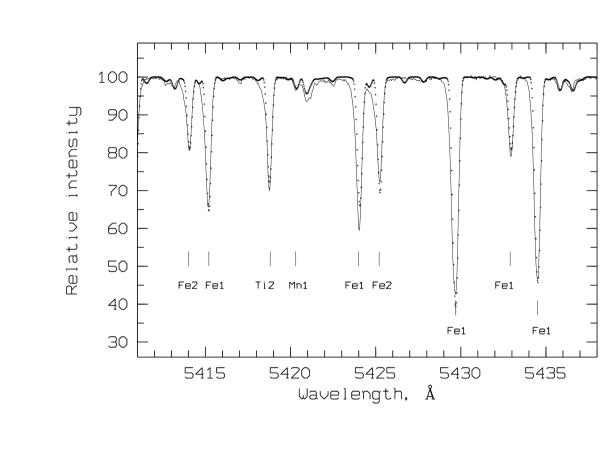
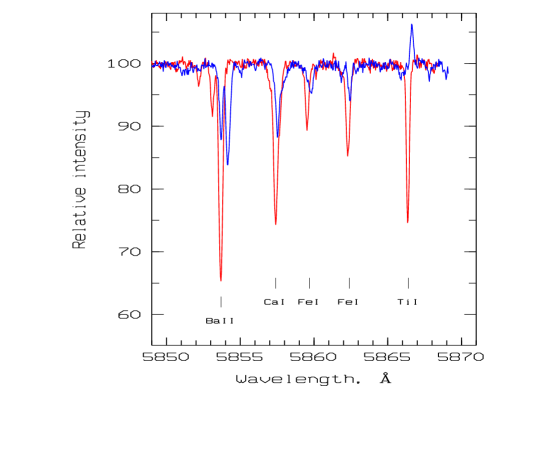
In addition to position measurements, a multifaceted analysis of the observed spectra of LN Hya requires computations of synthetic spectra. We applied the SynthV code developed by Tsymbal [24], adapted by Tsymbal to run on a personal computer in OS Linux environment. Note that the effective temperatures Teff derived for LN Hya in different studies vary over a fairly wide range, 55006300 K. We adopted temperature close to the average of these, Teff = 6000 K, taking into account the good agreement of the observed spectrum and the theoretical spectrum for this temperature. Figure 1 displays a part of the spectrum observed on January 12, 2011 that contains absorption lines almost undistorted by emission, compared to the theoretical spectrum. Although the computations and observations are in general agreement, this figure demonstrates that the short-wavelength absorption wings are extended, even during the quiescent atmospheric state of LN Hya.
3 Main results
3.1 Emission components and line-profile variations
The H profile. LN Hya was classified as an F3 Ia supergiant based on its optical spectrum [25]. The first studies dealing with analyses of the star’s spectrum noted the presence of emission in the H profile (e.g., [15]). Emission components in the H are characteristic of post-AGB stars (for examples, see Fig. 2 in [26]), and indeed represent one of the main selection criteria for such objects [27]. Spectra of UU Her–type stars also display complex H emission and absorption profiles. The H in the spectrum of the prototype, UU Her, contains two emission components of variable intensity [28]. The main characteristics of UU Her and LN Hya are similar in whole. Both stars are semiregular F–supergiants at high Galactic latitudes. The elemental abundances in their atmospheres, studied in [28] for UU Her and in [16, 17] for LN Hya, are also similar: their metallicities are [Fe/H] =1.32 and 1.2, respectively, with large excesses of nitrogen and deficiency of carbon and heavy s-process metals. Significant differences between the two stars include, first, the considerably larger brightness-variation amplitude of UU Her compared to LN Hya (), and second, the IR–excess of LN Hya, which is absent for UU Her. In addition to the IR–excess, the presence of dust in the shell of LN Hya is revealed by the polarization of the star’s light [29].
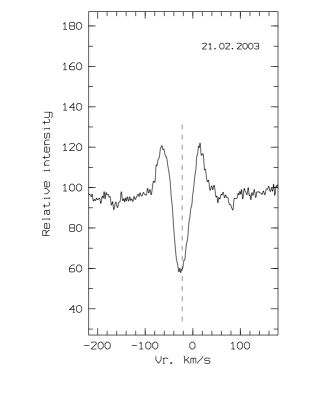
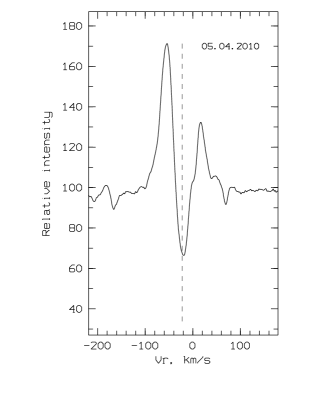
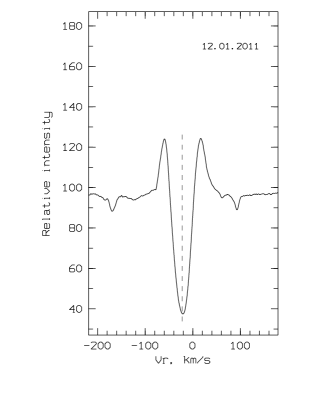
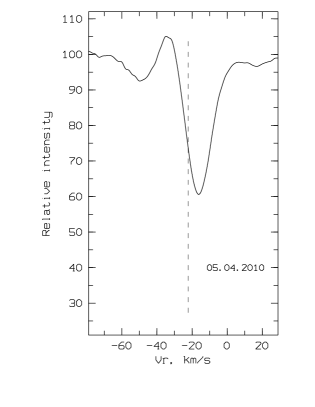
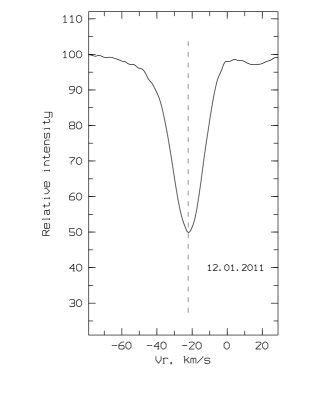
The emission in the H line was long believed to be the only spectral peculiarity of LN Hya. Figure 2 shows that all our spectra of LN Hya demonstrate H with emission components. The H profile with two–peaked emission, typical of post–AGB stars, that was observed in 2003 and 2011 is in agreement with the properties of the profile in the considerably earlier study of Luck et al. [15]. A large number of observations of post–AGB stars near the H line were obtained, analyzed, and classified by Sanchez Contreras et al. [30]. Using their classification, we find that the H profile in the spectrum of LN Hya during its quiescent phases is an emission–filled absorption (EFA) profile. It is usually believed that this type of the profile indicates the presence of a long-lived reservoir of circumstellar gas (rotating disk). The line width is determined primarily by scattering on free electrons and the kinematics of the circumstellar structure. The central H absorption is formed by the peripheral zones of the same structure, which are at rest relative to the system’s center of mass.
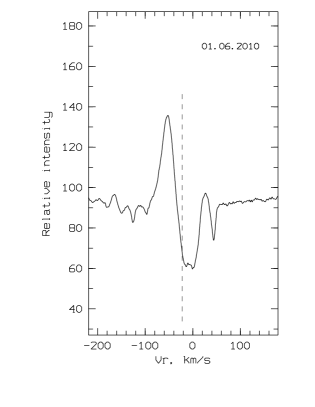
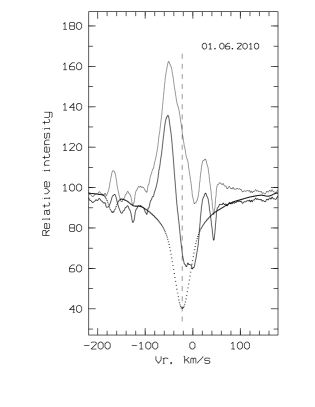
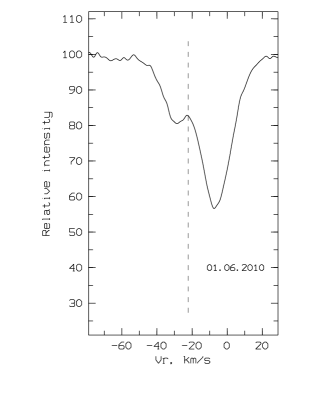
We detected strong variations of the H profile in the spectra of LN Hya obtained in the 2010 observing season. Figure 2 shows changes in the position of the absorption core, the intensities of both emission components, and their intensity ratio. In addition, during observations of the least “excited” spectra (21 February, 2003, 12 January, 2011, and 14 March, 2011), the H possessed extended absorption wings formed in deep layers of the stellar atmosphere, along with emission components of approximately the same intensity. Figure 2 compares the H profile observed on 1 June, 2010 and the theoretical profile calculated using the star’s fundamental parameters. The profile in this spectrum differs considerably from those observed during quiescent phases, and can be considered an inverse P Cygni type profile. In this case, the position of the H absorption component differed considerably from its position at other epochs. In addition, the H core was considerably shifted towards longer wavelengths relative to the symmetric metallic absorption lines (by about 15 km/s).

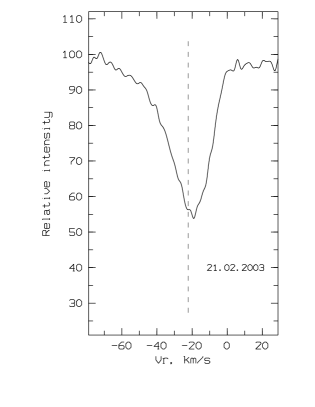
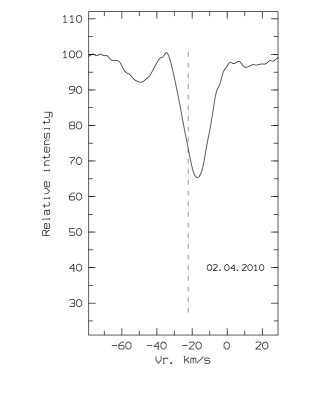
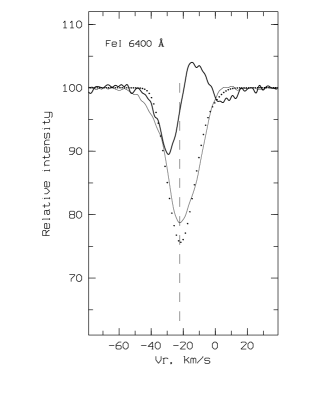
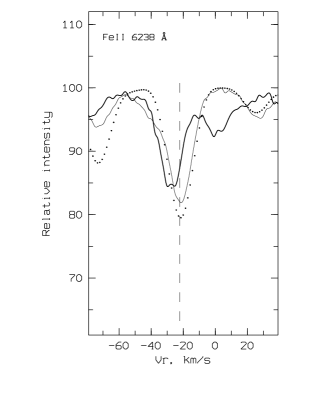
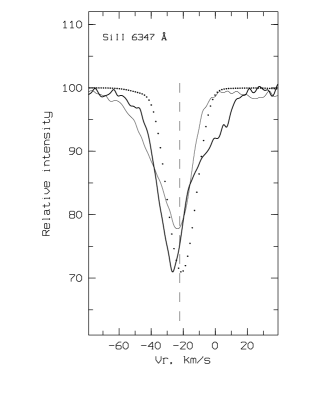
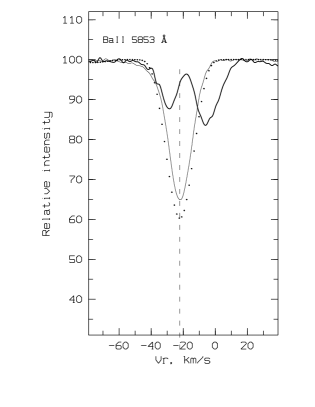
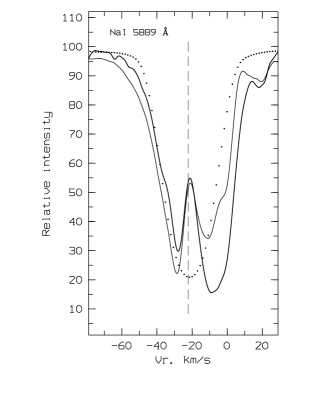
Strong absorption lines. Apart from the changed H profile, analysis of our spectra of LN Hya taken in 20102011 also reveals previously unknown properties of the star’s spectrum. A comparison of the profiles and parameters of the spectral lines of LN Hya for different nights demonstrates that the strongest metallic absorption lines, formed in high layers of the stellar atmosphere, have complex timevariable profiles. In the spectra obtained during 2 April 1 June, 2010, all strong absorption lines in the yellow (FeII, TiII, SiII, and especially BaII) have abnormal profiles. Figure 3 presents profiles of the BaII 6141 Å lines for different observing epochs. The core of this line in the spectrum for 21 February, 2003 was almost symmetric, but changes were observed beginning from 2 April, 2010, which are most clearly expressed in the spectrum for 1 June, 2010. The short-wavelength wings of the strong absorption lines are lifted to some extent by emission lines, and the absorption cores are sharpened or split due to the presence of emission. As an example, Fig. 4 presents profiles of the Si II, Fe I, Fe II, Ba II, and D2 NaI (1) lines in the quiescent (12 January, 2011) and most active (1 June, 2010) states. For comparison, this figure also shows theoretical profiles for the parameters Teff = 6000 K, log g = 1.0, and km/s, which we adopted in accordance with [16, 17].
There is obviouisly a contribution from upper atmospheric levels, which provides the specific profile shapes. Several lines with distorted profiles are listed in Table 2. In the last three columns of the table, “+” denotes the presence of distortion for a given line, “–” an absence of distortion and “+:” line profiles without obvious emission but with extended short–wave wings.


| Presence of asymmetry | |||||
|---|---|---|---|---|---|
| Line | , eV | 05.04.2010 | 01.06.2010 | 12.01.2011 | |
| 5167.33 | MgI | 2.71 | +: | ||
| 5169.03 | FeII | 2.89 | + | ||
| 5172.70 | MgI | 2.71 | + | ||
| 5183.62 | MgI | 2.71 | + | ||
| 5200.41 | YII | 0.99 | + | ||
| 5232.94 | FeI | 2.94 | + | + | +: |
| 5234.62 | FeII | 3.22 | + | +: | |
| 5237.33 | CrII | 4.07 | + | +: | |
| 5256.94 | FeII | 2.89 | + | + | |
| 5316.62 | FeII | 3.15 | + | + | +: |
| 5336.77 | TiII | 1.58 | + | + | +: |
| 5371.49 | FeI | 0.96 | + | + | +: |
| 5381.01 | TiII | 1.57 | + | + | +: |
| 5393.17 | FeI | 3.24 | +: | + | |
| 5397.13 | FeI | 0.92 | + | + | |
| 5405.77 | FeI | 0.99 | + | + | |
| 5414.07 | FeII | 3.22 | + | ||
| 5429.70 | FeI | 0.96 | + | + | +: |
| 5446.92 | FeI | 0.99 | + | + | +: |
| 5455.61 | FeI | 1.01 | + | + | +: |
| 5526.79 | ScII | 1.77 | + | + | +: |
| 5853.67 | BaII | 0.60 | + | + | |
| 6141.71 | BaII | 0.70 | + | + | +: |
| 6245.62 | ScII | 1.51 | + | + | |
| 6247.55 | FeII | 3.89 | + | ||
| 6347.09 | SiII | 8.12 | +: | + | +: |
| 6371.36 | SiII | 8.12 | + | + | +: |
| 6393.60 | FeI | 2.43 | + | +: | |
| 6400.00 | FeI | 3.60 | +: | + | +: |
| 6456.38 | FeII | 3.90 | +: | + | +: |
| 6496.90 | BaII | 0.60 | + | + | +: |
Abnormal P Cygni profiles in the spectrum of LN Hya are also exhibited by lines of neutral iron. This efect is clearly expressed, for instance, in the Fe I 6400 Å line (top left panel of Fig. 4); the excitation potential of the lower level of this line ( eV) is considerably higher than for the Ba II lines ( eV). The Fe I 6400 Å line is not the only one in the spectrum that displays this property. Similar profiles are also found for several other low–excitation lines of neutral iron and calcium: Fe I 6065.48 Å, Ca I 6162.18 Å, Fe I 6191.56 Å, Ca I 6449.81 Å. The lower levels of these lines have excitation potentials eV. Profiles of high-excitation lines, such as Si II 6347 or 6371 Å ( eV), are less distorted. As an example, Fig. 4 shows the Si II 6347 Å line profiles for two observing epochs.
Emission Lines of Neutral Atoms. The spectrum taken on 1 June, 2010 displays another previously unknown property of LN Hya: weak emission lines of neutral atoms (V I, Mn I, Co I, Ni I, Fe I) with intensities of several percent of the continuum. Table LABEL:list_emis presents a list of these features, along with the excitation potentials of their lower levels and radial velocities corresponding to the positions of emission lines in three spectra. These emission features were not present in spectra taken prior to June 2010. Instead, earlier spectra displayed fairly strong absorption lines for the same atomic transitions. As an example, Fig. 5 shows a fragment with one such emission line, Ti I 5866.40 Å. The spectrum of LN Hya taken on 1 June, 2010, during an “excited” state of the atmosphere, contains Ti I 5866.40 Å emission with an intensity of about 6%, while the quiescent atmosphere (2 April, 2010) exhibits absorption whose position corresponds to the radial velocity derived from other undistorted absorption lines in the same spectrum. The intensities of the emission lines decrease in the 2011 spectra, and some disappear, as is demonstrated by Table LABEL:list_emis.
The profiles of the D–lines Na I resonance doublet also display a specific split shape in all our observations. A contribution from interstellar Na I features is ruled out because of the star’s high Galactic latitude. In our opinion, the observed splitting of the Na I lines is most likely due to the presence of emission formed in the circumstellar medium, which splits each photospheric D–line into two components (Fig. 4).
Thus, in the course of about 60 days between April and June 2010, we detected the appearance and rapid increase of instability in the atmosphere of LN Hya. The star’s atmosphere had returned to its normal state by the time of our most recent spectra (12 January, 2011 and 14 March, 2011), when the stellar spectrum, including the H profile, was virtually undistinguishable from our first spectrum of 21 February, 2003.
3.2 Radial velocity
As was already noted, there were no earlier detailed radial-velocity studies for LN Hya. The SIMBAD database presents only the mean (from three heterogeneous measurements) heliocentric velocity of the star, Vr =22 km/s. Thus, one of our tasks was to measure the pattern shown by the radial velocities in detail, based on various spectral features, and to study the time behavior of the velocity field. We measured the heliocentric radial velocities Vr by moving the direct and mirror images of the line profile until they coincided. This method can be used to obtain Vr measurements for individual features in the profile. We compiled a list of lines for Vr measurements using the spectral atlas [31], prepared using similar (6-m telescope + NES) spectra of the post–AGB star CY CMi (HD 56126), whose atmospheric parameters and metallicity [10] are close to those of LN Hya. The results of our Vr measurements for the six available spectra are collected in Table 1, whose columns present: (1) the observation date, (2) the corresponding Julian date JD, (3) the recorded spectral range, (4) the heliocentric radial velocity Vr(metals) averaged over a large set of symmetric metallic absorptions, with the number of lines at the measured positions indicated in brackets, and (5) the velocities obtained from the H absorption component and the emission component of the D-lines of the Na I doublet.
Unfortunately, the systemic velocity of LN Hya was not determined. Attempts were made to search for spectral features that could have been formed in the stellar shell (emission bands of OH, H2O masers, etc.), but without success. In particular, Venn et al. [32] observed a sample of AGB and post–AGB stars in the submillimeter, but did not detect any flux in the 12CO lines for LN Hya, which is not a surprise for an O–rich star. We adopted the velocity we measured for weak symmetric emission lines of neutral atoms (V I, Mn I, Co I, Ni I, Fe I) as the systemic velocity. Table LABEL:list_emis shows that the mean radial velocity for these features, Vsys = km/s, is stationary in time. We derived the same velocity (Vr = km/s) from the emission component of the Na I D–lines (see the last column of Table 1), and this value likewise does not change with time. These two findings suggest that the Na I D emission is formed in the circumstellar structure.
The line-profile anomalies in the spectrum of LN Hya influence the radial velocities measured from these lines. The derived velocities depend on the type of line and the particular features used for the measurements, as well as the applied technique. Most metallic lines in the spectra of LN Hya are asymmetric: the blue wing is either extended (see the spectrum for 21 February, 2003, where the velocity measured from the upper part of the profile is lower than the velocity measured from the core) or distorted by emission (the spectra of April and June 2010, where the velocity measured from the upper part of the profile is higher than the velocity measured from the core). To reveal possible time variations of Vr, we selected only symmetric absorption lines of metals without visible distortions in each spectrum.
Our analysis of the Vr sets obtained from symmetric absorption lines led to the conclusion that there was no relation between the intensity and the corresponding radial velocity. This means we can use the average radial velocity for each spectrum in our further analysis. The calculated mean velocity Vr(metals) is presented in the fourth column of Table 1. The velocity Vr(metals), reliably determined from numerous symmetric absorption lines, changes from epoch to epochr with a small amplitude of 23 km/s. These low-amplitude Vr variations are clearly due to pulsations of the stellar atmosphere. This conclusion agrees with the brightness variability of LN Hya (B = 0.32m) [1]. Vr variations with a similar amplitude were recently detected by Takeda et al. [18], who measured heliocentric radial velocities Vr from to km/s in four high-resolution spectra (R = 70000) taken within a week.
The profile variations of strong absorption lines in the spectra of LN Hya are due to variations in the shifts of absorption lines and the presence of an emission component whose position does not change. The combination of these two factors splits the absorption into components whose positions and intensities vary. The radial velocity derived from the H absorption component varies only slightly. Apart from the epoch of strongest atmospheric excitation (1 June, 2010), the mean velocity for four phases is Vr = km/s, close to the mean velocity indicted by symmetric absorption lines of metals.
| Vr(emis), km/s | ||||
| Line | , eV | 01.06.2010 | 12.01.2011 | 14.03.2011 |
| 5394.68 MnI | 0.00 | |||
| 5490.15 TiI | 1.46 | |||
| 5644.14 TiI | 2.27 | |||
| 5727.05 VI | 1.08 | |||
| 5866.40 TiI | 1.07 | |||
| 5918.55 TiI | 1.06 | |||
| 5953.16 TiI | 1.89 | |||
| 5956.70 FeI | 0.86 | |||
| 6091.18 TiI | 2.27 | |||
| 6108.12 NiI | 1.67 | |||
| 6126.22 TiI | 1.07 | |||
| 6261.10 TiI | 1.43 | |||
| 6450.24 CoI | 1.71 | |||
| Vr(aver), km/s | ||||
4 Discussion
4.1 Pulsations and atmospheric kinematics of LN Hya
The peculiarities of the H profiles and the strong absorption lines in the spectrum of LN Hya (the presence of emission that splits absorption lines into components) are consistent with the existence of pulsations and the passage of a shock in the atmosphere. In his well-known paper, Schwarzschild [33] concluded that split absorption profiles and H emission were signs of a shock passing through the stellar atmosphere. This explanation seems fairly natural for a star with Teff = 6000 K and log g = 1.0. Unfortunately, we could not find any photometric data that could contribute to a better understanding of the observed spectral peculiarities for our observing epochs.
We observe signs of motions in deep atmospheric layers in both the quiescent and active states, such as the differing radial velocities Vr(metals) measured from numerous symmetric absorption lines of metals in Table 2, and the presence of extended short-wave wings of strong absorptions, which provide evidence for high-velocity outward motions. Variable emission in both H and strongest lines of metals is observed in the active state (the spectra for 2010). If we restrict our consideration to the H profile, the observed pattern suggests a shock moving in the atmosphere of a pulsating star. Subtracting the mean profile for the quiescent spectra from the H profile observed in the active state yields an inverse P Cygni profile (see also the bottom right panel of Fig. 2). If we exclude the contribution from the stable circumstellar structure, we observe matter falling onto the star in the active state (in the H). However, considering other spectral features, we find that the emission components of the metal lines are formed in various outward–moving layers (such as Ba II 6141 Å), as well as back, towards the photosphere (Fe I 6400 Å, Fe II 6238 Å, Ba II 5853 Å). Thus, it seems difficult to relate the formation of these emission lines to a single de-excitation region behind the front of a single shock.
Aikawa [34, 35] demonstrated that, in the case of low-mass UU Her supergiants, low-amplitude pulsations could appear when the luminosity was sufficiently high, and the pulsations of higher-luminosity objects could become irregular and even chaotic. Pulsations with an amplitude of about 15 km/s were detected in the atmosphere of the closest relative of LN Hya the high-latitude supergiant UU Her, whose pulsation periods, P = 73d in the fundamental mode and P = 45d in the first overtone, are known from photometric data [36]. Based on multi-epoch spectroscopy of UU Her, Klochkova et al. [28] noted asymmetry of the strongest ion lines (Ba II, Si II), as well as a strong shift of the H absorption core relative to other absorption lines in each of the spectra. In the present study, we have detected similar spectral properties for LN Hya, but the pulsation amplitude is much lower than for UU Her.
In the active state, we observe another interesting property of LN Hya: the absorption components of strong lines are shifted towards longer wavelengths (Table 1). These shifts cannot be due to the “cutting” of the absorption–profile core by a short-wave emission component, since the absorption wings are also shifted (see, for example, the Ba II 6141 Å profile in the 1 June, 2010 spectrum in Fig. 3). This supports the hypothesis that matter is falling onto the star.
Thus, the active state of the atmosphere of LN Hya observed in 2010 was primarily determined by the motion of matter towards the star (the inverse P Cygni profile of the H lines and redshifted cores of strong lines). This motion coexists with outward motions (the extended short-wave wings of metal lines). Simultaneously, we observe two regions of de-excitation in the metal lines, with opposite motions relative to the stellar center. The active atmospheric state is accompanied by the excitation of neutral-atom emission lines at the periphery of the circumstellar shell. In order for these phenomena to be consistent, we must reject the hypothesis of spherical symmetry of the structure of the atmosphere and circumstellar shell.
Photometric manifestations of semiregular variability depend appreciably on the fraction of the absorption spectrum formed in the shell. For example, the extended atmospheres of RV Tauri stars contain enough matter for division into two or three absorption systems to become visible with sufficiently good spectral resolution. Ways to reconcile the two-peaked light curve of AC Her with the single-peaked curve of the equivalent-width variations for strong lines of metals, mainly formed in the shell, are discussed in [37].
The abrupt change in the parameters of spectral features we have detected suggests that the critical state of the atmosphere of LN Hya during the first half of 2010 could be due to a change in the pulsation period. This behavior is characteristic of supergiants at high Galactic latitudes [38]. Confirmation of this hypothesis would obviously require long-term spectroscopic monitoring of the star with good time coverage.
4.2 Pulsations of related objects
Pulsation instability is characteristic of many post-AGB objects, in agreement with theoretical computations of the pulsations of stars evolving from the AGB to planetary-nebula phase [34, 35, 39]. The physical mechanism exciting pulsations of post–AGB stars, which consist of a degenerate CO core (with a typical core mass of 0.6) surrounded by an extended, low-mass atmosphere, remains unknown. Unstable, low-mass (), high-luminosity () post–AGB stars that pulsate with low amplitudes in high modes populate an instability strip in the Hertzsprung–Russell diagram at temperatures of 5010 K Teff 7940 K, shifted relative to the classical instability strip towards hotter stars [40]. Such low-amplitude pulsations have been successfully modeled. Fokin et al. [41] calculated grids of models reproducing irregular brightness and Vr variations and the corresponding power spectrum for post–AGB stars over wide intervals of mass, effective temperature, and luminosity.
Multi-component structures of metal lines due to passing shocks are observed in the spectra of various types of variable stars, including classical Cepheids (e.g., [42]) and RV Tauri pulsating stars [43]. No H emission is detected in the spectra of classical Cepheids [44]. A combination of two phenomena – split absorption lines and H emission – is observed in the spectra of Population II pulsating stars (see [44] and references therein). A good example is the halo pulsating star W Vir. Recently, Kovtyukh et al. [45] used spectroscopic monitoring of this Pop II Cepheid to study the time behavior of the H I and He I emission profiles, split metal lines (Fe I, Fe II, Ba II, Na I, etc.), and the velocity field. They suggested a schematic model of the system (star + shell) that can explain time variations of the velocity field in the stellar atmosphere with the passage of two shocks [45]. It is more difficult to study pulsations in post–AGB objects with strong circumstellar shells. Due to the action of complex dynamical processes and the lack of the required quantity and quality of observations, atmospheric pulsations of stars evolving beyond the AGB stage remain poorly studied.
Sufficiently high-quality spectroscopic monitoring (high spectral resolution and low noise) over a wide wavelength range has been performed for only one of the brightest post–AGB stars, CY CMi. This is a rare star at this evolutionary stage, with products of the third dredge–up detected in its atmosphere [10]. Lebre et al. [46] used Fourier analysis to study H variations and the corresponding set of radial velocities, concluding that the dynamics of the CY CMi atmosphere are complex due to pulsations. Barthes et al. [47] obtained a large series of good–quality spectroscopic observations of CY CMi over almost eight years. To study the Vr variations and search for a pulsation period, they measured the positions of two symmetric lines, Ba II 5853 and C I 6587 Å. They found a first-overtone pulsation period, P = 36.8d, with an amplitude of Vr = 2.7 km/s based on 89 spectroscopic epochs. A conclusion of [47] was that the observed variations of the neutral-hydrogen lines (H and H) could not be due to pulsations.
Studies of velocity fields for post-AGB stars are often complicated by the presence of combined variations of Vr due to pulsations and differential motions in the extended atmospheres of semiregular variable stars. Klochkova and Chentsov [48] used (6m telescope + NES) spectra of CY CMi to study the radial velocities in its atmosphere and shell. Their high quality observations over a wide wavelength range enabled them to study a large set of lines with various intensities, and to detect considerable differential line shifts within a single spectrogram, as well as changes of these shifts with time. They concluded that both expanding and infalling layers were simultaneously present in the atmosphere of CY CMi [48].
Equally complex kinematic patterns are observed for two variable stars with similar properties, V354 Lac and V448 Lac. The cool variable V354 Lac, identified with the infrared source IRAS 22272+5435, is one of the most interesting post–AGB stars. It was one of the first post-AGB stars with a 21 spectral feature, and 6-m telescope spectra revealed large excesses of carbon and -process elements in the atmosphere [49]. Later, optical spectra of V354 Lac obtained with high spectral resolution using the 6m telescope + NES instrument in 20012008 showed that the strongest absorption lines with lower-level excitation potentials below 1 eV were split [7, 8]. Analysis of the kinematic pattern demonstrated that the shortwavelength component of the split line was formed in the star’ss strong gas and dust shell. Profile variations of strong absorption lines were detected.
Multiple high-spectral-resolution observations in 19982008 were used to study time variations of spectral profiles and the velocity field in the atmosphere and circumstellar shell of the semiregular variable V448 Lac [9]. Like those of LN Hya and V354 Lac, spectra of V448 Lac reveal asymmetry and profile variability of the strongest absorption lines with lower-level excitation potentials eV, first and foremost, for the profiles of the strongest lines of the Ba II, Y II, La II, Si II ions. The peculiarity of these profiles can be explained by a superposition of stellar absorption lines and shell emission lines. Emission of the Swan (0;1) 5635 Å band of the C2 molecule was detected for the first time in the spectrum of V448 Lac. Vr variations with an amplitude of about 8 km/s were found for the H core. Lower-amplitude (about 12 km/s) Vr variations for weak metallic absorption lines may reflect pulsations in the atmosphere. Differential shifts of the lines from 0 to 8 km/s were measured at different epochs. The molecular spectrum is stationary in time, indicating a constant expansion rate of the circumstellar shell, as measured from C2 and NaI lines: Vexp = 15.2 km/s.
Finally, further studies of post–AGB stars, including spectroscopic monitoring and spectropolarimetry, are needed to improve our understanding of the detected variations of Vr and the spectralline profiles of these stars and develop models for such systems. High-spectral resolution spectropolarimetry will provide key information about the structure of the circumstellar environment. Long-term spectroscopic monitoring can reveal secular variations of atmospheric parameters and distinguish genuine post-AGB stars from objects mimicking this stage [50]. Another advantage of many-year monitoring is the possibility of detecting smallamplitude radial-velocity variations that may indicate spectroscopic binarity.
5 Conclusions
Our echelle spectra of the low-mass, high-latitude supergiant LN Hya acquired with the 6-m telescope over several years over a wide spectral range and with high spectroscopic resolution have revealed new spectroscopic phenomena for this star, and enabled us to measure radial velocities for spectral features formed at various depths in the stellar atmosphere.
Variations in the radial velocities measured from weak photospheric absorption lines indicate the presence of low-amplitude pulsations in deep (nearly photospheric) layers of the atmosphere.
We have found complex, time-variable profile shapes for strong absorption lines (Fe I, Fe II, Si II, Ba II, etc.) formed in upper layers of the star’s extended atmosphere. We have detected variations of the asymmetries of these absorption lines from spectrum to spectrum, including variations in their splitting.
A previously unknown property of LN Hya appeared in the spectrum of 1 June, 2010: weak symmetric emissions identified with lines of neutral atoms (V I, Mn I, Co I, Ni I, Fe I). The time–stationary mean Vr from these emission lines, formed in the circumstellar medium (Vsys = km/s), can be adopted as the systemic velocity.
During the 2010 observing season, the position and depth of the H absorption component, intensities of the short-wave and long-wave emission lines, and the intensity ratio of these lines varied from spectrum to spectrum. These properties of the stellar spectrum, detected for the first time in these observations, suggest that we detected a rapid change of the physical conditions in the upper atmospheric layers of LN Hya in 2010, possibly due to the passage of a shock.
Acknowledgments
The authors are grateful to M.V. Yushkin for his assistance during the observations. This study was supported by the Russian Foundation for Basic Research (projects 08–02–00072 a and 11–02–00319 a) and the Basic Research Program of the Presidium of Russian Academy of Sciences “The Origin, Structure, and Evolution of Objects in the Universe”.
References
- [1] 1. A. Arellano Ferro, PASP 93 351 (1981).
- [2] 2. V. G. Klochkova, E. L. Chentsov, N. S. Tavolzhanskaya, and V. E. Panchuk, Astron. Rep. 51, 642 (2007).
- [3] 3. V. G. Klochkova and E. L. Chentsov, Astron. Rep. 48, 301 (2004).
- [4] 4. V. G. Klochkova, E. L. Chentsov, and V. E. Panchuk, Astrophys. Bull. 63, 112 (2008).
- [5] 5. V. G. Klochkova, M. V. Yushkin, A. S. Miroshnichenko, et al., A&A 382 143 (2002).
- [6] 6. V. G. Klochkova, V. E. Panchuk, E. L. Chentsov, and M. V. Yushkin, Astrophys. Bull. 62 217 (2007).
- [7] 7. V. G. Klochkova, E. L. Chentsov, and N. S. Tavolganskaya, Astrophys. Bull. 64 155 (2009).
- [8] 8. V. G. Klochkova, Astron. Lett. 85 457 (2009).
- [9] 9. V. G. Klochkova, V. E. Panchuk, and N. S. Tavolzhanskaya, Astron. Rep. 54 234 (2010).
- [10] 10. V. G. Klochkova, MNRAS 272 710 (1995).
- [11] 11. N. Siodmiak, M. Meixner, T. Ueta, et al., ApJ 677 382 (2008).
- [12] 12. W. E. C. J. Veen, L. B. F. M. Waters, N. R. Trams, and H. E. Matthews, A&A 285 551 (1994).
- [13] 13. D. D. Sasselov, Astrophys. Space Sci. 102 161 (1984).
- [14] 14. J. D. Fernie and D. Sasselov, PASP 101 513 (1989).
- [15] 15. R. E. Luck, D. L. Lambert, and H. E. Bond, PASP 95 413 (1983).
- [16] 16. V. G. Klochkova and V. E. Panchuk, Sov. Astron. Lett. 14 395 (1988).
- [17] 17. S. Giridhar, A. Ferro, and L. Parrao, PASP 109 1077 (1997).
- [18] 18. Y. Takeda, H. Taguchi, K. Yushioka, et al., Publ. Astron. Soc. Japn. 59 1127 (2007).
- [19] 19. V. Panchuk, M. Yushkin, and I. Najdenov, in Proceedings of the Joint Discussion No. 4 during the IAU General Assembly of 2006 on The UV Universe: Stars from Birth to Death, Ed. by A. I. Gomez de Castro and M. A. Barstow (Editorial Complutense, Madrid, 2007), p. 179.
- [20] 20. V. E. Panchuk, V. G. Klochkova, M. V. Yushkin, and I. D. Naidenov, J. Opt. Technol. 76 87 (2009).
- [21] 21. V. E. Panchuk, V. G. Klochkova, I. D. Naidenov, et al., Preprint Spets. Astrofiz. Observ. No. 139 (1999).
- [22] 22. M. V. Yushkin and V. G. Klochkova, Preprint Spets. Astrofiz. Observ. No. 206 (2005).
- [23] 23. V. G. Klochkova, V. E. Panchuk, M. V. Yushkin, and D. S. Nasonov, Astrophys. Bull. 63 320 (2008).
- [24] 24. V. Tsymbal, in Model Atmospheres and Spectral Synthesis, Ed. by S. J. Adelman, F. Kupka, and W. W. Weiss, ASP Conf. Ser. 108 198 (1996).
- [25] 25. N. Houk and M. Smith-Moore, Michigan Spectral Survey, 4 (Dep. Astron. Univ. Michigan, Ann Arbor, 1988).
- [26] 26. V. G. Klochkova, Bull. Spec. Astrophys. Observ. 44 5 (1997).
- [27] 27. S. Kwok, Ann. Rev. A&A 31 63 (1993).
- [28] 28. V. G. Klochkova, V. E. Panchuk, and E. L. Chentsov, A&A 323 789 (1997).
- [29] 29. S. R. Trammell, H. L. Dinerstein, and R. W. Goodrich, Astron. J. 108 984 (1994).
- [30] 30. C. Sanchez Contreras, R. Sahai, A. Gil de Paz, and R. Goodrich, ApJ Suppl. 179 166 (2008).
- [31] 31. V. G. Klochkova, E. L. Chentsov, N. S. Tavolganskaya, and M. V. Shapovalov, Astrophys. Bull. 62, 105 (2007).
- [32] 32. W. E. C. J. Venn, N. R. Trams, and L. B. F. M. Waters, A&A 269 231 (1993).
- [33] 33. M. Schwarzschild, IAU Trans. 8 811 (1953).
- [34] 34. T. Aikawa and S. R. Sreenivasan, PASP 107 238 (1995).
- [35] 35. T. Aikawa, A&A 484 419 (2008).
- [36] 36. E. Zsoldos and D. D. Sasselov, A&A 256 107 (1992).
- [37] 37. V. G. Klochkova and V. E. Panchuk, Astron. Lett. 24 650 (1998).
- [38] 38. D. D. Sasselov, Inform. Bull. Variable Stars No. 2387 1 (1983).
- [39] 39. A. Gautschy, MNRAS 265 340 (1993).
- [40] 40. T. Aikawa, A&A 514 A45 (2010).
- [41] 41. A. B. Fokin, A. Lebre, H. Le Coroller, and D. Gillet, A&A 378 546 (2001).
- [42] 42. P. Mathias, D. Gillet, A. B. Fokin, et al., A&A 457 575 (2006).
- [43] 43. A. Lebre and D. Gillet, A&A 246 490 (1991).
- [44] 44. G. Wallerstein, PASP 114 689 (2002).
- [45] 45. V. V. Kovtyukh, G. Wallerstein, S. M. Andrievski, et al., A&A 526 A116 (2011).
- [46] 46. A. Lebre, N. Mauron, D. Gillet, and D. Barthes, A&A 310 923 (1996).
- [47] 47. D. Barthes, A. Lebre, D. Gillet, and N. Mauron, A&A 359 168 (2000).
- [48] 48. V. G. Klochkova and E. L. Chentsov, Astron. Rep. 51 994 (2007).
- [49] 49. L. Zacs, V. G. Klochkova, and V. E. Panchuk, MNRAS 275 764 (1995).
- [50] 50. V. G. Klochkova, E. L. Chentsov, and V. E. Panchuk, MNRAS 292 19 (1997).