M94 As A Unique Testbed for Black Hole Mass Estimates and AGN Activity At Low Luminosities11affiliation: Based on observations made with the NASA/ESA Hubble Space Telescope, obtained from the data archive at the Space Telescope Science Institute. STScI is operated by the Association of Universities for Research in Astronomy, Inc., under NASA contract NAS 5-26555. 22affiliation: Some observations reported here were obtained at the MMT Observatory, a joint facility of the Smithsonian Institution and the University of Arizona.
Abstract
We discuss the peculiar nature of the nucleus of M94 (NGC 4736) in the context of new measurements of the broad H emission from -STIS observations. We show that this component is unambiguously associated with the high-resolution X-ray, radio, and variable UV sources detected at the optical nucleus of this galaxy. These multi-wavelength observations suggest that NGC 4736 is one of the least luminous broad-line (type 1) LINERs, with erg s. This LINER galaxy has also possibly the least luminous broad line region known ( erg s-1). We compare black hole mass estimates of this system to the recently measured dynamical black hole mass measurement. The fundamental plane and relationship roughly agree with the measured black hole mass, while other accretion based estimates (the relation, empirical correlation of BH mass with high-ionization mid IR emission lines, and the X-ray excess variance) provide much lower estimates (). An energy budget test shows that the AGN in this system may be deficient in ionizing radiation relative to the observed emission-line activity. This deficiency may result from source variability or the superposition of multiple sources including supernovae.
Subject headings:
galaxies: active – galaxies: nuclei – galaxies: emission lines – galaxies: individual (NGC 4736)1. Introduction: LINERs and M94
Most high mass galaxies are known to host massive black holes (BH), some passively lurking in their centers while others are actively accreting surrounding material (e.g., Gültekin et al. 2009a and references therein). The mechanism that causes a BH’s activity to turn on and off is still largely unknown. Understanding the structure of the active galactic nuclei (AGN) at their lowest luminosities is crucial to determining the physical and possibly evolutionary links between the most luminous galaxy centers and the passive ones. However, at low luminosities it is difficult to disentangle the various emission mechanisms that could be concurrently present in galaxy centers. As a consequence, the dominant power source of a large majority of actively line-emitting galaxies remains ambiguous (e.g., Ho 2008 for a review).
Diagnostic diagrams (e.g., Baldwin, Phillips, & Terlevich, 1981; Veilleux & Osterbrock, 1987; Kauffmann et al., 2003; Kewley et al., 2006) are relatively successful in separating out bona-fide accretion sources (Seyferts) from nuclei whose emission-line activity is mainly powered by young, hot stars (H ii galaxies), based on emission line ratios. At least 50% of the strong line emitters fall easily onto the H ii locus, however, only less than 10% are of the Seyfert type (Ho, Filippenko & Sargent, 1997c; Kauffmann et al., 2003; Constantin & Vogeley, 2006). A large fraction of the objects “in between” these two categories, that exhibit relatively low levels of ionization (i.e., low values of [O III]/H), maintain reasonably strong forbidden line activity (i.e., high values of [N II]/H), and are classified as low ionization nuclear emission regions (LINERs). The reminder are usually called Transition objects (Ts). Whether Ts and Ls are powered, at least partly, by accreting BHs, and thus could be called AGN, is a matter of continuous debate (Ho, 2008).
There are some typical emission characteristics that are considered to be particularly good indications that accretion onto a massive BH is an important, if not the dominant source of ionization in some Ls, and possibly Ts. The detection of broad H emission, regardless of its strength or luminosity, is generally considered to be clue to AGN emission. Some LINERs (and maybe Ts as well) exhibit these features, however, the majority of these systems show only narrow emission, which could be generated by shocks, post-starbursts, or other processes unrelated with accretion. Observations outside of the optical wavelengths often reveal AGN signatures in ambiguous and even starburst galaxy nuclei. X-rays are particularly good tracers of accretion, however, they are not efficient in distinguishing AGN at erg s-1, where contamination by X-ray binaries can be significant. X-rays are also unlikely to detect heavily absorbed AGN (i.e., Compton-thick; cm-2). On the other hand, mid-IR high ionization emission lines like [Ne V] 14.32 m, 24.32m (97.1 eV) appear to be a trustworthy indicator of AGN activity (Weedman et al., 2005; Armus et al., 2006; Abel & Satyapal, 2008) due to the extreme conditions (i.e., very hard ionizing radiation) required to produce them; because these features have considerably lower optical depth, their detection can also reveal Compton thick AGN (Sturm et al., 2002, e.g., NGC 1068). This technique has now been applied to reveal new and large numbers of optically unidentified AGN (Satyapal et al., 2008; Goulding & Alexander, 2009), providing thus sensitive improvements on previous AGN censuses. These studies, along with X-ray and radio studies of nearby galaxies (e.g. Nagar, Falcke, & Wilson, 2005; Zhang et al., 2009; Desroches, Greene & Ho, 2009) suggest that a majority of LINERs and a large fraction of transition galaxies might in fact host accreting black holes. The presence of an accreting black hole does not however guarantee that the accretion power is the dominant source of ionization of those galaxy nuclei. A more recent assessment of the energy budget of LINERs by Eracleous, Hwang, & Flohic (2010b) argues that in 85% of LINERs the AGN ionizing photons are not sufficient for producing the observed nebular emission, and thus other power sources are likely to dominate.
Some new potentially powerful insights into the excitation mechanism of the low luminosity AGN (LLAGN), and in particular the ambiguous sources, come from recent studies of large statistical samples of nearby galaxy nuclei, which reveal a potential H ii S T LINER Passive Galaxies evolutionary sequence in the process of BH growth within galaxies (Constantin, Hoyle, & Vogeley, 2008; Constantin et al., 2009). This sequence traces trends in (1) increasing host halo mass, (2) increasing environmental density, (3) increasing central BH mass and host stellar mass, (4) decreasing BH accretion rate, (5) aging of the stellar population associated with their nuclei, and (6) decreasing in the amount of dust obscuration, which might translate into a decrease in the amount of material available for star-forming or accretion. In this picture, Seyferts and Ts are transition phases between the initial onset of accretion, usually swamped by the star-forming gas and associated dust, which is seen optically as an H ii system, and the final phase of accretion observed as LINERs of already massive BHs. While this idea is supported by various other independent observational studies of low luminosity AGN and starburst galaxies (Schawinski et al., 2007, 2010), along with state of the art hydrodynamical models for the life-cycles of the most luminous AGN (e.g., Di Matteo et al. 2005, Hopkins et al. 2006), it is very probable that not sources fit into this scenario. It is also important that this evolutionary sequence idea is tested on samples that span a narrow distribution in Hubble types; because most of the H iis and Ts are relatively late-type disk galaxies that, likely, never experienced a (recent) major merger, it is possible that the trigger of such a sequence is different from the merger that initiates a similar life-cycle at high luminosities. Nevertheless, investigating the challenges certain objects bring to this idea is useful for identifying and quantifying the caveats associated with this sequence. These objects may also be at interesting stages in their galaxy evolution.
NGC 4736 (or M94, UGC 7996) is a captivating example of an ambiguous galaxy nucleus, which poses challenges to the general understanding of AGN phenomena, including the above mentioned sequence. This object is one of the closest ( Mpc; Tully & Fisher 1988) nearly face-on spiral, with a SAab Hubble Type. Its proximity enables study of details that would be unobservable in more distant systems. Its nucleus has a low-luminosity LINER spectrum, but has been also included in catalogs of Transition objects (Filippenko & Sargent, 1985), or Seyfert 2s (e.g., Spinelli et al. 2006). The AGN nature of this object has been constantly debated, an aging starburst being a compelling alternative (Maoz et al., 1995, 2005; Eracleous et al., 2002; Körding et al., 2005). The galaxy presents a ring of H ii regions at a radius of ″, red arcs at ″, a high surface brightness nuclear region, and high far-infrared bulge emission (Kinney et al., 1993; Smith et al., 1994). Its intricate structure of off-nuclear compact source detections in X-ray (Eracleous et al., 2002), radio (Körding et al., 2005) and UV (Maoz et al., 2005), that do not necessarily match with each other, certainly increase the ambiguity associated with the nature of the main nuclear ionization mechanism. A common implied scenario in all of these studies is that this system is probably in the final stages of a merger.
We reexamine here NGC 4736 in the context of additional evidence for its AGN nature, which is the detection of a broad H component in its nuclear spectrum, as observed by the Hubble Space Telescope () with the Space Telescope Imaging Spectrograph (STIS). We also gather multi-wavelength data and show that source of the broad H-alpha emission line is coincident with a compact X-ray and radio source. These observations suggest that NGC 4736 hosts a broad line region of significantly low luminosity, which makes this object one of the least luminous LINERs with strong evidence for BH accretion. Interestingly, BH mass indicators calibrated on rapidly accreting Seyfert galaxies give highly discrepant mass estimates in this more quiescent system. The value given by the is two orders of magnitude higher than the values obtained via estimators based on the observed emission (X-ray variability, scaling relations, mid-IR emission) which, although physically independent of each other, give a consistent result of . We are thus facing the following conundrum: either a) the standard AGN BH mass indicators do not necessarily apply to sources emitting in this low luminosity regime as, probably, the emission mechanism is fundamentally different from that associated with higher luminosity AGN, or b) the emission signatures do not trace accretion onto the central BH. We discuss possible resolutions of this discrepancy in §5, where we propose some rather exotic scenarios.
2. Data compilation & analysis
NGC 4736 has been quite extensively observed across the whole electromagnetic spectrum. We present in this section the multiwavelength observations of this galaxy nucleus, in connection to new measurements of the broad H emission detected with -STIS.
2.1. The broad H emission observed with HST-STIS
High resolution optical spectra of the NGC 4736 nucleus were obtained with -STIS on July 2002.111Data are publicly available (Prop ID 8591) but have not been published. The observations were obtained with the aperture oriented at PA, with the slit centered along the major axis of the starlight distribution; two cosmic ray split exposures were obtained, one being slightly shifted in the slit direction. The total combined exposure time is 4000s. The G750M grating was set at 6581Å, with a scale of 005/pixel, with no binning. We reduced the spectra using IRAF222IRAF is distributed by NOAO, which is operated by AURA Inc., under contract with the National Science Foundation and the STIS reduction pipeline maintained by the Space Telescope Science Institute (Dressel et al., 2007). This reduction included image combination and cosmic-ray rejection, flux calibration and correction of the wavelength to the heliocentric frame. To measure the nuclear nebular line-emission properties we extracted the 1-dimensional aperture spectrum five pixels wide () centered on the continuum peak. The extracted spectrum thus consists of the central emission convolved with the STIS spatial point-spread function (PSF) and sampled over a rectangular aperture of . The measurements span Å with a resolution of 0.87Å ( km s-1).
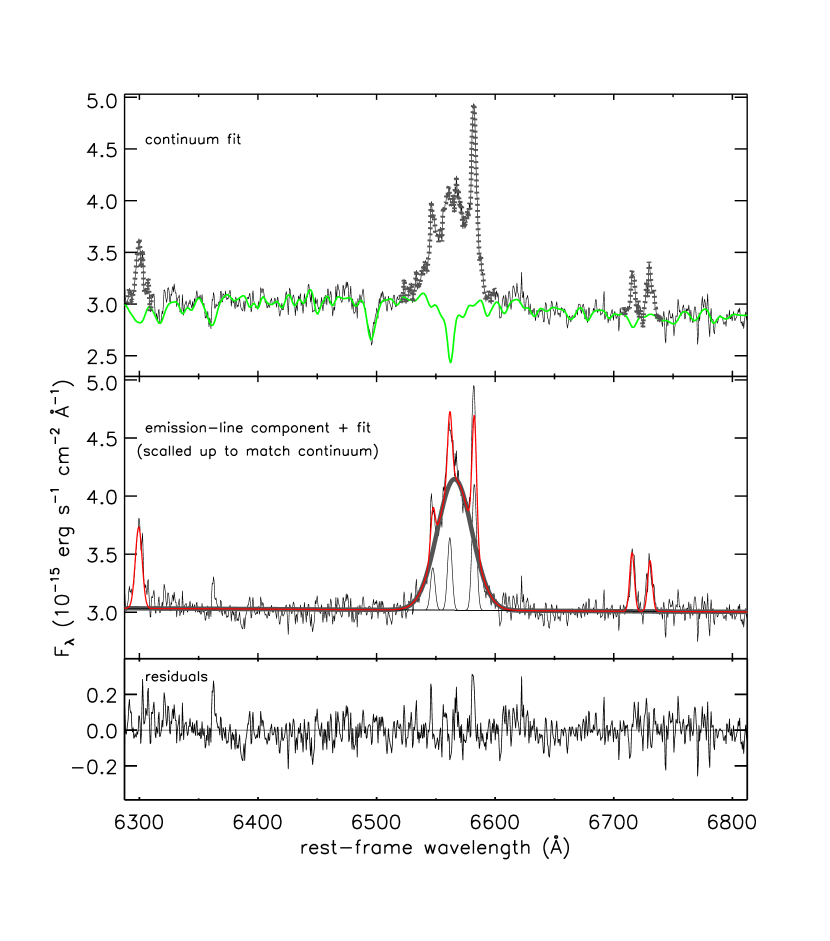
Figure 1 shows the resulting spectrum together with the best matching continuum model, spectral fits of the pure emission-line component, and the associated residuals. The continuum model of the underlying stellar population is obtained via a minimization of a nonnegative least-squares fit between the observed spectrum and a sum of discrete star bursts of different ages, adopted from the Bruzual & Charlot (2003) stellar population synthesis templates, together with dust attenuation modeled as an additional free parameter. The continuum fitting is performed using an adaptation to our data of Christy Tremonti’s code (Tremonti et al., 2004). The pure emission-line spectrum, obtained by subtracting the modeled continuum from the observed spectrum, is fit by a combination of linear continuum and Gaussian components. In addition to narrow emission, the H+[N II] feature shows clear evidence for a broader feature. A flux ratio of 1:3 was assumed for the [N II] doublet, as dictated by the branching ratio (Osterbrock, 1989); the [O I] feature and the [N II] and [S II] doublets were assumed to share a common velocity (red)shifts and widths. The best-fitting Gaussian parameters were derived via an interactive minimization, using SPECFIT (Kriss, 1994). Because of the generally low signal to noise of the 2-d spectrum we are not able to test whether our measurements of the broad H feature could be corrupted by a possible rotating disk as in the case of M84 (e.g., Walsh, Barth, & Sarzi 2010); the match in the widths of the [S II] and [N II] narrow features (as long as that of the narrow H) argue however against such a significant effect.
&0.80fraction of broad H to H+[N II] blend.
0.93fraction of broad H to total H
FWHM(H) 1570 110; in km s-1
v 140 20; in km s-1; broad relative to narrow H
log -13.38 observed flux (erg s-1 cm-2)
log 37.96 observed luminosity (erg s-1)aaassuming distance Mpc.
Measurements related to the broad H feature from the STIS measurements are listed in Table 2.1. The fractional contribution of this broad component to the total flux of the H+[N II] blend is 80%. Compared to other galaxies with broad line emission in the Palomar survey (Ho, Filippenko & Sargent, 1997b), the width of the broad H is typical (1570 km s-1). However, at just 9.1 ergs s-1, the H luminosity is lower than any known broad line sources in the Palomar sample or the Sloan Digital Sky Survey (Ho, Filippenko & Sargent, 1997b; Greene & Ho, 2007). This includes the famous low luminosity Seyfert 1 galaxy, NGC 4395, which has a luminosity of ergs s-1 (Filippenko & Sargent, 1989) and is at a similar distance to NGC 4736. Note also that the broad H feature is redshifted by km s-1 relative to the narrow emission, that is locked at the systemic velocity of the object; velocity offsets between the broad H and narrow lines are not unusual (Ho, Filippenko & Sargent, 1997a).
Evidence for broad H emission has also been presented in a recent PCA tomography study applied to this nucleus (Steiner et al., 2009). The observations reported in this case come from the Gemini Multi Object Spectropraph (GMOS)-IFU data cube, and have been obtained 4 years after the -STIS spectrum had been acquired. Thus, the broad H line associated with the nucleus of M94 appears to be persistent for at least 4 years. They derive a broad H luminosity of ergs s-1, 6 times brighter in the GMOS data than the one we detect in the STIS spectrum. The difference could result from true variability in the broad line luminosity, or could be due to differences in aperture size or placement. We note that Steiner et al. (2009) suggest the broad line region is offset from the photocenter of the galaxy by 015, while our spectral aperture coincides with the photocenter. Even with their higher H luminosity, this source is among the least luminous known broad line AGN.
2.2. Ground-based optical spectroscopy & the spectral classification
Ground-based optical spectra of the NGC 4736 nucleus are available from the Palomar spectroscopic survey by Ho, Filippenko & Sargent (1997a) and the integrated spectrophotometric survey survey of Moustakas & Kennicutt (2006) conducted with the 2.3m Bok telescope, as well as from new data we acquired on February 2008 at the MMT Observatory. The MMT spectrum is obtained with the Blue Chanel Spectrograph, the 500 grooves/mm grating used in first order with the 1″slit, and covers with 3.6Å resolution. None of these data show indications of broad H emission. This outcome is not surprising given the feature’s flux in the HST spectrum, which would be very difficult to discern in the 1″or 2″apertures employed in these ground-based observations, which are at least one order of magnitude larger than that used in the -STIS observations. Through a 2″aperture ( 40 pc), NGC 4736’s emission complex H [N II] is generally heavily swamped by the host stellar light.
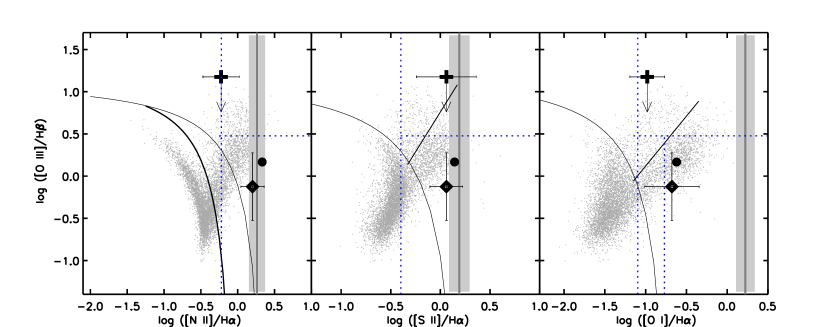
Probably as expected, measurements of NGC 4736’s narrow-line emission are consistent with this system being powered at least partially by a non-stellar source, regardless of the resolution of its observation. Figure 2 shows the location of this nucleus in the 3-dimensional diagnostic diagram usually employed in classifying emission-line galaxies (e.g., Baldwin, Phillips, & Terlevich, 1981; Veilleux & Osterbrock, 1987; Kewley et al., 2006), for different sets of data mapping to pc. As with the -STIS observations, the ground-based measurements are performed after the host stellar contribution has been subtracted from the observed spectrum by means of absorption galaxy template fits. Our MMT spectrum offers only an upper limit for the [O III]/H while the Palomar line flux measurements are at least 50% uncertain. We list the measurements of the nebular emission of this nucleus as observed by Palomar, Bok, MMTO, and -STIS in Table 2. Because measurements of the [O III]/H ratio are not available in the HST spectrum, we show the high-resolution measurements in Figure 2 using the [O III]/H from the Palomar catalog; it is readily apparent that the high resolution data are consistent with a LINER or a Seyfert classification for this object, and reveal its type 1 (broad-lined) character.
| line name | HST-STIS | Palomarbbnonphotometric conditions; line ratios are at least 50% uncertain. | Bokcc25 slit, 2.3m telescope; photometric conditions (Moustakas & Kennicutt, 2006). | MMTOdd1″slit; fluxes are in units of erg s-1 cm-2. |
|---|---|---|---|---|
| [O I] 6300 | 5.030.31 | 6.03 | 2.80.9 | 7.01.0 |
| H (narrow) | 3.000.32 | 13.51.9 | 22.02.4 | |
| [N II] 6583 | 5.250.25 | 54.01 | 21.51.5 | 39.32.9 |
| [S II] 6716 | 2.480.18 | 18.59 | 8.31.1 | 15.50.3 |
| [S II] 6731 | 2.160.18 | 16.33 | 7.21.1 | 9.80.3 |
2.3. The radio, UV and X-ray observations & the astrometric coincidence with the broad H emission
Across the electromagnetic spectrum, the center of this galaxy exhibits a complex morphology. There is a plethora of bright radio, UV and X-ray sources detected in the center of NGC 4736. There is a nuclear compact (15 GHz) radio source measured by Nagar et al. (2002) that appears to be associated with that of the brightest of the two close (8.49 GHz) radio sources revealed by Körding et al. (2005), and to that of the brightest of the two ultraviolet point sources, which varies on a 10-year timescale (Maoz et al., 2005). Chandra observations (Eracleous et al., 2002) reveal numerous discrete X-ray sources in the inner galaxy; the second brightest X-ray source, X2 ( erg s-1), coincides within the errors with the nucleus position. The off-nuclear radio, UV and X-ray sources are apparently unrelated to each other.
The relation to possible optical counterparts of these observations is not well constrained in the literature. We thus investigated this issue, with a particular interest in the degree to which our newly detected broad H coincides in position with the multi- detections. We used for this purpose a variety of archival images from the HST: WFPC2/PC data in the F555W filter data (PID: 5741 and 10402), HRC data in the F250W and F330W filters (PID: 9454), and NICMOS/NIC3 data in the F160W filter (PID: 9360). All data were downloaded from the HST archive and images were drizzled together when required. Absolute astrometry was performed on these data as well as the STIS observations (taken with the slit out) using a ground based V-band image obtained from the Spitzer Infrared Nearby Galaxies Survey (SINGS) ancillary data (Kennicutt et al., 2003). These SINGS observations were aligned to the USNO-B system using 80 stars and then astrometry of the HST data was obtained by degrading the resolution of the F555W image to match the SINGS image. All other HST images were then matched with the astrometry corrected F555W frame to an accuracy of . The absolute error on this astrometry is about 02, and is dominated by scatter of stars in the SINGS image relative to the USNO-B positions.
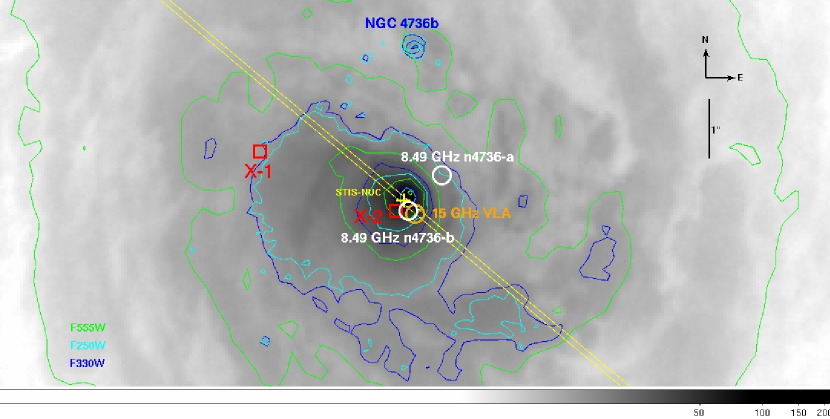
Figure 3 illustrates the result of this data compilation and the corresponding radio, UV and X-ray source matches. It is clear that, within (4 pc), there is an obvious astrometric match in the nuclear X-ray, UV, optical, radio compact sources, and the newly detected broad H emission line. The nucleus position as observed by STIS has RA: 12h50m5320, DEC: 41 07 1340. The off-nuclear X1, that is the brightest compact X-ray source detected in this galaxy nucleus, has no counterpart at other wavelengths. Same is true for the off-nuclear 8.49 GHz detection, that is only 1″(20pc) away from the nucleus. The off-nuclear UV source is the only one detected in optical light.
3. NGC 4736’s nuclear emission across the electromagnetic spectrum and
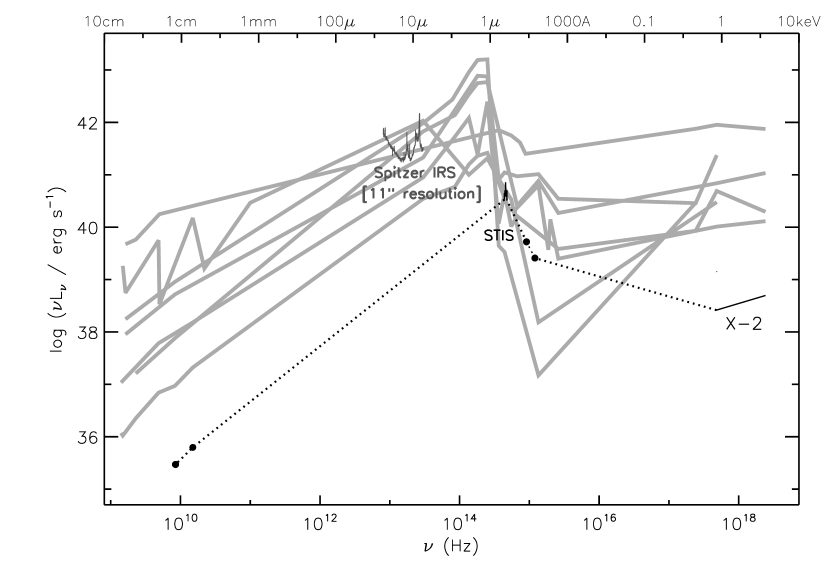
With the wealth of data available for this galaxy nucleus, we are able to build its least contaminated X-ray to radio nuclear spectral energy distribution (SED). The multiwavelength observations of the sources detected in the very central regions of NGC 4736, plotted in units, are displayed in Figure 4. The X-ray detection X2 is represented here by a power-law, estimated based on its photon-indices , where the absorbing column density is fixed at the Galactic value. Both F250W and F330W UV observations are plotted, only for the nuclear detections. The optical data are represented by the HST -STIS spectrum, featuring the strong H emission line. Measurements corresponding to all the radio observations discussed above are indicated. For the sake of completeness, we also include in this plot lower spatial resolution observations from SINGS IRS (Kennicutt et al., 2003) as well. We show all of these measurements superposed on the SEDs of LLAGN from Ho (1999). No artificial normalization has been performed, and there is no correction for absorption in either the Galactic extinction (except for the X-ray data), or intrinsic to NGC 4736.
| log (/Hz) | log (/erg/s) | Resolution | Obs. date | Instr. |
|---|---|---|---|---|
| 18.38 | 38.69 | 015 | 5/2000 | Chandra-ACIS |
| 17.68 | 38.42 | 015 | 5/2000 | Chandra-ACIS |
| 15.08 | 39.41 | 05 | 6/2003 | ACS F250W |
| 14.96 | 39.72 | 05 | 6/2003 | ACS F330W |
| 14.68 | 39.91 | 01 | 6/2002 | HST-STIS |
| 14.64 | 39.93 | 01 | 6/2002 | HST-STIS |
| 13.48 | 40.58 | 47 | 5/2004 | IRS-SH |
| 13.19 | 40.33 | 111 | 5/2004 | IRS-SH/LH |
| 12.91 | 40.87 | 111 | 5/2004 | IRS-LH |
| 10.18 | 35.79 | 0 | 1/2001 | VLA, A config. |
| 9.93 | 35.47 | 0 | 6-10/2003 | VLA, A config. |
With X2 and n4736-b as the X-ray and the 8.5 GHz counterparts of the broad H detection respectively, and assuming the continuum could be described as simple power-laws between the points we present data for, this object’s nuclear SED corresponds to erg s-1. Spitzer data is not included in estimating because they do not reflect the IR emission of the uncontaminated nucleus; the aperture used in these observations is very large (see Table 3), including the entire field-of-view shown in Figure 3. This luminosity makes NGC 4736 one of the least luminous LINERs with strong evidence of BH accretion. This source is thus a critical signpost of BH accretion at extremely low levels. Note that this object’s weak emission is most likely not caused by obscuration; Ho, Filippenko & Sargent (1997a) list a Balmer decrement of (albeit highly uncertain, with a probable error of ), and Eracleous et al. (2002) provide an upper limit for the neutral hydrogen column density of cm-2.
3.1. Comparison with other observed LLAGN
Figure 4 shows that NGC 4736’s SED is very similar to those of other LLAGN (Ho, 1999). This suggests that, in spite of the significant difference in , there is no fundamental transition in the accretion mode in this source compared to other LLAGN.
The similarity of the SED means that previously proposed bolometric corrections for LLAGN appear to work quite well for NGC 4736. The value estimated based on the correction to the [O III] line luminosity that Heckman et al. (2004) proposed to work well for Seyferts is erg s-1 ( here is measured from the ground within the Palomar survey, and is not corrected for intrinsic reddening). If the more recent assessment of the bolometric correction of Kauffmann & Heckman (2009) is used, with corrected for reddening based on the Balmer decrement listed above and a attenuation law (Charlot & Fall, 2000), then erg s-1, which compares satisfactorily with the measured . The average bolometric correction to the observed 2-10 keV X-ray luminosity proposed by Ho (2008), with , results in a somewhat lower value, erg s-1; with the more recent average bolometric correction to the 2-10 keV luminosity of Eracleous, Hwang, & Flohic (2010a), erg s-1, and thus, very close to our integrated value. Within a typical uncertainty of 50%, all of these estimates are consistent with the measured value. Other, more uncertain bolometric indicators are also consistent with our integration: the correlation between the mid-IR [Ne V] emission-line luminosity and bolometric luminosity derived by Satyapal et al. (2007) for a small sample of much brighter nearby AGN, that has a large scatter ( 1 order of magnitude), gives a erg s-1, which is very close to our measured value.
This good match among quite a variety of bolometric estimators derived independently from the multiwavelength properties of AGN supports the AGN interpretation for this system. However, there are two details of its emission spectrum which are unlike typical broad-lined LLAGN.
First, despite that fact that the broad H emission of NGC 4736 is one of the weakest measured among type 1 AGN, the total H emission is peculiarly strong relative to the X-ray counterpart. The ratio (2-10 keV)/ is 6, and thus lower than the median of exhibited by the type 1 AGN (and low- quasars) included in e.g., Ho et al. (2001) study that revealed a relatively tight correlation between the two types of emission. With the higher broad H flux from Steiner et al. (2009), the ratio is even lower, (2-10 keV)/. This finding is surprising given that the low luminosity nearby galaxies that deviate from the linear scaling toward lower values of the ratios are the type 2 sources, mostly Transition Objects, where the ionization mechanism is not necessarily dominated by an AGN-type of source. Following e.g., Ho et al. (2001) arguments, the unusually low ratio measured in the nucleus of NGC 4736 suggests that either: 1) the optical line emission is not powered exclusively by a central AGN, or 2) the X-ray emission in this system arises, at least partially, from a non-AGN source, e.g., an X-ray binary. A final possibility is that the source is highly variable (as suggested by the UV, X-ray, and H observations) and thus, the unusual is the result of measurements made at different times.
Second, NGC 4736’s nebular emission shows a number of peculiarities. To start with, the electron density in NGC 4736’s nebular emission is very low, and it does not show the typical gradient exhibited by AGN, i.e., increase toward the more nuclear regions (Constantin et al. 2011, in prep.). In both the Palomar and HST -STIS observations, the ratio [S II] 6716/6731 is (Table 2), implying an electron density of cm-3, which lies at the lowest end in the distribution of particle densities measured in the Palomar objects (Ho et al., 2003).
Given the lack of a density gradient in the line emitting region it is then rather peculiar to observe a significant increase (by a factor of 6) in the [O I]/H line flux ratio in the HST spectrum relative to the large aperture observations, which would usually be interpreted as an indication for a more pronounced AGN-like ionization in the more central regions. There are two reasons for this: 1) [O I] requires a significantly hard radiation field, i.e., that of an AGN, to sustain a sufficiently extensive partially ionized zone in clouds optically thick to Lyman continuum, and thus to produce a strong such feature. Since the ionization potential of [O I] matches that of H very well, large differences in the [O I] /H ratios are expected between accretion and non-accretion sources. 2) given the lack of a density stratification in this nucleus, the degree of ionization of the emitting gas is expected to diminish with radius as the ionizing radiation emerging from a nuclear source falls off in density as , and thus produce strong gradients in the [O I] /H ratio.
In summary, NGC 4736 may be a broad-lined AGN, with an SED similar to other LLAGN, but it is atypical in several aspects whose physical origin remains unclear. Given the above listed possible explanations for the peculiar ratio, we evaluate in the next subsection whether photoionization by the weak AGN in this system is sufficiently powerful to balance the emission cooling in this system.
3.2. Comparison of ionizing and emission-line power
The multi-wavelength observations of this system allow for a relatively rigorous assessment of whether the photoionization by this system’s AGN can power the measured emission-line luminosities, and in particular that of the broad H component. Following Eracleous, Hwang, & Flohic (2010b), we can run an energy budget test via a direct comparison of the H luminosity and count rate with the ionizing luminosity and the ionizing photon rate .
It is important to treat separately the broad and narrow emission line features as there is strong evidence that they originate from regions of significantly different physical conditions. The broad H comes from a much more compact and much denser emitting gas than the narrow Balmer and forbidden lines. The difference in density is at least 3 orders of magnitude; the critical density for collisional excitation of the [O I] ( cm-3) can be used to estimate the gas density of the broad line region, as [O I] does not exhibit a broad component in this nucleus’ emission. The difference in size is expected to be orders of magnitude (e.g., reverberation mapping of nearby Seyfert galaxies measured to be week, Denney et al. 2010). Thus, the mechanisms that can operate in these two regions are expected to be qualitatively different. The photon and energy balance conditions should reflect these differences, and thus should differ as well; in particular, potential contributions to the H emission via collisional excitation should be minimal for the narrow line emitting region, but important for the broad component.
Based on photoionization models (i.e., Cloudy, v94.0; see Ferland et al. 1998) computed by Lewis et al. (2003) for a wide range of ionization parameters, densities and metallicities, Eracleous, Hwang, & Flohic (2010b) finds that energy balance in a line-emitting nebula requires that , where is the covering factor, or the fraction of the ionizing luminosity of the AGN that is absorbed by the line-emitting gas. These models are covering electron densities that appear to encompass both the broad and the narrow line emitting regions in NGC 4736; thus, with only a fraction of 10% of ionizing photons photons being absorbed by the line-emitting gas, the minimum energy balance condition for AGN ionization is given by , for both narrow and broad emission features. In the same time however, a minimum requirement for photon balance can be quite different for the two emission regions: for the narrow line component , corresponding to the case B recombination (i.e., one H photon is emitted for every 2.2 recombinations); for the denser broad line emitting region, the number of H-alpha photons that can be produced for each ionization can be at least 7-8 times higher than the standard case B estimate, or (e.g., Osterbrock, 1989).
| log aathe luminosities are measured in erg s-1 and the photon rates in s-1. | log aathe luminosities are measured in erg s-1 and the photon rates in s-1. | bb the minimum energy balance condition for AGN ionization is given by (when a fraction of 10% of ionizing photons photons is absorbed by the line-emitting gas) | ccthe minimum photon balance condition for AGN ionization is given by for the narrow line regions, and for the broad component. | |
|---|---|---|---|---|
| Palomar | ||||
| Bok | 37.5 | 49.0 | 165.9 | 4.9 |
| MMTO | 37.7 | 49.2 | 104.7 | 3.1 |
| HST-STIS, narrow | 36.8 | 48.4 | 759 | 22.4 |
| HST-STIS, broad | 37.9 | 49.5 | 57.5 | 1.6 |
| PCA tomography | 38.8 | 50.3 | 8.7 | 0.25 |
With the and values already calculated by Eracleous, Hwang, & Flohic (2010b) by integrating M94’s nuclear SED assuming that pairs of points could be connected by a power-law, and with the H measurements from all HST and ground-based observations presented above, we can proceed with the comparison. Table 4 lists the , , and associated ratios , for all of these optical spectroscopic observations, where the narrow and broad H measurements are shown separately.
It is readily apparent that while is in general (), it is almost never (); the only exception is the narrow H emission measured in the aperture. Thus, a dominant AGN ionization of the narrow line region in this nucleus is definitely possible in the aperture, but only for at larger radial distances. For the broad H feature, an AGN ionization is possible only if . The PCA tomography measurement of the broad H argues, however, against a balanced energy budget originating entirely in an AGN-like power mechanism, even when a maximum covering factor is considered; the AGN-produced energy falls short of the required amount by at least 50%. Interestingly, the measured ratio is well within the required photon balance corresponding to an AGN excitation for both the narrow and the broad emission features. Thus, with one clear exception, the AGN in NGC 4736 appears to be capable of providing enough photons to explain the observed H luminosity but only for relatively high values.
Simply because the AGN-like SED of NGC 4736 can explain the majority of the ionization energy and photon rate does not imply that the actual mechanism is an AGN; alternative excitation mechanisms must be explored. Possible options are: i) we are missing ionizing photons from accretion onto the central BH, or ii) there are other power sources that could make up the power deficit in this system, particularly for producing the broad H feature.
The first alternative could be possible if we were observing an “echo” of a previous epoch of more violent accretion, a few hundred years ago. This idea has been explored by Eracleous et al. (1995), who showed that the reverberation of an ionizing flare in the nebula can produce LINER-like emission-line ratios. In this scenario, it is expected that the central UV source and the [O III] line would also follow the decay of the ionizing continuum; while the UV observations are not providing clear evidence for such a decay over the course of one decade, the multiple optical spectroscopic observations that we present in Figure 2 are consistent with a possible decrease in time (a few years) in the [O III] flux (in this model, H, [S II], [O I] are expected to decay very slowly, in years). Nevertheless, this duty-cycle hypothesis also requires that the broad-line emission fades immediately if the ionizing continuum declines, and the PCA tomography observations show that this is not happening in this source. The echo of such an ionizing continuum flare should also be detectable in a narrow-band [O III] 5007 image in the form of a ring, which is not readily observed in M94.
The second alternative of power sources other than accretion, has been often proposed in explaining the emission-line spectra of LINERs, with mixed success (see §1). The most probable alternative sources appear to be the mechanical power delivered by compact radio jets, along with photoionization by young or post-AGB stars from old or intermediate-age stellar populations. Shock models are highly unlikely to produce broad emission features, and thus, are not favored in this case. Recent star-formation activity remains however a viable options, particularly in light of relatively new discoveries of peculiar supernovae with broad H features that do not appear to fade in time. This idea is discussed in more detail in §5.
4. The Black Hole Mass
Given the unusual energetics of M94’s nucleus, it is important to investigate whether the BH mass estimators derived for rapidly accreting Seyferts, which appear to be widely used for AGN, also work in the low-luminosity regime flagged by this particular system.
There are a variety of indirect methods that can be used to estimate the mass of BHs in galaxy centers. The available multi-wavelength measurements of the nuclear emission for NGC 4736 allow the calculation of based on four different techniques, as well as with the relation. In this section, we explore and compare the results of these five methods, along with their consequences for this object’s energetics, and a comparison with a recent dynamical measurement of for this object, which is listed in Kormendy, Bender, & Cornell (2011) as obtained from Gebhardt et al. (2011, in preparation). We first present the methods and associated calculations, and then discuss the shortcomings of each measurement.
-
1.
Using the relation, established for quiescent nearby galaxies, including both ellipticals and spirals with classical bulges, as quantified by Gültekin et al. (2009a), for km s-1 (Barth et al., 2002), ; within errors, this value agrees well with Gebhardt et al. dynamical measurement. With this value, , which is consistent with the range of values within LINERs are expected to lie (e.g., Ho, 2004; Ho, 2008).
-
2.
Using the HST measurements of the FWHM and the luminosity of the broad H component (see Table 2.1) within the scaling relation based solely on observations of this broad emission feature, as derived by Greene & Ho (2005), we obtain ; the fractional uncertainty associated with this measurement is 30%, and includes both the scatter in the scaling relation and the errors in the line measurements. With the broad H line luminosity measured in the PCA tomography study (Steiner et al., 2009), the BH mass would increase (by a factor of 6.5) to . The difference in these two values could be considered the most conservative uncertainty associated with this BH mass estimate. The corresponding Eddington ratios for these BH masses are .
-
3.
Mid IR detection and measurements of the [Ne V] (14.32 m) and [O IV] (25.89 m) emission lines (Dudik, Satyapal & Marcu, 2009) give, via the empirical correlations between the MIR line luminosities and reverberation mapping-based values presented by Dasyra et al. (2008), a black hole mass of , and respectively. The corresponding Eddington ratio is in this case . Note that the scatter adopted for these relations is only a lower limit of the real value, thus, the uncertainty may be larger.
-
4.
The normalized X-ray excess variance method, as described in Papadakis et al. (2008), applied to Chandra observations (Eracleous et al., 2002) gives . To be specific, we used for this calculation the excess variance , erg s-1 as derived in Section 3, and h-1 (where is the length of the light curve), to estimate the break frequency and then via equations 4 and 6 respectively, of Papadakis et al. (2008).
-
5.
The of this system can also be obtained via the “fundamental plane of black hole activity” that relates black hole mass to the emitted compact radio (5GHz) and hard X-ray luminosities (2-10 keV), and spans nine orders of magnitude in black hole mass. We calculate erg s-1 using the two 8.5GHz and 15 GHz radio measurements presented in this paper (Figure 3, Table 3), with a flux modeled by a power-law . Using the empirical fits of Merloni, Heinz & di Matteo (2003) for the fundamental plane relation, log ( for the black hole in this system; note that this measurement and its associated errors embrace all of the estimates presented above, and thus, do not provide any additional constraint to the . Interestingly, the latest derivation of the fundamental plane relation (Gültekin et al., 2009b), applied to very low nuclear galactic luminosities, provides a log ( for this system, which remains consistent only with the value, as it departs considerably from those provided by the relations employing AGN emission.
There is a significant inconsistency between the value given by the relation, which is supported by Gebhardt’s dynamical measurement, and those based on the AGN emission. The relation suggests a BH mass in NGC 4736 of 1107 M☉, and a correspondingly low of . Three of the estimates based on the AGN emission converge to black hole masses of M☉ (and ), showing a surprisingly consistent departure of two orders of magnitude from the estimate. The fundamental plane relation provides a value right in between these two different situations, however, with no real additional constraint, due to its associated large uncertainty. These differences are somewhat puzzling given that the BH mass estimates based on nuclear emission properties are all calibrated to follow the for high mass black holes (). It is however true that the calibrators are biased toward nearby Seyfert galaxies with much higher Eddington ratios than that of NGC 4736. We briefly discuss in the following subsections more specific weaknesses of each measurement.
4.1. Caveats of the relation
The relation is expected to provide a reliable estimate of the BH mass as it is based on the strong correlation between dynamical mass measurements of supermassive BHs and their host properties (Ferrarese & Meritt, 2000; Gebhardt et al., 2000; Tremaine et al., 2002; Gültekin et al., 2009a). This relationship is derived primarily from ellipticals and spirals with classical bulges (formed during major mergers). Recent observations suggest it may not be valid for samples of later-type spirals which more commonly host pseudobulges (formed via secular disk processes) (e.g. Greene et al., 2010). Because the distinction between classical and pseudobulges is based on formation, it does not simply correlate with observable properties (Kormendy & Kennicutt, 2004; Fisher & Drory, 2010). In general pseudobulges are less luminous, have lower bulge-to-total ratios, have on-going star formation and lower Sérsic indices than classical bulges. The possibility that the NGC 4736 is in fact a pseudobulge provides a solution to the apparent conflict in BH mass estimates.
Nevertheless, pseudobulges are difficult to identify, and there is not yet a consensus as to what defines them. To complicate things further, classical and pseudobulges can exist within the same galaxy (e.g., NGC 2787; Erwin et al. 2003). The classification of the NGC 4736 bulge is ambiguous: Fisher & Drory (2010) classifies it as a pseudobulge based on its nuclear spiral and bar and low Sérsic index (). However, they also find it has a low star formation rate, more typical of classical bulges, and thus classify it as an “Inactive Pseudobulge;” if NGC4736 hosts a pseudobulge, it is an atypical one. We have created a surface brightness profile from NICMOS and 2MASS H-band data from the Large Galaxy Atlas (Jarrett et al., 2003) and found results that conflict with the fits of Fisher & Drory (2010). Specifically, we find Sérsic indices for the bulge of depending on the radial range and type of fit (single vs. double Sérsic), which are consistent with a classical one (as shown in Fisher & Drory, 2010).
Our surface brightness profile fits also reveal the presence of a nuclear star cluster within the central (12pc), with an H-band magnitude of 12.5. Such nuclear star clusters are common in early-type spiral galaxies (Carollo et al., 2002). The luminosity and mass of nuclear star clusters are known to scale with bulge luminosity and mass (Balcells et al., 2003; Ferrarese et al., 2006; Rossa et al., 2006), and the NGC 4736 nuclear star cluster has a luminosity that is 0.1% of its bulge, typical for nuclear star clusters (Côtè et al., 2006). Nuclear star clusters commonly co-exist with black holes, but there are a very limited number of cases where masses for both can be estimated (Seth et al., 2008). In these cases, including the Milky Way, the BH mass is similar to the mass of the nuclear star cluster within an order of magnitude. There is also some evidence that the ratio of BH mass to nuclear star cluster mass increases with spheroid mass (Graham & Spitler, 2009). For NGC 4736, assuming an old population with an H-band M/L 0.7, the nuclear cluster would have a mass of M⊙. This mass is quite similar to the BH mass estimate, suggesting thus the presence of a similar sized BH.
4.2. Caveats of the BLR scaling relation
The BLR scaling relations were derived using high luminosity systems (i.e., Seyferts, not LINERs) and have been scaled to match the dynamical black hole detections of BHs with masses M☉. Thus, their applicability to NGC 4736, where they yield an estimate of M☉, is a (perhaps unwise) extrapolation. These relations assume that the BLR is virialized due to proximity to the BH (Peterson & Wandel, 1999) and thus the 5100Å continuum luminosity correlates with the emissivity weighted radius of the BLR, and thus with the BH mass (Kaspi et al., 2000). The overall errors associated with BH mass measurements based on these relations do not exceed 0.5 dex (Vestergaard, 2002; Nelson et al., 2004; Onken et al., 2004), and there appears to be good consistency with BH masses obtained via the relation for relatively bright AGN ( erg s-1), with (Barth et al., 2005). More recent calibrations of the radius-luminosity relationship on which these techniques are based infer that BH masses have been overestimated, however, only by up to a factor of 3 (Bentz et al., 2009). This latter study also indicates a trend toward larger uncertainties, and larger amount of overestimation in the BH with decreasing luminosity, however, no conclusive results are yet available for this regime.
4.3. Caveats of the MIR line-correlation
The Dasyra et al. (2008) empirical relation between the MIR line emission properties and the BH mass is derived using reverberation mapping BH masses, and thus, as with the previous method, may not apply to systems with . The relation holds for systems with , but not necessarily beyond this range. The given by this method places this object at the low end of this range; on the other hand, a more massive and thus quiescent BH would correspond to a [Ne V] luminosity of a few orders of magnitude lower than that measured. The scatter associated with this relation remains in average 0.5 dex, and thus cannot account for the orders of magnitude difference between this value and that obtained via .
4.4. Issues with estimating the BH mass from X-rays
The BH mass derivation based on X-ray variability, or more precisely on the relation between the excess variance and , relies on the hypothesis of a universal power spectral density function (PSD) shape and amplitude in AGN, which is based on the idea that the X-ray variability mechanism and the accretion efficiency are the same for all AGN, at all redshifts. These assumptions appear to hold for the objects involved in deriving and testing this relation (Papadakis et al., 2008); that sample is, however, small and rather biased toward luminous (X-ray) sources, with log . None of the 2 - 10 keV sources detected in the nucleus of NGC 4736 are in this luminosity range. Nevertheless, Galactic BHs () in their hard states show variability properties that match well those of AGN, both of these types of sources falling on the same projection of the plane, where , suggesting that an extrapolation to the intermediate mass BH (or lower ) level is practicable.
4.5. Problems with the Fundamental Plane
Finally, it appears that the main problem with the fundamental plane is that the relation is not sharpened enough to provide strong constraints on BH masses. Because the relation spans nine orders of magnitude in BH mass, it is expected to equally apply to any value of in the range we are interested in. It is also the case that a wide variety of BH accretion models (e.g., with efficient and inefficient flows for the X-ray emission, or associating X-ray flux with synchrotron emission near the base of a jet) are consistent with this relation (e.g., Falcke & Biermann 1995; Heinz & Sunyaev 2003), suggesting that a large diversity of accretion modes or rates are accommodated.
Nevertheless, the fundamental plane remains best constrained only for systems with , and for very low nuclear luminosities, i.e., with negligible or zero AGN contribution that allow a dynamical measurement of their BH mass (Gültekin et al., 2009b). In this regime, the latest derivation of the fundamental plane relation provides for M94 a value consistent with the estimate and the dynamical measurement, while it would not reliably constrain a value. The scatter in the fundamental plane relation increases for lower BH masses, with higher Eddington ratios (Körding et al., 2006; Gültekin et al., 2009b).
5. Discussion: Alternative Power Generation Mechanisms
The detection of broad emission, combined with the spatial coincidence of this emission with the detection of X-ray, UV, and radio compact sources, provides strong evidence that this galaxy hosts an accreting massive black hole. The SED of this nucleus makes this object one of the lowest luminosity LINER with a distinct contribution to the total emission by black hole accretion. In this scenario, the nucleus is an AGN and the presence of off-nuclear sources, particularly the radio and the UV detections, may result from remnant jet activity emerging from the nucleus. It is definitely exciting to detect AGN activity at energy levels equal to that of several young supernova remnants of the Cas A variety (Turner & Ho, 1994), an OB association which hosts a high mass X-ray binary (Eracleous et al., 2002), or simply a group of five late O supergiants (Maoz et al., 1995).
Nevertheless, the presence of a number of unusual off-nuclear sources, coupled with the apparent deficit in the photoionizing photons, and with the fact that the BH mass estimates based on AGN emission appear to fail for this object, encourage us to explore alternative scenarios for the NGC 4736 nucleus. In particular, it is very likely that the BH mass estimates that exploit the multi-wavelength AGN characteristics don’t work for this system because at least some of this emission is not the result of BH accretion.
There are certain (peculiar) kinds of core-collapse SNe that present multi-wavelength observations, and in particular broad H emission components with characteristics that are very similar to those we measure in the nucleus of M94. The SN 2005ip, presented by Smith et al. (2009), is a very good example. The so called intermediate H component associated with this SN ejecta presents the same FWHM and brightness level as the broad H detected in the STIS aperture, and it does not show any sign of diminishing its strength over more than 3 year period (see their Figure 7; a broad component with FWHM 10000 km s-1 like the one exhibited by SN 2005ip would not be measurable in the galaxy spectrum as it would be completely swamped in the continuum stellar light, even in the HST-STIS observations).
SNe as luminous as X2, with intrinsically hard X-ray spectra (photon index ), have certainly been encountered, for cases observed few years after the explosion (e.g., ATe #1023; Pooley et al. 2007); for these cases, / ratios are high relative to more standard SN cases (Immler et al., 2007). Another particular example of a SN that matches well the measurements of the nuclear emission in NGC 4736 is SDSS J09529.56+214313.3 (Komossa et al., 2009), which is believed (but not confirmed) to be a SN type IIn. For this system, the broad H component stays strong for at least three years, and its (2-10 keV)/, matching thus very well the surprisingly low value measured for NGC 4736.
The peculiar nebular, radio and UV characteristics of the nucleus of NGC 4736 appear to also compare well the SN phenomenology. The electron densities (or [S II] line flux ratios) measured in this galaxy center are matching exactly the ones measured in the environments of the extraordinary type IIn SNe we compare here with, e.g., SDSS J09529.56+214313.3. The two different band radio observations of this nucleus are consistent with emission from extragalactic SNe, in both intensity and decline rate in flux density (van Dyk et al., 1993; Williams et al., 2002; Chandra et al., 2009). Moreover, the compact radio off-nuclear detection, only 1″(20 pc) away from the nuclear one (Körding et al., 2005) could be interpreted as the result of shock emission associated with a nuclear core-collapse SN. Measurements of the brightness of the off-nuclear UV detection in F250W and F330W place this object into the O star of late (5-ish) type spectral category, fitting thus well into the idea that this nucleus could simply be a star-forming site, and that NGC 4736a’s emission includes significant contributions from a SN which exploded close to the weakly active (and massive, ) central BH.
This SN contribution scenario may have its own drawbacks. If the broad H emission has actually gotten brighter by a factor of 6, as suggested by the comparison between the HST-STIS and GMOS observations, the SN interpretation becomes problematic; variability of the broad line region originating in the AGN could, in principle, account for this effect. Also, the observed intra-day (hour-scale) X-ray variability measured for X2 remains yet to be detected in a supernova, and conflicts with the physical scale over which X-ray emission is expected in SN remnants; thus, this particular behavior may remain strictly associated with the AGN. Additional observations would be necessary to fully confirm or rule out the SN scenario. Specifically, new high resolution observations in the optical, UV, or X-rays would be able to confirm if there is a fading in the light curve, as expected from a SN, and would also allow accurate localization of the source. High S/N optical spectra would much better resolve the emission-line profile, and a possible temporal evolution.
6. Conclusion
We have presented here an exhaustive multiwavelength analysis of the nuclear emission properties of NGC 4736, prompted by new measurements of a broad H emission component detected in its high resolution HST-STIS optical spectrum. This broad H component, with a luminosity of ergs s-1, is one of the lowest luminosity broad line known. This broad H is coincident with a compact bright X-ray and radio source. Our measurements of this object’s spectral energy distribution reveal a bolometric luminosity of erg s-1, that categorizes NGC 4736 as one of the least luminous LINERs with strong evidence for BH accretion. Our comparison of five independent BH mass estimates reveals a discrepancy of two orders of magnitude between the value predicted by the relation and the value toward which methods based on AGN emission activity in optical, mid-IR and X-rays, seem to converge; the fifth method is provided by the fundamental plane relation, which however, due to its large associated uncertainties, does not offer any additional constraint to this comparison.
We conclude that this system’s BH mass cannot be reliably estimated via standard AGN BH mass indicators because the nuclear emission in this system is not entirely tracing the accretion onto the central BH. Our assessment of the energy budgets of the ionizing and emission-line power suggests a possible deficit in the AGN ionization and production of a broad H emission feature which can be made up by a peculiar kind of Type IIn SN that matches well the nuclear emission of NGC 4736 over the whole electromagnetic spectrum, and supports this galaxy nucleus’ general aging starburst-like appearance.
References
- Abel & Satyapal (2008) Abel, N. P., & Satyapal, S., 2008, ApJ, 678, 686
- Armus et al. (2006) Armus, L., et al., 2006, ApJ, 640, 204
- Balcells et al. (2003) Balcells, M., Graham, A. W., Dom nguez-Palmero, L., Peletier, R.F., 2003, ApJ, 582, 79
- e.g., Baldwin, Phillips, & Terlevich (1981) Baldwin, J. A. Phillips, M. M, & Terlevich, R., 1981, PASP, 93, 5
- Barth et al. (2002) Barth, A. J., et al., 2002, AJ, 124, 2607
- Barth et al. (2005) Barth, A. J., Greene, J.E., & Ho, L. C., 2005, ApJ, 619, 151
- Bentz et al. (2009) Bentz, M.C., Peterson, B. M., Netzer, H., Pogge, R. W., & Vestergaard, M., 2009, ApJ, 697, 160
- Bianchi et al. (2008) Bianchi, S., Chiaberge, M., Piconcelli, E., Guainazzi, M., & Matt, G., MNRAS, 386, 105
- Bruzual & Charlot (2003) Bruzual, G., &Charlot, S., 2003, MNRAS, 344, 1000
- Carollo et al. (2002) Carollo, C. M., Stiavelli, M., Seigar, M., de Zeeuw, P.T., & Dejonghe, H., 2002, AJ, 123, 159
- Chandra et al. (2009) Chandra, P., Dwarkadas, V. V., Ray, A., Immler, S., Pooley, D., 2009, ApJ, 699, 388
- Charlot & Fall (2000) Charlot, S., & Fall, S. M., ApJ, 539, 718
- Comerford et al. (2009) Comerford, J.M., et al., 2009, ApJ, 698, 956
- Constantin & Vogeley (2006) Constantin, A., & Vogeley, M.S., 2006, ApJ, 650,727
- Constantin, Hoyle, & Vogeley (2008) Constantin, A., Hoyle, F., & Vogeley, M.S., 2008, ApJ, 673, 715
- Constantin et al. (2009) Constantin, A., Green, P., Aldcroft, T., Kim, D.-W., Haggard, D., Barkhouse, W., Anderson, S.F., 2009, ApJ, 705, 1336
- Côtè et al. (2006) Côtè, P., et al. 2006, ApJS, 165, 57
- Dasyra et al. (2008) Dasyra, K. M., Ho, L. C., Armus, L., Ogle, P., Helou, G., Peterson, B. M., Lutz, D., Netzer, H., & Sturm, E., 2008, ApJ, 674,9
- Denney et al. (2010) Denney et al., 2010, ApJ, 721, 715
- Desroches, Greene & Ho (2009) Desroches, L.-B., Greene, J. E., & Ho, L.C., 2009, ApJ, 698, 1515
- Dressel et al. (2007) Dressel, L., Hodge, P., & Barrett, P., 2007, Instrument Science Report STIS 2007-04
- Dudik, Satyapal & Marcu (2009) Dudik, R. P., Satyapal, S., & Marcu, D., 2009, ApJ, 691, 1501
- Eracleous et al. (2002) Eracleous, M., Shields, J. C., Chartas, G., & Moran, E. C., 2002, ApJ, 565, 108
- Eracleous, Hwang, & Flohic (2010a) Eracleous, M., Hwang, J.A., & Flohic, H.M.L.G., 2010, ApJS, 187, 135
- Eracleous, Hwang, & Flohic (2010b) Eracleous, M., Hwang, J.A., & Flohic, H.M.L.G., 2010, ApJ, 711, 796
- Ferrarese & Meritt (2000) Ferrarese, L., & Merritt, D., 2000, ApJ, 539, 9
- Ferrarese et al. (2006) Ferrarese, L., et al. 2006, ApJ, 644, 21
- Filippenko & Sargent (1985) Filippenko, A. V., & Sargent, W. L. W., 1985, ApJS, 57, 503
- Filippenko & Sargent (1989) Filippenko, A. V., & Sargent, W. L. W., 1989, ApJ, 342, 11
- Filippenko et al. (1993) Filippenko, A.V, Ho, L. C., & Sargent, W. L. W., 1993, ApJ, 410, 75
- Fisher & Drory (2010) Fisher, D. B. & Drory, N, 2010, ApJ, 716, 942
- Gebhardt et al. (2000) Gebhardt, K., et al. 2000, ApJ, 539, 13
- Goulding & Alexander (2009) Goulding, A.D., & Alexander, D.M., 2009, MNRAS, 398, 1165
- Graham & Spitler (2009) Graham, A. W. & Spitler, L. R., 2009, MNRAS, 397, 2148
- Greene & Ho (2005) Greene, J. E., & Ho, L. C., 2005, ApJ, 630, 122
- Greene & Ho (2007) Greene, J. E., & Ho, L. C., 2007, ApJ, 670, 92
- Greene et al. (2010) Greene, J. E., Peng, C. Y., Kim, M., Kuo, C. Y., Braatz, J. A., Impellizzeri, C. M. V., Condon, J. J., Lo, K. Y., Henkel, C., Reid, M. J., ApJ, in press (arXiv:1007.2851)
- Gültekin et al. (2009a) Gültekin, K., et al., 2009a, ApJ, 698, 198
- Gültekin et al. (2009b) Gültekin, K., et al., 2009b, ApJ, 706, 404
- Heckman et al. (2004) Heckman T. M., et al., 2004, ApJ, 613, 109
- Ho, Filippenko & Sargent (1997a) Ho, L. C., Filippenko, A. V., & Sargent, W. L. W., 1997, ApJS, 112, 315
- Ho, Filippenko & Sargent (1997b) Ho, L. C., Filippenko, A. V., & Sargent, W. L. W., 1997, ApJS, 112, 391
- Ho, Filippenko & Sargent (1997c) Ho, L. C., Filippenko, A. V., & Sargent, W. L. W., 1997, ApJ, 487, 568
- Ho (1999) Ho, L.C., 1999, ApJ, 516, 672
- e.g., Ho et al. (2001) Ho, L. C., Feigelson, E., D., Townsley, L. K., Sambruna, R. M., Garmire, G. P., Brandt, W. N., Filippenko, A. V., Griffiths, R. E., Ptak, A. F., & Sargent, Wallace L. W. 2001, ApJ, 549, L51
- Ho et al. (2003) Ho, L. C., Filippenko, A. V., & Sargent, W. L. W., 2003, ApJ, 583, 159
- e.g., Ho (2004) Ho, L.C., 2004, in Coevolution of Black Holes and Galaxies, Cambridge Univ. Press, the Carnegie Observatories Astrophysics Series, eds. L. C. Ho, p. 293.
- Ho (2008) Ho, L. C., 2008, ARA&A, 46, 475
- Immler et al. (2007) Immler, S., et al. 2007, ApJ, 664,435
- Jarrett et al. (2003) Jarrett, T. H., Chester, T., Cutri, R., Schneider, S. E., & Huchra, J. P., 2003, AJ, 125, 525
- Kaspi et al. (2000) Kaspi S., Smith, P.S., Netzer, H., Maoz, D., Jannuzi, B. T., & Giveon, U., 2000, ApJ, 533, 631
- Kauffmann et al. (2003) Kauffmann, G., et al., 2003, MNRAS, 346, 1055
- Kauffmann & Heckman (2009) Kauffmann, G., & Heckman, T.M., 2009, MNRAS, 397, 135
- Kennicutt et al. (2003) Kennicutt R. C., Jr., et al. 2003, PASP, 115, 928
- Kewley et al. (2006) Kewley, L.J., Groves, B., Kauffmann, G., & Heckman, T., 2006, MNRAS, 372, 961
- Kinney et al. (1993) Kinney, A. L., Bohlin, R. C., Calzetti, D., Panagia, N., & Wyse, Rosemary F. G., 1993, ApJS, 86, 5
- Komossa et al. (2003) Komossa, S., Burwitz, V., Hasinger, G., Predehl, P., Kaastra, J. S., & Ikebe, Y., ApJ, 582,15
- Komossa et al. (2009) Komossa, S., et al., 2009, ApJ, 701, 105
- Kormendy & Kennicutt (2004) Kormendy, J. & Kennicutt, R.C., Jr., 2004, ARA&A, 42, 603
- Kormendy, Bender, & Cornell (2011) Kormendy, J., Bender, R., & Cornell, M. E., 2011, Nature, 469, 374
- Körding et al. (2005) Körding, E., Colbert, E., & Falke, H., 2005, A&A, 436, 427
- Körding et al. (2006) Körding, E., Falcke, H., & Corbel, S., A&A, 456, 439
- Kriss (1994) Kriss G., 1994, in ASP Conf. Ser. 61, Astronomical Data Analysis Software and Systems III, ed. Crabtree, D. R., Hanisch, R.J., & Barnes, J., 437
- Lewis et al. (2003) Lewis, K.T., Eracleous, M., Sambruna, R.M., 2003, ApJ, 593, 115
- Maoz et al. (1995) Maoz, D., Filippenko, A. V., Ho, L. C., Rix, H.-W., Bahcall, J. N., Schneider, D. P., Macchetto, F. D., 1995, ApJ, 440, 115
- Maoz et al. (2005) Maoz, D., Nagar, N. M., Falcke, H., & Wilson, A. S., 2005, ApJ, 625,699
- McHardy et al. (2006) McHardy, I. M., Koerding, E., Knigge, C., Uttley, P., & Fender, R. P., 2006, Nature, 444, 730
- Merloni, Heinz & di Matteo (2003) Merloni, A., Heinz, S., & di Matteo, T., 2003, MNRAS, 345, 1057
- Moustakas & Kennicutt (2006) Moustakas, J. & Kennicutt, R.C. Jr., 2006, ApJS, 164, 81
- Nagar et al. (2002) Nagar, N. M., Falcke, H., Wilson, A. S., & Ulvestad, J. S., 2002, A&A, 392, 53
- Nagar, Falcke, & Wilson (2005) Nagar, N. M., Falcke, H., & Wilson, A. S., 2005, A&A, 435, 521
- Nelson et al. (2004) Nelson, C.H., Green, R. F., Bower, G., Gebhardt, K., Weistrop, D., 2004, ApJ, 615, 652
- Netzer (2009) Netzer, H., 2009, ApJ, 695, 793
- Nikolajuk, Papadakis & Czerny (2004) Nikolajuk, M., Papadakis, I. E., & Czerny, B., 2004, MNRAS, 350,26
- Onken et al. (2004) Onken, C. A., Ferrarese, L., Merritt, D., Peterson, B. M., Pogge, R. W., Vestergaard, M., & Wandel, A., 2004, ApJ, 615, 645
- Osterbrock (1989) Osterbrock, D. E., 1989, Astrophysics of Gaseus Nebulae and Active Galactic Nuclei, University Science Books
- Papadakis et al. (2008) Papadakis, I. E., Chatzopoulos, E., Athanasiadis, D., Markowitz, A., Georgantopoulos, I., 2008, A&A, 487, 475
- Peterson & Wandel (1999) Peterson, B.M., & Wandel, A., 1999, ApJ, 521, 95
- Rossa et al. (2006) Rossa, J., van der Marel, R.P., Böker, Torsten, Gerssen, J., Ho, L.C., Rix, H.-W., Shields, J.C., Walcher, C.-J., 2006, AJ, 132, 1074
- Satyapal et al. (2007) Satyapal, S., Vega, D., Heckman, T., O’Halloran, B., & Dudik, R., 2007, ApJ, 663, 9
- Satyapal et al. (2008) Satyapal, S., Vega, D., Dudik, R. P., Abel, N. P., & Heckman, 2008, ApJ, 677, 926
- Schawinski et al. (2007) Schawinski, K., et al., 2007, MNRAS, 382, 1415
- Schawinski et al. (2010) Schawinski, K., et al., 2010, ApJ, 711, 284
- Seth et al. (2008) Seth, A., Agüeros, M., Lee, D., Basu-Zych, A., 2008, ApJ, 678, 116
- Seth et al. (2010) Seth, A., et al., 2010, ApJ, 714, 713
- Smith et al. (1994) Smith, B. J., Harvey, P. M., Colome, C., Zhang, C. Y., Difrancesco, J., & Pogge, R. W., 1994, ApJ, 425, 91
- Smith et al. (2009) Smith, N., Silverman, J. M., Chornock, R., Filippenko, A. V., Wang, X., Li, W., Ganeshalingam, M., Foley, R. J., Rex, J., Steele, T. N., 2009, ApJ, 695, 1334
- Steiner et al. (2009) Steiner, J. E.; Menezes, R. B.; Ricci, T. V.; Oliveira, A. S., 2009, MNRAS, 395, 64
- Sturm et al. (2002) Sturm, E.; Lutz, D.; Verma, A.; Netzer, H.; Sternberg, A.; Moorwood, A. F. M.; Oliva, E.; Genzel, R., 2002, A&A, 393, 821
- Taniguchi & Wada (1996) Taniguchi, K.,& Wada, K.,1996, ApJ, 469, 581
- Tremaine et al. (2002) Tremaine, S., et al., 2002, ApJ, 574, 740
- Tremonti et al. (2004) Tremonti, C.A., et al., ApJ, 613, 898
- Tully & Fisher (1988) Tully, R. B., & Fisher, J. R., 1988, Catalog of Nearby Galaxies, pp. 224. ISBN 0521352991. Cambridge, UK: Cambridge University Press
- Turner & Ho (1994) Turner, J.L., & Ho, P.T.P., 1994,ApJ, 421, 122
- van Dyk et al. (1993) van Dyk S. D.; Weiler, K. W.; Sramek, R. A.; Panagia, N., 1993, ApJ, 419, 69
- Veilleux & Osterbrock (1987) Veilleux, S., & Osterbrock, D. E., 1987, ApJS, 63, 295
- Vestergaard (2002) Vestergaard, M., 2002, ApJ, 571,733
- Walsh, Barth, & Sarzi (2010) Walsh, J., Barth, A.,& Sarzi, M., 2010, ApJ, 721, 762
- Weedman et al. (2005) Weedman, D. W.; Hao, Lei; Higdon, S. J. U.; Devost, D.; Wu, Yanling; Charmandaris, V.; Brandl, B.; Bass, E.; & Houck, J. R., 2005, ApJ, 633, 706
- Williams et al. (2002) Williams, C.L. et al. 2002, ApJ, 581, 396
- Zhang et al. (2009) Zhang, W. M., Soria, R., Zhang, S. N., Swartz, D. A. & Liu, J. F., 2009, ApJ, 699, 281