Spitzer IRAC identification of Herschel-ATLAS SPIRE sources
Abstract
We use Spitzer-IRAC data to identify near-infrared counterparts to submillimeter galaxies detected with Herschel-SPIRE at 250 m in the Herschel Astrophysical Terahertz Large Area Survey (H-ATLAS). Using a likelihood ratio analysis we identify 146 reliable IRAC counterparts to 123 SPIRE sources out of the 159 in the survey area. We find that, compared to the field population, the SPIRE counterparts occupy a distinct region of 3.6 and 4.5 m color-magnitude space, and we use this property to identify further 23 counterparts to 13 SPIRE sources. The IRAC identification rate of 86% is significantly higher than those that have been demonstrated with wide-field ground-based optical and near-IR imaging of Herschel fields. We estimate a false identification rate of 3.6%, corresponding to 4 to 5 sources. Among the 73 counterparts that are undetected in SDSS, 57 have both 3.6 and 4.5 m coverage. Of these, 43 have indicating that they are likely to be at 1.4. Thus, 40% of identified SPIRE galaxies are likely to be high redshift ( 1.4) sources. We discuss the statistical properties of the IRAC-identified SPIRE galaxy sample including far-IR luminosities, dust temperatures, star-formation rates, and stellar masses. The majority of our detected galaxies have 1010 to 1011 total IR luminosities and are not intense starbursting galaxies as those found at , but they have a factor of 2 to 3 above average specific star-formation rates compared to near-IR selected galaxy samples.
Subject headings:
galaxies: high-redshift – infrared: galaxies – galaxies:starburst1. Introduction
The extragalactic background at far-infrared (IR) and submillimeter (sub-mm) wavelengths is well-constrained from total intensity measurements (Puget et al. 1996; Fixsen et al. 1998; Dwek et al. 1998). However, the properties of the discrete galaxies that make up this background are still largely unknown. These sub-mm galaxies are expected to capture the dusty star-formation out to redshifts of 4 and beyond and are now understood to be an integral component of galaxy formation and evolution (Hughes et al. 1998; Eales et al. 1999; Blain et al. 2002; Chapman et al. 2003; Austermann et al. 2010).
A challenge for studies of sub-mm galaxies is that wide-field surveys at these wavelengths have poor spatial resolution, caused by the limited apertures of single dish sub-mm survey telescopes (Smail, Ivison & Blain 1997; Scott et al. 2002; Coppin et al. 2006). Typical resolutions are of the order of tens of arcseconds, making the identification of multiwavelength counterparts challenging, particularly in the optical where sub-mm galaxies are usually faint due to high dust extinction. Furthermore, the surface density of faint optical galaxies is such that several potential counterparts may be situated within the positional error of each sub-mm source. However, the identification of counterparts to sub-mm galaxies is critical for both photometric and spectroscopic studies, which yield redshifts, spectral energy distributions (SEDs) and morphological information. The measurements of these quantities for statistically significant samples of sub-mm galaxies are required to compare their properties with theoretical predictions, and to fully understand the role of the sub-mm bright phase in galaxy evolution.
The most reliable way to pinpoint the positions of sub-mm galaxies is through high-resolution sub-mm interferometry, which directly traces the dust emission at wavelengths comparable to the original selection function (e.g. Downes et al. 1999; Gear et al. 2000; Iono et al. 2006; Younger et al. 2007). The sensitivity of early generations of sub-mm interferometric instrumentation limited anlayses to samples of no more than a few sources (e.g. Downes et al. 1999; Gear et al. 2000; Iono et al. 2006; Younger et al. 2007, 2008, 2009; Ivison et al. 2008; Cowie et al. 2009; Aravena et al. 2010a; Hatsukade et al. 2010; Tamura et al. 2010; Chen et al. 2011 ), and although rapid progress is being made (e.g. Smolcic 2012a,b) such observations are still unfeasible for large surveys of sources. In addition, extended sources (e.g. Matsuda et al. 2007), or sources that are a blend of multiple components (e.g. Wang et al. 2011; Smolcic 2012b), can be difficult to detect.
An alternative technique to identify sub-mm galaxies is to take advantage of the far-IR-radio correlation (e.g. Condon et al. 1998; Garrett 2002) and the relatively low surface density of radio sources by searching for counterparts in deep interferometric radio data (e.g. Ivison et al. 1998, 2002; Borys et al. 2004; Dye et al. 2009; Dunlop et al. 2010; Biggs et al. 2011). Similarly, the dusty, active sub-mm galaxies are typically bright at mid-IR wavelengths, a property that has also been utilized to identify counterparts (e.g. Ivison et al. 2004; Pope et al. 2006; Dye et al. 2008, 2009; Clements et al. 2008; Dunlop et al. 2010; Biggs et al. 2011). Deep radio and mid-IR (typically Spitzer MIPS 24 mbut also Spitzer IRAC 3.6 m; Biggs et al. 2011) searches typically identify counterparts to 60–80% of sub-mm galaxies, and nearest-neighbor positional matching is then used to investigate the properties of these sources at other wavelengths. The remaining 20–40% of sources are thought to be at high-redshifts ( 3) or be dominated by cold dust ( K at ; Chapman et al. 2005).
The Herschel Astrophysical Terahertz Large Area Survey (H-ATLAS; Eales et al. 2010) is the largest open-time key project being undertaken by the Herschel Space Observatory (Pilbratt et al. 2010)111Herschel is an ESA space observatory with science instruments provided by European-led Principal Investigator consortia and with important participation from NASA.. The total planned survey area is 550 deg2 within which it is expected to detect 300,000 bright sub-mm galaxies. During the Science Demonstration Phase (SDP), H-ATLAS observed 14.4 deg2 in the Galaxy And Mass Assembly (GAMA; Driver et al. 2011) 9 hour field, to 5 depths of 35 to 132 mJy in five bands from 100 to 500 m, using PACS (100 and 160µm; Poglitsch et al. 2010) and SPIRE (250, 350 and 500µm; Griffin et al. 2010) in parallel mode. The lack of deep radio and 24 m data across the field restricts counterpart identification to optical (e.g. Sloan Digital Sky Survey [SDSS]; York et al. 2000) or near-IR data (e.g. VISTA Kilo-Degree Infrared Galaxy Survey [VIKING]; Sutherland et al. in prep, UKIRT Infrared Deep Sky Survey [UKIDSS]; Lawrence et al. 2007).
Smith et al. (2011) identified SDSS and GAMA galaxies as the counterparts to 37% of the SPIRE sources in the H-ATLAS SDP field. In the wider area of the whole GAMA-9 hour field Fleuren et al. (2012) increased the fraction of SPIRE sources with reliable identifications to 51% by using -band imaging from the VIKING survey. In the GAMA-15 hour field 50% of the SPIRE sources have reliable counterparts identified in Wide-Field Infrared Survey Explorer (WISE) data at 3.4 µm (Bond et al. 2012).
In this paper we cross-identify H-ATLAS SPIRE sources with Spitzer Infrared Array Camera (IRAC; Fazio et al. 2004a) galaxies, which are selected from 3.6 and 4.5-µm observations of 0.4 deg2 of the H-ATLAS SDP field. The IRAC data are advantageous for counterpart identification because of their mid-IR wavelengths and depth (3 magnitudes deeper than WISE). Thus, counterpart identification is less biased towards galaxies with relatively low redshifts or dust obscurations than the existing analyses.
The paper is organized as follows: the data analysis and sample selection are presented in Section 2. In Section 3 we describe the counterpart identification method and in Section 4 we discuss our results, including the identification rate and the colors and properties of SPIRE counterparts. Our conclusions are presented in Section 5. A table of the identified counterparts, including magnitudes and fluxes is presented in the Appendix. We use J2000 coordinates and CDM cosmology with = 0.27, = 0.73 and = 70 throughout. All photometry is on the AB magnitude system where = 23.9 mag; IRAC 3.6 and 4.5 m AB magnitudes are designated and , respectively.
2. Sample selection and data analysis
The H-ATLAS fields were chosen to minimize contamination from Galactic cirrus and to maximize the overlap with existing and planned wide-area imaging and spectroscopic surveys. The SDP field, which we study here, spans in the GAMA-9 hour field and has existing SDSS, VIKING, and UKIDSS data. It is observed with PACS at 100 and 160 m and SPIRE at 250, 350 and 500 m. The H-ATLAS PACS and SPIRE map-making processes are described in Ibar et al. (2010) and Pascale et al. (2011), respectively, and details of the source extraction procedures are given in Rigby et al. (2011). A public catalog of SDP sources is available from the H-ATLAS website222http://www.h-atlas.org. The data reach 5 point-source depths of 132, 126, 32, 36 and 45 mJy, with beam sizes of 8.7, 13.1, 18.1, 25.2 and 36.9″ (FWHM) at 100, 160, 250, 350, and 500 m, respectively. Although PACS 100 and 160 m data have significantly higher angular resolution than SPIRE data we do not use PACS data for counterpart identification because only five of the 159 SPIRE sources studied here are detected by PACS. In all five cases the position of the identified IRAC counterpart (table 2) is consistent with the PACS emission. Furthermore, the counterparts to all of these five sources are low-redshift late-type galaxies, which is consistent with expectations for galaxies that are detectable with PACS.
Spitzer IRAC 3.6 and 4.5 m staring mode observations of 0.4 deg2, in three regions of the H-ATLAS SDP field were carried out during the warm mission (Spitzer program 548; PI: A. Cooray). Two of the areas targeted contain bright SPIRE SDP sources that are now known to be gravitationally lensed (ID81 and ID130; Negrello et al. 2010; Hopwood et al. 2011) and the third area was chosen as a test field. In staring mode simultaneous observations at 3.6 and 4.5 m are offset from each other by 6.8′. Due to the offset, 0.22 deg2 of the targeted area has imaging data at both 3.6 and 4.5 m, and the remaining 0.18 deg2 is split between 3.6 and 4.5 m coverage. There are 159 SPIRE sources in the total IRAC footprint. Of these, 101 are observed at both 3.6 and 4.5 µm, and 30 (28) have only 3.6 m (4.5 m) data. The total exposure time is 1080 seconds per pixel in each filter. Data reduction and mosaicking is performed on the Corrected Basic Calibrated Data (cBCD) with Mopex (MOsaicker and Point source EXtractor; Makovoz & Marleau 2005). The final mosaicked images have 0.6″ 0.6″ pixels and the FWHM of the IRAC point spread function (PSF) at 3.6 and 4.5 m is 1.66 and 1.72″, respectively.
Our source detection and extraction procedure is designed to simultaneously select sources at 3.6 and 4.5 m, and provide equivalent photometry in both bands. The source detection is performed on a mean combined 3.6 and 4.5 m image. The 3.6 and 4.5 m image combination is carried out with Montage333http://montage.ipac.caltech.edu, which models background flux by co-adding and re-projecting background corrected images into a mosaic. Source detection is performed with SExtractor (Bertin & Arnouts 1996) and detected sources are required to comprise at least three contiguous pixels with fluxes at least 1.5 above the local background. There are 27170 unique 3.6 and 4.5 m sources that meet this requirement and that are detected at 5. Photometry is measured in 3.8″ diameter apertures with the apphot task in iraf. The advantage of apphot is that the photometry is measured in fixed apertures at specified source positions. The measured aperture photometry is corrected to “total” fluxes, assuming point-source profiles, and using the calibration derived by the SWIRE team for IRAC data with multiplicative correction factors of 1.36 and 1.40 at 3.6 and 4.5 m, respectively (Surace et al. 2005).
The completeness of the IRAC catalog is established by inserting artificial galaxies with a maximum half-light radius of 1.5″ in the IRAC images. Our source extraction and photometric procedure is repeated and a source is considered to be recovered if the extracted position and magnitude are within 1.5″ and 5, respectively, of the input values. The 50% completeness limits are 22.5 mag (3.63 Jy) and 22.2 mag (4.79 Jy) at 3.6 and 4.5 m respectively.
The far-IR emission detected by SPIRE traces emission from cold dust. Therefore, point sources in blank-field surveys, such as H-ATLAS, are primarily expected to be external galaxies and not stars in the Milky Way. Indeed, of the 6600 SPIRE sources in 14 deg2 in the H-ATLAS SDP field only 78 are Galactic stars, and two are candidate debris disks (Thompson et al. 2010). Since stars dominate the IRAC catalog at the brightest fluxes and have magnitude distributions that are different to galaxies, it is necessary to remove them prior to counterpart identification (e.g. Smith et al. 2011). Unfortunately the angular resolution of IRAC (FWHM 1.7) is insufficient to morphologically distinguish between stars and high-redshift galaxies. Furthermore, while stars can be identified in color-magnitude space (e.g. Eisenhardt et al. 2004) we are limited to just single IRAC band data for 45% of the total IRAC catalog.
Therefore, instead of using IRAC data alone to reliably identify stars, we make use of the stellar classification in SDSS. For this we match the IRAC catalog to SDSS DR7 (Abazajian, et al. 2009) using positional information. of IRAC sources are matched with SDSS catalog within search radius 1.5″. Out of total 27170 IRAC sources, there are 4239 (16%) sources that are classified as stars by SDSS. Once these are removed, the final IRAC catalog has 22931 galaxies. This catalog is used for the SPIRE source identification and subsequent analysis. We note that Fazio et al (2004b) showed that faint stars are a only minor contribution to the IRAC population, with mag-1 deg-2 for magnitudes fainter than 16 mag at both 3.6 and 4.5 m. Therefore, stars that are too faint to be detected as such by SDSS are not expected to affect our statistical analysis.
In addition, SDSS QSO population statistics (Schneider et al. 2007) indicate that only 2–3 QSOs are expected in the IRAC area ( in the counterpart search area around SPIRE centroids), and therefore the effect of QSOs on our statistics is also expected to be negligible. We conclude that the counterpart identification statistics are unlikely to be affected by unresolved source contamination in our input catalog.
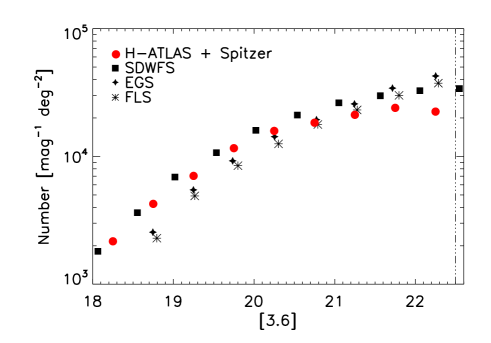
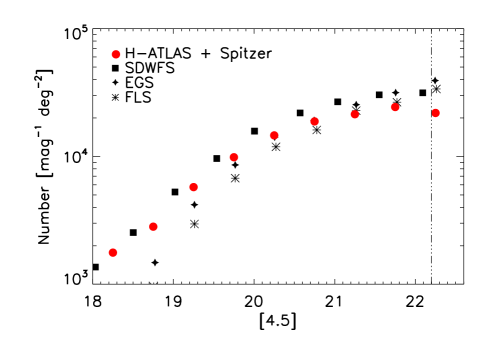
In figure 1 we compare the IRAC galaxy counts in H-ATLAS/Spitzer area with some of the previous IRAC deep and wide fields. H-ATLAS galaxy counts are more consistent with SDWFS (Ashby et al. 2009), although the variations between fields are likely to be due to cosmic aariance.
3. Spitzer IRAC identification of SPIRE sources
The size of the SPIRE beam is 18.1″ (FWHM) at 250 m, and 25.2 and 36.9″ at 350 and 500 m, respectively. The spatial density of IRAC-bright galaxies is high enough that multiple sources may lie within the SPIRE beam. Typically, this will include the true SPIRE counterpart and unassociated foreground and background galaxies. However, the surface density of 250- m bright sources is sufficient that a single SPIRE source may be composed of emission from multiple galaxies. Therefore, choosing the nearest object as the counterpart of a given SPIRE source can be misleading. Instead, we perform a likelihood ratio (LR) analysis (Section 3.1; Sutherland & Saunders 1992; Ciliegi et al. 2003; Brusa et al. 2007; Smith et al. 2011; Fleuren et al. 2012), which uses positional information and the magnitude distribution of counterparts and background sources, to identify SPIRE sources in the IRAC catalog. Furthermore, the LR analysis shows that galaxies associated with SPIRE sources occupy a distinct region of IRAC color-flux space (figure 4), which we use in Section 3.4 to identify additional counterparts.
We note that other statistical matching techniques have been used in astronomical implementations. For example, the corrected Poissonian probability (-statistic; Downes et al. 1986) uses the surface density to calculate the probability of a source with the observed magnitude being detected within the radius investigated (e.g. Ivison et al. 2002, 2007; Pope et al. 2006; Chapin et al. 2009). However, this technique is most appropriate for catalogues in which the surface density is low (e.g. radio data) and favors counterparts that are brighter than the background population. Our IRAC data do not have low-surface density, and we do not wish to assume that the Herschel counterparts are typically the brightest IRAC sources. Bayesian techniques (e.g. Budavari & Szalay 2008), which use a priori knowledge of the counterpart population to guide the identification process, could also be employed (e.g. Brand et al. 2006; Gorjian et al. 2008). However, we do not wish to bias our results by assuming a priori knowledge of the SPIRE population at IRAC wavelengths. The LR analysis is advantageous because it computes the intrinsic IRAC magnitude distribution of the SPIRE sources from the data provided (see e.g. Fleuren et al. 2012).
3.1. The Likelihood Ratio method
The LR, , is the ratio of the probability that the IRAC source is the correct SPIRE counterpart with the equivalent probability for an unassociated background source. Following Sutherland & Saunders (1992), is calculated as:
| (1) |
where and are the normalized magnitude distributions of counterparts and background sources, respectively. The radial probability distribution of the separation between the SPIRE 250 m and IRAC positions is denoted by .
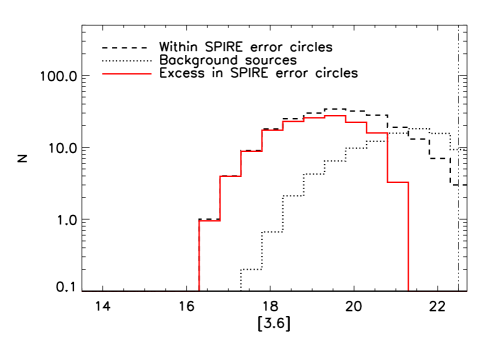
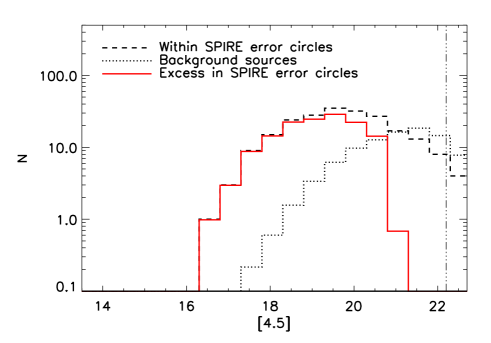
We estimate , the normalized magnitude distribution of background sources, by averaging the source counts in areas of circle within 7.2″ radius of 100 different realizations of 159 random positions. The radius is three times the positional uncertainty of the SPIRE catalog. We use 2.4 0.9″ (Smith et al. 2011) calculated in the H-ATLAS SDP field from the positional offsets between SDSS DR7 galaxies and 6621 SPIRE sources. The center of each random circle is required to be at least 15″ away from the nearest SPIRE centroid to minimize possible contamination of real association. The quantity , the normalized magnitude distribution of true IRAC counterparts to SPIRE sources cannot be directly derived. We empirically estimate by first subtracting the magnitude distribution of background galaxies from the magnitude distribution of all IRAC sources within search radius.
This results in an estimate of the magnitude distribution of sources that are in excess of the background, , and assumed to be the true counterparts to SPIRE sources, Then is calculated via:
| (2) |
where is the fraction of true counterparts above the IRAC detection limit. The and distributions of and are shown in figure 2.
The radial probability distribution, , is given by
| (3) |
where is the separation between the SPIRE 250 m and IRAC centroids, and is the positional uncertainty of the SPIRE catalog. The median 250 µm signal-to-noise ratio of the SPIRE sources in our sample is 6.33 and only 43 (27%) have SNR. Therefore, we ignore the improvement in for sources with high signal-to-noise ratio (Smith et al. 2011).
Each H-ATLAS source may have several potential counterparts. Therefore, we calculate the reliability, , of each IRAC galaxy, , in SPIRE counterpart search radius. is the probability that the galaxy, , is the correct IRAC counterpart to the SPIRE source. Following Sutherland & Saunders (1992):
| (4) |
where represents each IRAC source in the search radius.
To accept a potential counterpart as reliable we require that 0.8, i.e. there is 20% chance of a false association. This criterion was used by Smith et al. (2011) for the counterpart search with SDSS data and our results on the identification rate with IRAC data can be directly compared to their results based on optical imaging. We note that the choice of the exact limiting value of does not strongly affect our conclusions. Of the 123 SPIRE sources with 0.8 counterparts (section 3.3) 107 (87%) have 0.9, and 101 (82%) have 0.95.
For a catalog in which identified sources are required to have 0.8 the overall false detection rate is
| (5) |
3.2. calculation
In order to apply the LR method to the SPIRE and IRAC catalogs we must first compute . Smith et al. (2011) calculated from the total number of SDSS galaxies in the error circles of SPIRE sources. However, this method requires some a priori chosen radius and is only valid if each SPIRE source is associated with only one SDSS galaxy. Instead, we make use of an alternative method, derived by Fleuren et al. (2012), which is radius independent and unaffected by the clustering of IRAC sources. Clustering can be a significant complication because SPIRE sources are expected to reside in overdense regions similar to environments of sub-mm galaxies (e.g. Aravena et al. 2010b; Hickox et al. 2012).
For the purposes of this discussion we define a SPIRE error circle without a true IRAC counterpart as a “blank”. Directly observed blanks arise due to counterparts below the IRAC detection limit or beyond the search radius, . However, the total number of blanks must also be statistically corrected for contamination by unassociated foreground or background galaxies. Thus, the true number of blanks () is equal to the number of observed SPIRE blanks () and the number of SPIRE sources that are falsely matched with random background galaxies. We define as the number of random positions that contain a IRAC galaxy while is the number of random blanks. Then,
| (6) |
with and calculated from 100 random realizations of error circles, which are all located at least 15″ away from SPIRE centroids.
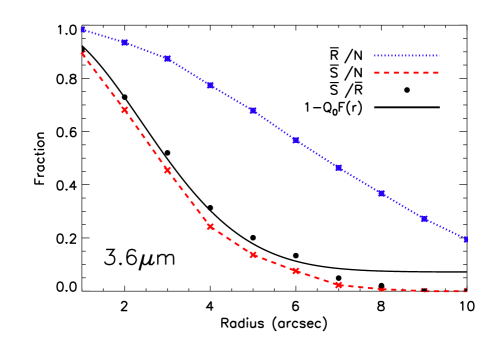
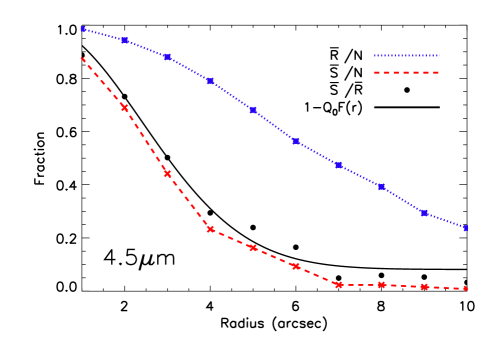
is defined as the fraction of true counterparts above the IRAC detection limit. Thus, for an infinite search radius, the rate of true blanks, is simply equal to . Fleuren et al. (2012) demonstrate that equation 6 can be rearranged to show that , and thus .
However, there is also the possibility that the true counterpart is outside of the examined area and this must be accounted for in the estimate. The probability that the real SPIRE source is outside the search radius can be derived analytically from the normalized SPIRE source distribution, (equation 3). This probability, , is
| (7) |
where (Fleuren et al. 2012). Assuming that the probability of a SPIRE source being a true blank () and the probability that the detected counterpart is outside of the search radius () are independent, it can be shown that the total probability that there is no counterpart is (see Fleuren et al. 2012)
| (8) |
However, we have already shown that . Thus, using the observables and one can calculate via . Figure 3 shows , , and , observed for search radii of one to 10″. We calculate the constant, , by fitting to . minimization yields 0.93 0.09, 0.92 0.08 at 3.6 and 4.5 m, respectively.
| Method | a | b | ID ratec | d | e | Contamination rate |
|---|---|---|---|---|---|---|
| LR | 159 | 123 | 77% | 123 | 0 | 1.9% |
| Color-magnitude | 19 | 13 | 68% | 23 | 7 | 12.6% |
| Total | 159 | 136 | 86% | 146 | 7 | 3.6% |
3.3. LR counterparts
We apply the LR technique outlined in section 3.1 and 3.2 at 3.6 and 4.5 m, to identify IRAC counterparts to 123 of 159 H-ATLAS SPIRE sources (Tables 1 and 2). and are calculated in a radius of 3 7.2″ (although is radius independent; section 3.2) and only IRAC galaxies within 7.2″ of SPIRE sources are considered to be potential counterparts. This limit includes 99.7% of true counterparts, whilst minimizing the potential contamination from unassociated sources. The analysis is performed separately at 3.6 and 4.5 m and any IRAC galaxy with 0.8 at either wavelength is considered to be a SPIRE counterpart. In addition, where both 3.6 and 4.5 m data is available we combine the probabilities () from each wavelength, and include five counterparts that have a combined probability of being considered to be reliable identifications 0.8, but have 0.8 at 3.6 and 4.5 µm individually. All 123 counterparts are presented in table 2, including 81 galaxies with both 3.6 and 4.5 m photometry. The false identification rate is 1.9% or approximately two sources (equation 5); in the case of counterparts that are identified at both 3.6 and 4.5 m we use the highest of the two in this calculation.
The identification rate of 77% is significantly higher than that from optical (37% in SDSS; Smith et al. 2011) or near-IR analyses (51% in VIKING; Fleuren et al. 2012) of H-ATLAS sources. This difference is likely to be primarily driven by the wavelengths of the study, which are less sensitive to -correction and dust absorption than optical data.
The counterpart identification rate is also significantly higher than the 50% obtained with WISE 3.4-µm data (Bond et al. 2012); this is true even if we only consider the 3.6 µm data, where 97 of the 129 SPIRE sources with 3.6 µm coverage (75%) are identified. WISE is shallower than our IRAC observations – 19.7 mag at 3.4 µm compared to 22.5 mag at 3.6 µm in IRAC. However, 79% of the 3.6-µm identified counterparts have 19.7 mag, suggesting that IRAC data to this depth would identify counterparts to 60% of SPIRE sources. The remaining difference in the IRAC and WISE identification rates is likely to be due to the resolutions of the instruments – the WISE 3.4 µm beam is times larger than IRAC – although Cosmic Variance may also contribute. We note that if instead the data were limited to 20.5, corresponding to the 5 point-source detection limit reached in a 120 sec integration with IRAC at 3.6 m, the expected identification rate drops from 77% to 70%.
The results presented here are insensitive to the exact value of . When using a 1 lower value for (i.e. 0.84 at both 3.6 and 4.5 µm), and comparing to the results presented in section 3.3 and table 2, the counterparts to 116 sources (95%) are unchanged. In this case there are four (3%) previously identified sources that no longer have reliable counterparts, and three (2%) previously unidentified SPIRE sources that now have 0.8 counterparts.
3.4. Counterparts identified in IRAC color-magnitude space
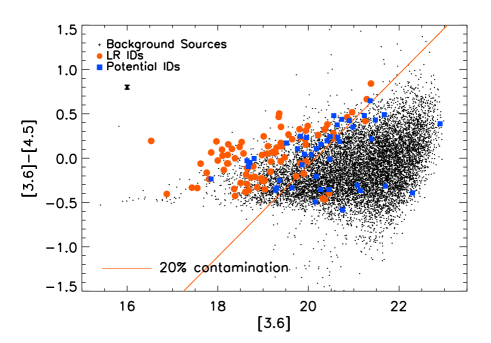
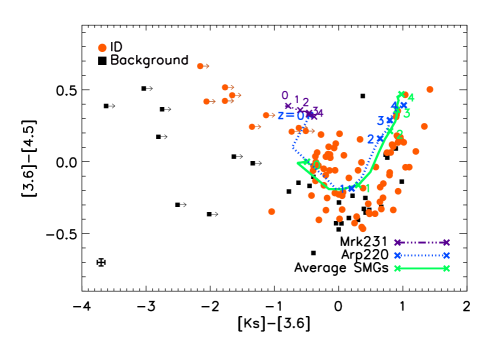
While we reliably identify 77% of the SPIRE sources with the LR method, the values of indicate that 90% of SPIRE counterparts are detected in IRAC. Figure 4 shows the IRAC color-magnitude diagram for galaxies in the H-ATLAS SDP field, with SPIRE counterparts identified with the LR method highlighted. These galaxies occupy a distinct region of IRAC color-magnitude space – they typically have 0.4 and are brighter than the background population. We use this property to identify counterparts to the SPIRE sources that have both 3.6 and 4.5- m IRAC coverage but no 0.8 counterparts from the LR method. A similar analysis was performed by Biggs et al. (2011) at 3.6 and 5.8-µm to identify to LABOCA 870- m sources.
We begin by determining the region of color-magnitude space in which there is a minimal chance of contamination by background sources (the ID region). A 20% contamination limit is used because this equivalent to 0.8 for the LR method. We demarcate the ID region with the simplest reasonable function – a single diagonal line. The placement of the line is determined by calculating the gradients and intercepts that would yield 20% contamination from background sources within 7.2″ radius of the LR counterparts. The number of LR counterparts returned is maximized to yield a best-fit gradient of for a line that intercepts 16.0 mag at 2.142. This division is shown as a solid line in figure 4. IRAC galaxies that lie above this line and are within 7.2″ of SPIRE sources that are otherwise unidentified, have 80% probability of being physically associated with the SPIRE source, i.e., 20% chance of being an unrelated foreground or background galaxies, and are considered counterparts.
There are 36 SPIRE sources that do not have LR counterparts. Of these 19 have both 3.6 and 4.5 µm data, and 23 IRAC counterparts to 13 of these sources are identified with the color-magnitude method (seven have multiple counterparts). These sources are presented in table 2. The contamination rate for this method is 12.6% (approximately two IRAC galaxies), calculated by summing the probabilities of finding a background galaxy within 7.2″ of a SPIRE source occupying a distinct region of color-magnitude space.
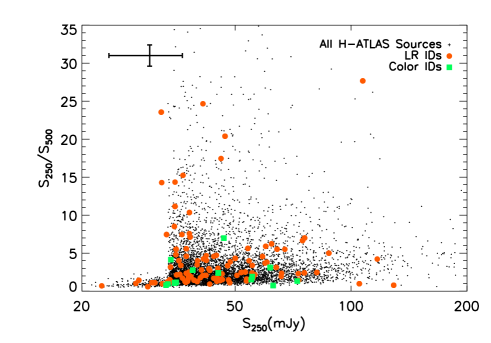
In figure 4 we show the color-flux plot for H-ATLAS SDP sources and consider whether sources with identified IRAC counterparts are representative of the whole SPIRE population. A 2D Kolmogorov-Smirnov (KS) test between the background H-ATLAS SPIRE population and the sources with identified counterparts has 0.172, suggesting that the two samples are drawn from similar, but not necessarily identical, parent populations. Considering the color and 250 µm fluxes separately yields and , respectively. Thus we conclude that the sources with identified IRAC counterparts are very similar to the whole SPIRE population, but may have a slightly different distribution of 250 µm flux.
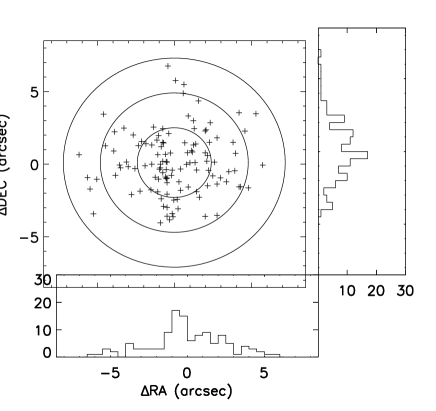
3.5. Astrometric offset
To check whether there is any noticeable astrometric shift among the input catalogs for LR analysis, in figure 5 we plot the positional differences between the SPIRE sources and the corresponding IRAC counterparts. The median separation between SPIRE and IRAC sources is 0.10″. We also investigate the overall astrometric reference frame difference between IRAC and SDSS catalogs, using 40% of the IRAC sample that is also identified with SDSS galaxies within in 2′′. The positional difference between IRAC and SDSS is 0.19 0.17″and we found no systematic offset either in RA or Dec.
Our IRAC data are complemented with VIKING and -band photometry, which is measured in 2″ diameter apertures (Sutherland et al. in prep). We cross-match the IRAC (FWHM 1.6″) to the nearest neighbor VIKING (FWHM 0.9″) source within 2″ search radius. Indeed, the mean offset between the IRAC and VIKING positions is 0.09 0.50″ and 0.28 0.28″ in RA and Dec, respectively. We find no statistically significant astrometric error between two catalogs.
4. Discussion
As described in sections 3.3 and 3.4 we identified IRAC counterparts to 136 (86%) of the SPIRE sources. 123 of these are identified with the LR method and 23 counterparts to 13 SPIRE sources are identified with the color-magnitude method (Table 1). The contamination rate of 1.9% for the LR method is smaller than that from the color-magnitude method (12.6%) but corresponds to a similar number of IRAC galaxies – two to three. Combining the results from the two identification methods, we expect that the total false identification rate of the catalog presented in Table 2 is 3.6%, such that five to six of the IRAC counterparts presented in table 2 are false.
4.1. Statistics of Identified Sources
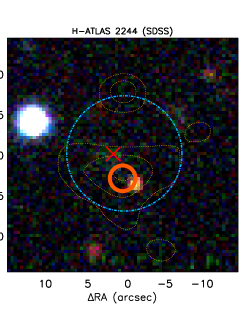
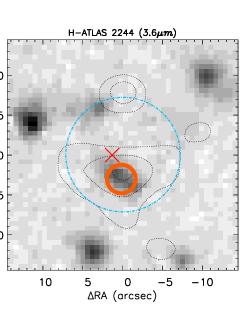
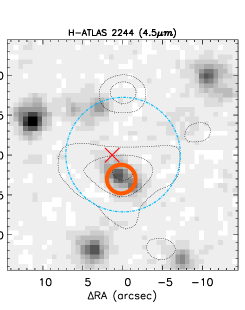
We next compare the counterparts identified in the IRAC data with results based on SDSS (Smith et al. 2011). Of the 146 IRAC counterparts, 102 (70%) are undetected in SDSS, 52 (36%) agree with the SDSS identification, and two (1%) are different galaxies to the SDSS counterparts. On the basis of the false-identification rates of the two studies (4.2% for SDSS and 3.6% for IRAC) approximately four counterparts are expected to disagree between the two surveys, which is consistent with that observed here.
The two sources with different counterparts identified in IRAC and SDSS are H-ATLAS ID-2244 and 6962. We show one of these sources, H-ATLAS ID-2244, as an example in figure 6. In this case the SDSS (SDP.2244) and IRAC (H-ATLAS ID-2244) counterparts are separated by 3.2″ and both have a 3% probability of being false identifications: 0.97 in SDSS and 0.99 at both 3.6 and 4.5 µm. In the absence of additional data, such as sub-mm or radio interferometry, the true nature of this source is unclear. It is possible that one of the counterparts is a chance association, although we cannot say which one. It is also possible that the SPIRE source is comprised of a blend of emission from both counterparts in a single SPIRE beam.
Blending is also an important consideration for counterparts that are identified with the color-magnitude method. Seven of the 13 SPIRE sources identified with this method have multiple IRAC counterparts; conversely the LR method has none. This apparent disparity is not surprising because the LR method implicitly assumes that each SPIRE source has a single IRAC counterpart. Where there are multiple counterparts contributing equally to the sub-mm flux the average cannot exceed , and will typically be . Due to the large SPIRE beam (FWHM = 18.1″ at 250 m) it is likely than in at least a few cases a single SPIRE source may be composed of blended emission from multiple galaxies or from galaxy interactions. The color-magnitude method does not consider the presence of other IRAC sources and is therefore not biased against multiple counterparts. In addition, beyond requiring that counterparts to lie within the SPIRE counterpart search radius, the color-magnitude method does not consider the separation between the SPIRE and IRAC centroids and therefore it is not biased against wide-separation counterparts. However, it does require both 3.6 and 4.5 m fluxes and it assumes that all SPIRE sources have a similar color-magnitude distribution at 3.6 and 4.5 m.
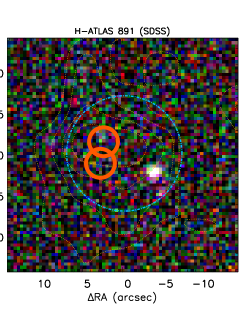
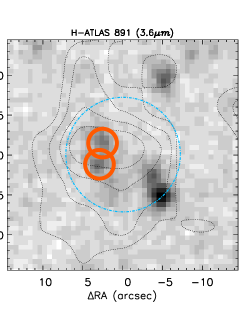
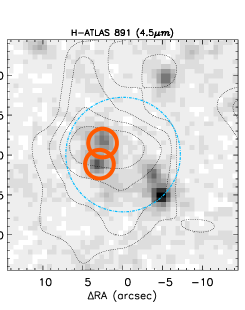
The seven SPIRE sources in the sample that have multiple IRAC counterparts are likely to be a combination of blended SPIRE sources and individual sub-mm galaxies associated with multiple interacting IRAC sources. H-ATLAS ID-891 is shown as an example in figure 7. In this case all the detected SDSS galaxies are away from the SPIRE centroid and all have 0.8 (Smith et al. 2011). There are two potential counterparts in the IRAC data that are not detected in SDSS. Using the LR method alone these two nearby sources have reliability of 0.41 and at 3.6 m and 0.47 and 0.50 at 4.5 m. However, both galaxies have and that place them in the region of color-magnitude space with 20% probability of being random associations with the SPIRE emission and as such they are both identified as counterparts. The two galaxies have similar colors, with 0.38 and 0.43 mag, consistent with a redshift of 1.4 (Papovich 2008). The two IRAC sources are separated by 2.9″ (24.9 kpc at 2, 23.0 kpc at 3. Furthermore, the SPIRE source is bright ( 84 9mJy) and red in the sub-mm bands, with a rising spectrum from 250 to 500 m, indicating a sub-mm photometric redshift of 3 (e.g. Lapi et al. 2011), although we caution that the dust temperature and redshift are degenerate in the sub-mm bands. It is likely that H-ATLAS ID-891 is a blend of emission from the two identified counterparts and it is possible that the sub-mm emission is the result of a merger or interaction of two gas-rich galaxies (e.g. Aravena et al. 2010b). Spectroscopic data are required to verify this scenario. and we identify ID-891 as a target for additional follow-up, especially to identify the exact nature of the sub-mm emission.
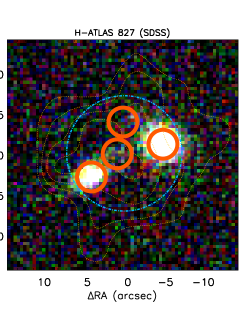
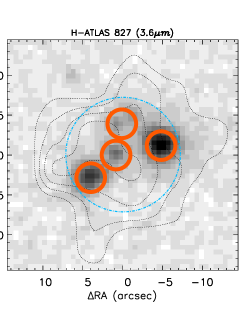
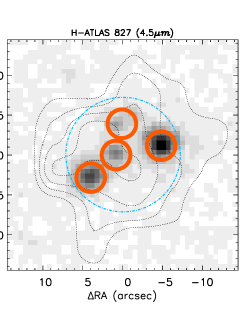
H-ATLAS ID-827, shown in figure 8, is the most complex system in our sample. In this case there are four IRAC counterparts identified on the basis of their colors and magnitudes. The four galaxies have a wide range of with values from 17.8 mag to 20.2 mag. The counterparts do not appeared to be clustered, as may be expected for gravitational lensing or a multi-component interaction, and each is separated from its nearest neighbor by 4″. The two brightest galaxies are detected by SDSS, but were not identified as SPIRE counterparts by Smith et al. (2011); they have photometric redshifts of 0.07 0.01 and 0.20 0.03 for the westernmost and easternmost, respectively. The two fainter counterparts are not detected in SDSS and both have 0, indicating that they are likely to be at 1.4 (Papovich 2008). The morphology, astrometry and available redshift information suggests that gravitational lensing in unlikely and that H-ATLAS ID-827 is most likely to be a blended source, which is comprised of two low-redshift and two high-redshift components.
4.2. Redshifts of Identified Sources
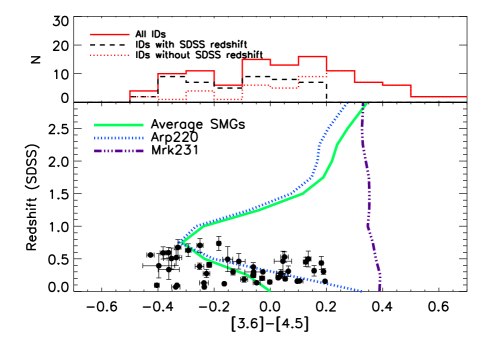
Knowledge of the redshift distribution of SPIRE sources is central to understanding their role in the Universe. However, only 50% of the IRAC counterparts are detected in SDSS and 74% have VIKING photometry. Therefore, any redshift distribution derived from the optical data will be biased to low redshifts where the detection rates in these surveys are high. Instead, in figure 9 we plot the color distribution, and against redshift for the counterparts with spectroscopic or photometric redshift from SDSS. This plot includes the 104 IRAC counterparts that have both 3.6 and 4.5 m coverage, 47 of which have an optical redshift. All of the optical redshift are 0.8; 32 (68%) of these galaxies have 0, while 15 (32%) have 0. The 57 identifications without reliable redshifts from the optical are undetected in SDSS and 43 of them have 0, a crude indicator that (e.g. Papovich 2008). Thus, up to 40% of the identified SPIRE population may lie at high redshifts. Deep spectroscopy and photometry, particularly at near-IR wavelengths, is required to determine more precise redshift information.
We also investigate the redshift distribution of the SPIRE sources by calculating sub-mm photometric redshifts from the fluxes of the three SPIRE bands. We employ a template fitting method which uses minimization, comparing the observed fluxes to the SEDs of Arp 220 (Silva et al. 1998), Mrk 231 (Berta 2006). We caution that the sub-mm photometric redshifts are limited by the absence of longer wavelength data, and the degeneracy between redshift and dust temperature. Furthermore, flux boosting is an important consideration and will add significant errors to the fluxes of the faintest sources. Due to these uncertainties, we do not consider the sub-mm photometric redshifts on a source-by-source basis, but instead examine the overall distribution.
This sub-mm photometric redshift distribution peaks at with a tail out to 4, and suggests that the majority of the IRAC counterparts without SDSS redshifts lie at . This result is consistent with the photometric redshifts of the whole SPIRE population (e.g. Amblard et al. 2010; Lapi et al. 2011) and the redshift distribution of 850 m sources (e.g. Chapman et al. 2005; Wardlow et al. 2011). Now that the counterparts to a significant majority of SPIRE sources are known, follow-up spectroscopic campaigns to establish the redshifts of all the sources are feasible.
4.3. Properties of Identified Sources
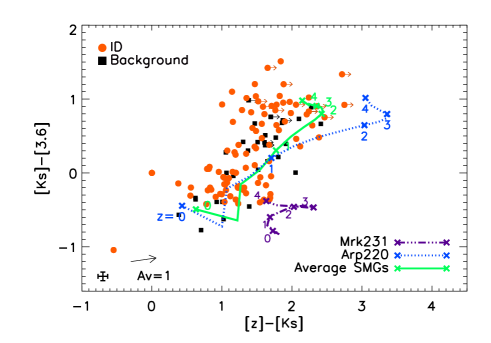
Near-IR Colors: In figure 10 we show IRAC and VIKING color-color diagrams, highlighting identified SPIRE counterparts in comparison with background sources that are within 7.2″ of the SPIRE centroids. As we show in figure 4 the SPIRE counterparts have distinct color compared to the background sources, but the two populations are indistinguishable in and . We also compare to the redshift tracks of Arp 220 (Silva et al. 1998), Mrk 231 (Berta 2006) and the average 870- m selected sub-mm galaxy (Wardlow et al. 2011). The SPIRE counterparts are slightly bluer than both these tracks suggesting that they may have less dust reddening and values that are 0.5 to 1 magnitudes smaller than the SED templates.
IR Luminosities and Dust Temperatures: To understand properties of the identified H-ATLAS/IRAC galaxies associated with SDSS redshifts, we first consider a SED analysis of the SPIRE data making use of the redshifts based on the IRAC identification. First we consider the far-IR/sub-mm portion of the SED with 3-band SPIRE fluxes at 250, 350, and 500 m and reproduce the analysis of Amblard et al. (2010) where the dust temperature () and IR luminosities were studied. We make use of a modified black-body with isothermal dust temperature to describe the dust emission, in which flux can be written as
| (9) |
To be consistent with previous other estimates from the literature we fix and fit to the SPIRE fluxes to establish the dust temperature and the overall normalization to the SED. The IR luminosity is estimated from the best-fit SED over the wavelength range of 8 to 1100 m. Since we only fit to the dust emission at wavelengths greater than 250 m our luminosities are likely low by a factor of 2 to 3 if there are any warm dust, heated by AGNs, present in these galaxies. However, our overall uncertainty on the IR luminosity estimates is at least a factor of 5. For the sample as a whole we find an average dust temperature of 26 9 K, which compares well with the average dust temperature of 27 8 K for 0.1 SPIRE galaxies based on SDSS identifications only (Amblard et al. 2010).
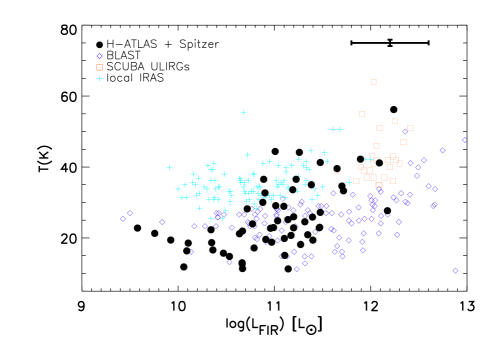
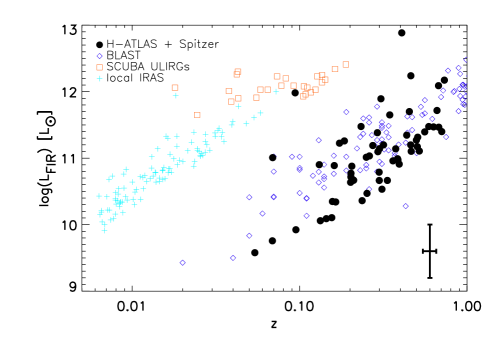
We summarize our results related to the FIR SED analysis in figure 11 where we show the - relation and the as a function of the redshift, determined from the reliable H-ATLAS IDs with either SDSS spectroscopic or photometric redshift. We also compare the H-ATLAS dust temperatures and IR luminosities with sub-mm bright galaxy samples in the literature. Samples include the sources in BLAST with COMBO-17 (Wolf et al. 2004) or a SWIRE photometric redshift (Rowan-Robinson et al. 2008) and Spitzer-MIPS 70 and 160 m fluxes (Dye et al. 2009), local ULIRGS observed with SCUBA at 450 and 850 m (Clements et al. 2010), and local IRAS-selected galaxies with 60 and 100 m fluxes along with SCUBA 850 m (Dunne et al. 2000).
In figure 11 we find that the SPIRE-selected galaxies in H-ATLAS with IRAC-based identifications for redshifts span the luminosity range of 1010 to 1012 from sub-LIRG luminosities to ULIRG conditions. These luminosities and the ranges are comparable to BLAST-detected sources, while they span lower than the local IRAS-selected galaxies, which tend to be at lower redshifts and have higher luminosities; such a difference is understandable since IRAS is an all-sky shallow survey and detects primarily the rare, bright galaxies in the near-by universe.
Stellar Masses and Star-Formation Rates: With the cross-identification we can expand the SED analysis over 3 orders of magnitude in wavelength from optical to sub-mm. For optical and near-IR data we make use of SDSS, UKIDSS (Lawrence et al. 2007), VIKING (Sutherland et al. in prep), and IRAC 3.6 and 4.5 m fluxes. The analysis of full optical to sub-mm SEDs is similar in spirit to Dunne et al. (2011) where the SEDs of SPIRE sources with reliable identifications using SDSS data were analyzed. We make use of the MAGPHYS SED modelling code (da Cunha, Charlot & Elbaz 2008) for this work. The SED modelling in the code is done in a energy-balance manner such that the absorbed light in shorter UV and optical wavelengths is accounted for by the thermal re-radiation at far-infrared and sub-mm wavelengths. For the H-ATLAS/IRAC galaxy sample we have 5 optical fluxes from SDSS (), 5 near-IR fluxes from UKIDSS+VIKING (), and 2 IRAC channels (3.6, 4.5 m), in addition to 3 SPIRE bands. Redshift information of the sources are from SDSS spectroscopic observations (0 - 0.8).
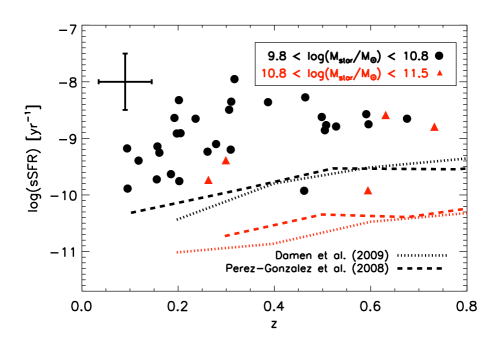
For comparative work with other sub-mm galaxy samples we focus on results related to stellar mass and star-formation rate (SFR), as given by MAGPHYS best-fit models. In figure 12 (top figure) we plot the specific star-formation rate (sSFR) given as SFR/ vs. redshift with our sample sub-divided to two stellar mass bins. We find that the sSFR of IRAC IDs marginally show an anticorrelation with galaxy stellar mass. Such a behavior may be related to the downsizing scenario (Cowie et al. 1996).
However, when compared to Damen et al. (2009) and Pérez-Gozález et al. (2008), IRAC IDs shows 0.4 0.5 dex higher sSFRs. The Damen et al. (2009) galaxy sample is an IRAC-selected sample of galaxies out to 1.8 in ECDFS with photometry supplemented with optical, near-IR, and MIPS 24 m fluxes. The Pérez-Gozález et al. (2008) sample is selected with IRAC at 3.6 and 4.5 m in a variety of fields. While our SPIRE-selected sample has IRAC identifications, they are not likely to be the majority of the galaxies in both these studies. This is also clear from figure 4 where we show that most of the identified SPIRE sources are distributed differently from the background population in the color-magnitude space. They occupy the top-end of the star-formation in galaxies selected at near-IR wavelengths.
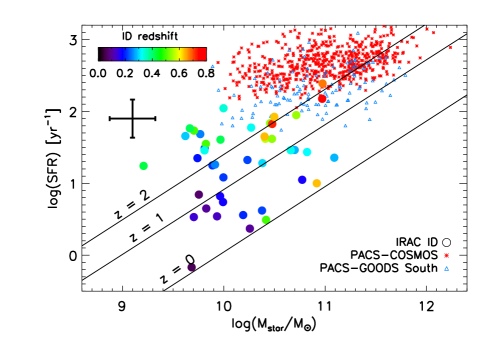
In Fig. 12 (bottom) we plot the SFR vs. the stellar mass of our sample. The SFR of normal local star-forming galaxies at is known to correlate strongly with the stellar mass and form the so-called star-formation main-sequence (Brinchmann et al. 2004; Salim et al. 2007; Peng et al. 2010). Such a correlation is also observed at higher redshifts, albeit with a different normalization (e.g. Daddi et al. 2007; Elbaz et al. 2007; Noeske et al. 2007; Pannella et al. 2009; Daddi et al. 2009; Gonzalez et al. 2010; Rodighiero et al. 2010; Karim et al. 2011). However, the typical dispersion of correlation is known to be 0.3 dex over a wide range of redshifts 0 2.
Local (U)LIRGs and high-redshift SMGs have SFRs in excess of the main-sequence and are defined as starburst galaxies (e.g. Elbaz et al. 2007, 2011). These galaxies generally occupy a region that is 10 above the main-sequence. However, there is also evidence that some high-redshift (U)LIRGs and SMGs do not have enhanced star-formation rates relative to their stellar mass and that the starburst fraction may decrease at high redshifts (e.g. Tacconi et al. 2008; Rodighiero et al. 2011). This suggests changes to the mode of star-formation in (U)LIRGs between 0 and 2 away from the starburst mechanism (e.g. Daddi et al. 2010b; Genzel et al. 2010; Elbaz et al. 2011; Krumholz et al. 2012; Melbourne et al. 2012). In our work, 50% of the subsample of IRAC-identified SPIRE galaxies ( 1) lie near the starburst region. Thus, it is possible that half of the IRAC-identified SPIRE galaxies with SDSS redshifts are in fact starbursts that lie off the main-sequence.
5. Summary
We have identified Spitzer-IRAC counterparts to sources selected with Herschel-SPIRE at 250 m in the H-ATLAS survey. Among 159 SPIRE centroids, we found 123 reliable IRAC counterparts using a likelihood ratio analysis. The identified SPIRE sources are distributed differently in IRAC color-magnitude space compared to the field population. Therefore, we made an additional selection based on the IRAC ID locality to yield a further 23 counterparts to 13 SPIRE sources. Seven SPIRE sources have multiple IRAC counterparts. These are likely to be due to blended emission in the SPIRE beam.
In total 146 reliable IRAC counterparts to 136 SPIRE sources were identified, including seven that have more than one IRAC counterpart. The identification rate of 86% is higher than that of wide-field ground-based optical and near-IR imaging of Herschel fields. The galaxies with unknown redshifts and that are not detected in SDSS and VIKING imaging data have SPIRE colors indicative of high redshift sources and 0, suggesting that they are likely to be at 1.4. We estimate the 40% of SPIRE sources lie at high redshifts, although the exact redshift distribution of SPIRE sources remains elusive. The counterparts presented here can now be pursued for followup data to further investigate the nature of SPIRE galaxies. The majority of our detected galaxies with sub-LIRG to LIRG luminosities are not intense starbursting galaxies in the local universe, though they have above average specific star-formation rates.
References
- (1) Abazajian, K. N. et al. 2009, ApJS, 182, 543
- (2) Amblard, A. et al. 2010, A&A, 518, L9
- (3) Aravena, M. et al. 2010a, ApJ, 708, L36
- (4) Aravena, M. et al. 2010b, ApJ, 719, 15
- (5) Ashby, M. L. N. et al. 2009, ApJ, 701, 428
- (6) Austermann, J. E. et al. 2010, MNRAS, 401, 160
- (7) Barmby, P. et al. 2008, ApJS, 177, 431
- (8) Berta S. 2006, PASP, 118, 754
- (9) Bertin, E. & Arnouts, S. 1996, A&AS, 117, 393
- (10) Biggs, A. D. et al. 2011, MNRAS, 413, 2314
- (11) Blain, A. W., Smail, I., Ivison, R. J., Kneib, J.-P. & Frayer, D. T. 2002, Physics Reports, 369, 111
- (12) Bond, N., et al. 2012, ApJL, 750, 18L
- (13) Borys, C., et al. 2004, MNRAS, 355, 485
- (14) Brandon, K., et al. 2006, ApJ, 641, 140
- (15) Brinchmann, J., et al. 2004, MNRAS, 351, 1151
- (16) Brusa, M., et al. 2007, ApJS, 172, 353
- (17) Budavári, T. & Szalay, A. 2008, ApJ, 679, 301
- (18) Chapin, E., et al. 2009, MNRAS, 398, 1793
- (19) Chapman, S. C., Blain, A. W., Ivison, R. J., & Smail, I. 2003, Nature, 422, 695
- (20) Chapman, S. C., Blain, A. W., Smail, I., & Ivison, R. J. 2005, ApJ, 622, 772
- (21) Chen, C.-C., et al. 2011, ApJ, 733, 64
- (22) Ciliegi, P., et al. 2003, A&A, 398, 901
- (23) Clements, D. L., et al. 2008, MNRAS, 387, 247
- (24) Clements, D. L., Dunne, L., & Eales, S. 2010, MNRAS, 403, 274
- (25) Condon, J J., et al. 1998, AJ, 115, 1693
- (26) Coppin, K., et al. 2006, MNRAS, 372, 1621
- (27) Cowie, L. L., et al. 1996, AJ, 112, 839
- (28) Cowie, L. L., et al. 2009, ApJ, 697, L122
- (29) da Cunha, E., Charlot, S., & Elbaz, D. 2008, MNRAS, 388, 1595
- (30) Daddi, E., et al. 2007, ApJ, 670, 156
- (31) Daddi, E., et al. 2009, ApJ, 694, 1517
- (32) Daddi, E., et al. 2010, ApJ, 714, 118
- (33) Damen, M., et al. 2009, ApJ, 690, 937
- (34) Downes, D., et al. 1999, A&A, 347, 809
- (35) Driver, S., et al. 2011, MNRAS, 413, 971
- (36) Dunlop, J. S., et al. 2010, MNRAS, 408, 2022
- (37) Dunne, L., Eales, S., Edmunds, M., et al. 2000, MNRAS, 315, 115
- (38) Dunne, L., et al. 2011, MNRAS, 417, 1510
- (39) Dwek, E., et al. 1998, ApJ, 508, 106
- (40) Dye, S., et al. 2008, MNRAS, 635, 1107
- (41) Dye, S., et al. 2009, ApJ, 703, 285
- (42) Eales, S., et al. 1999, ApJ, 515, 518
- (43) Eales, S., et al. 2010, PASP, 122, 499
- (44) Eisenhardt, P. R., et al. 2004, ApJS, 154, 48
- (45) Elbaz, D., et al. 2007, A&A, 468, 33
- (46) Elbaz, D., et al. 2011, A&A, 533, 119
- (47) Fazio, G. G., et al. 2004a, ApJS, 154, 10
- (48) Fazio, G. G., et al. 2004b, ApJS, 154, 39
- (49) Fixsen, D. J., Dwek, E., Mather, J. C., Bennett, C. L., & Shafer, R. A. 1998, ApJ, 508, 123
- (50) Fleuren, S., et al. 2012, MNRAS, accepted (arXiv:1202.3891)
- (51) Garrett, M. A. 2002, A&A, 384, 19
- (52) Gear, W. K., et al. 2000, MNRAS, 316, 51
- (53) Genzel, R., et al. 2010, MNRAS, 407, 209
- (54) González, V., et al. 2010, 713, 115
- (55) Gorjian, V., et al. 2008, ApJ, 679, 1040
- (56) Griffin, M. J., et al. 2010, A&A, 518, L3
- (57) Hatsukade, B., et al. 2010, ApJ, 711, 974
- (58) Hopwood, R., et al. 2011, ApJ, 728, L4
- (59) Hughes, D. H., et al. 1998, Nature, 394, 241
- (60) Ibar, E., et al. 2010, MNRAS, 409, 38
- (61) Iono, D., et al. 2006, ApJL, 640, L1
- (62) Ivison, R. J., et al. 1998, ApJ, 494, 211
- (63) Ivison, R. J., et al. 2002, MNRAS, 337, 1
- (64) Ivison, R. J., et al. 2004, ApJS, 154, 124
- (65) Ivison, R. J., et al. 2007, MNRAS, 380, 199
- (66) Ivison, R. J., et al. 2008, MNRAS, 390, 1117
- (67) Karim, A., et al. 2011, ApJ, 730, 61
- (68) Krumholz, M., et al. 2012, ApJ, 745, 69
- (69) Lapi, A., et al. 2011, 742, 24
- (70) Lawrence, A., et al. 2007, MNRAS, 379, 1599
- (71) Lutz, D., et al. 2011, A&A, 532, A90
- (72) Makovoz, D., & Marleau, F. R. 2005, PASP, 117, 1113
- (73) Matsuda, Y., et al. 2007, ApJ, 667, 667
- (74) Melbourne, J., et al. 2012, AJ, 143, 125
- (75) Negrello, M., et al. 2010, Science, 330, 800
- (76) Noeske, K. G., et al. 2007, ApJL, 660, L43
- (77) Pannella, M., et al. 2009, ApJ, 701, 787
- (78) Papovich, C. 2008, ApJ, 676, 206
- (79) Pascale, E., et al. 2011, MNRAS, 415, 911
- (80) Peng, Y.-J., et al. 2010, ApJ, 721, 193
- (81) Pérez-González, P. G., et al. 2008, ApJ, 675, 234
- (82) Pilbratt, J., et al. 2010, A&A, 518, L1
- (83) Poglitsch, A., et al. 2010, A&A, 518, L2
- (84) Pope, A., et al. 2006, MNRAS, 370, 1185
- (85) Puget, J. L., et al. 1996, A&A, 308, L5
- (86) Rigby, E. E., et al. 2011, MNRAS, 415, 2336
- (87) Rodighiero, G., et al. 2010, A&A, 518, 25
- (88) Rodighiero, G., et al. 2011, ApJL, 739L, 40
- (89) Rowan-Robinson, M., Babbedge, T., Oliver, S., et al. 2008, MNRAS, 386, 697
- (90) Salim, S., et al. 2007, ApJS, 173, 267S
- (91) Schneider, D. P., et al 2007, AJ, 134, 102
- (92) Scott, S. E., et al. 2002, MNRAS, 331, 817
- (93) Scoville, N., et al. 2007, ApJS, 172, 1
- (94) Silva, L., Granato, G. L., Bressan, A., & Danese, L. 1998, ApJ, 509, 103
- (95) Smail, I., Ivison, R. J., Blain, A. W. 1997, ApJ, 490, L5
- Smolčić et al. (2012) Smolčić, V., et al. 2012a, ApJS, 200, 10
- Smolčić et al. (2012) Smolčić, V., et al. 2012b, A&A, accepted (arXiv:1205.6470)
- (98) Smith, D. J. B., et al. 2011, MNRAS, 416, 857
- (99) Surace, J. A., Shupe, D. L., Fang, F., Lonsdale, C. J., & Gonzalez-Solares et al. 2005, http://swire.ipac.caltech.edu/swire/astronomers/publications
- (100) Sutherland, W. & Saunders, W. 1992, MNRAS, 259, 413
- (101) Swinbank, A. M., Smail, I., Longmore, S., et al. 2010, Nature, 464, 733
- (102) Tacconi, L. J., et al. 2008, ApJ, 680, 246
- (103) Tamura, Y., et al. 2010, ApJ, 724, 1270
- (104) Thompson, M., et al. 2010, A&A, 518, L134
- (105) Wang, W.-H., et al. 2011, ApJ, 726, L18
- (106) Wardlow, J. L., et al. 2011, MNRAS, 415, 1479
- (107) Wolf, C., Meisenheimer, K., Kleinheinrich, M., et al. 2004, A&A, 421, 913
- (108) Younger, J. D., et al. 2007, ApJ, 671, 1531
- (109) Younger, J. D., et al. 2008, MNRAS, 387, 707
- (110) Younger, J. D., et al. 2009, ApJ, 704, 803
- (111) York, D. G., et al. 2000, AJ, 120, 1579
| IAU ID | H-ATLAS | RAa | Deca | b | Yb | Jb | Hb | b | 3.6m | 4.5m | c | c | c | ze | Separationf | ||
|---|---|---|---|---|---|---|---|---|---|---|---|---|---|---|---|---|---|
| ID | (J2000) | (J2000) | (mag) | (mag) | (mag) | (mag) | (mag) | (mag) | (mag) | (mJy) | (mJy) | (mJy) | (3.6µm) | (4.5µm) | (arcsec) | ||
| J090311.6+003906 | 81 | ||||||||||||||||
| J090818.2+004720 | 106 | ||||||||||||||||
| J091304.9-005343 | 130 | ||||||||||||||||
| J090918.3+002420 | 177 | ||||||||||||||||
| J090916.1+003208 | 282 | ||||||||||||||||
| J090916.7+002808 | 317 | ||||||||||||||||
| J090835.8+004139 | 458 | ||||||||||||||||
| J090930.4+002224 | 462⋆ | ||||||||||||||||
| J090327.7+004119 | 466 | ||||||||||||||||
| J090816.8+003211 | 493 | ||||||||||||||||
| J090829.1+002714 | 511 | ||||||||||||||||
| J090925.3+004438 | 558 | ||||||||||||||||
| J090828.0+005005 | 641 | ||||||||||||||||
| J090803.6+003737 | 711 | ||||||||||||||||
| J090308.5+004146 | 754 | ||||||||||||||||
| J090910.2+004345 | 776 | ||||||||||||||||
| J090844.0+003256 | 827⋆ | ||||||||||||||||
| J090844.0+003256 | 827⋆ | ||||||||||||||||
| J090844.0+003256 | 827⋆ | ||||||||||||||||
| J090844.0+003256 | 827⋆ | ||||||||||||||||
| J090929.1+002440 | 861 | ||||||||||||||||
| J090814.6+002707 | 865 | ||||||||||||||||
| J090849.8+003203 | 891⋆ | ||||||||||||||||
| J090849.8+003203 | 891⋆ | ||||||||||||||||
| J090925.5+001941 | 946 | ||||||||||||||||
| J090800.6+002651 | 977 | ||||||||||||||||
| J090856.6+003813 | 1147 | ||||||||||||||||
| J090841.3+001559 | 1178 | ||||||||||||||||
| J090847.4+003459 | 1221 | ||||||||||||||||
| J090920.5+004420 | 1248 | ||||||||||||||||
| J090932.7+003705 | 1264 | ||||||||||||||||
| J090824.5+002927 | 1288 | ||||||||||||||||
| J090913.6+003256 | 1293⋆ | ||||||||||||||||
| J090851.4+003955 | 1340 | ||||||||||||||||
| J090818.5+002043 | 1366 | ||||||||||||||||
| J090755.2+002254 | 1381 | ||||||||||||||||
| J090845.7+002805 | 1397 | ||||||||||||||||
| J090934.9+002840 | 1398⋆ | ||||||||||||||||
| J090934.9+002840 | 1398⋆ | ||||||||||||||||
| J090817.7+002106 | 1426 | ||||||||||||||||
| J090854.3+003248 | 1434 | ||||||||||||||||
| J090924.3+004156 | 1483 | ||||||||||||||||
| J090945.6+003714 | 1559 | ||||||||||||||||
| J090823.8+004611 | 1685 | ||||||||||||||||
| J090822.6+004200 | 1750 | ||||||||||||||||
| J090307.6+004012 | 1762 | ||||||||||||||||
| J090920.4+002316 | 1976 | ||||||||||||||||
| J090314.5+003359 | 2121 | ||||||||||||||||
| J090920.5+003742 | 2180 | ||||||||||||||||
| J090913.5+002736 | 2244 | ||||||||||||||||
| J090855.6+001526 | 2277 |
Note. – ⋆ ID with color-magnitude method. a Coordinates are the position of IRAC counterparts. b Photometry from the VIKING survey () is extracted in diameter apertures (Sutherland et al. in prep). c The reported SPIRE 350 and 500 µm fluxes are measured at the postions of 250 µm sources; no SNR cut is applied. d R is reliability of the counterparts calculated separately at 3.6 and 4.5 µm from the LR method (section 3.1). e Redshifts are from the SDSS catalogue for sources detected in that survey. f The separation between the centroid of the SPIRE emission and the IRAC counterpart.
TABLE 2 – continued.
| IAU ID | H-ATLAS | RAa | Deca | b | Y | Jb | Hb | b | 3.6m | 4.5m | c | c | c | ze | Separationf | ||
|---|---|---|---|---|---|---|---|---|---|---|---|---|---|---|---|---|---|
| ID | (J2000) | (J2000) | (mag) | (mag) | (mag) | (mag) | (mag) | (mag) | (mag) | (mJy) | (mJy) | (mJy) | (3.6µm) | (4.5µm) | (arcsec) | ||
| J090925.2+003224 | 2281 | ||||||||||||||||
| J091257.8-005508 | 2343 | ||||||||||||||||
| J090841.3+002005 | 2432 | ||||||||||||||||
| J090752.3+002100 | 2437 | ||||||||||||||||
| J090850.0+004309 | 2459⋆ | ||||||||||||||||
| J090850.0+004309 | 2459⋆ | ||||||||||||||||
| J090803.8+002250 | 2549 | ||||||||||||||||
| J090855.5+002808 | 2565 | ||||||||||||||||
| J090930.2+002755 | 2680 | ||||||||||||||||
| J090803.7+002921 | 2715 | ||||||||||||||||
| J090905.3+001525 | 2773 | ||||||||||||||||
| J090846.0+004339 | 2793⋆ | ||||||||||||||||
| J090846.0+004339 | 2793⋆ | ||||||||||||||||
| J090943.0+004322 | 2796 | ||||||||||||||||
| J090819.6+003259 | 2866 | ||||||||||||||||
| J091302.7-004618 | 2986 | ||||||||||||||||
| J090922.4+002715 | 3043 | ||||||||||||||||
| J090333.3+004746 | 3056 | ||||||||||||||||
| J090800.5+002457 | 3084 | ||||||||||||||||
| J090839.4+004107 | 3113 | ||||||||||||||||
| J090746.7+002148 | 3161 | ||||||||||||||||
| J090832.7+002406 | 3205 | ||||||||||||||||
| J090829.1+001556 | 3242 | ||||||||||||||||
| J090843.7+001437 | 3251 | ||||||||||||||||
| J091303.6-004855 | 3285 | ||||||||||||||||
| J090836.4+002948 | 3304 | ||||||||||||||||
| J090940.3+002939 | 3318 | ||||||||||||||||
| J090921.9+002556 | 3457 | ||||||||||||||||
| J090832.2+001938 | 3573 | ||||||||||||||||
| J090323.9+004620 | 3574 | ||||||||||||||||
| J091317.7-004621 | 3583 | ||||||||||||||||
| J090901.5+003107 | 3616 | ||||||||||||||||
| J090858.8+003158 | 3714 | ||||||||||||||||
| J091001.4+004024 | 3792 | ||||||||||||||||
| J090903.5+002031 | 3825 | ||||||||||||||||
| J090921.9+004307 | 3974 | ||||||||||||||||
| J090901.9+004217 | 4113 | ||||||||||||||||
| J090811.9+003410 | 4185 | ||||||||||||||||
| J090821.6+002700 | 4344 | ||||||||||||||||
| J090935.1+002224 | 4352 | ||||||||||||||||
| J090918.3+003409 | 4366⋆ | ||||||||||||||||
| J090918.3+003409 | 4366⋆ | ||||||||||||||||
| J091306.9-004719 | 4404 | ||||||||||||||||
| J091318.1-005409 | 4520 | ||||||||||||||||
| J090744.7+002005 | 4524 | ||||||||||||||||
| J090902.0+001936 | 4587⋆ | ||||||||||||||||
| J090902.0+001936 | 4587⋆ | ||||||||||||||||
| J090902.0+001936 | 4587⋆ | ||||||||||||||||
| J091304.1-005141 | 4658 | ||||||||||||||||
| J090851.6+003823 | 4693 |
Note. – ⋆ ID with color-magnitude method. a Coordinates are the position of IRAC counterparts. b Photometry from the VIKING survey () is extracted in diameter apertures (Sutherland et al. in prep). c The reported SPIRE 350 and 500 µm fluxes are measured at the postions of 250 µm sources; no SNR cut is applied. d R is reliability of the counterparts calculated separately at 3.6 and 4.5 µm from the LR method (section 3.1). e Redshifts are from the SDSS catalogue for sources detected in that survey. f The separation between the centroid of the SPIRE emission and the IRAC counterpart.
TABLE 2 – continued.
| IAU ID | H-ATLAS | RAa | Deca | b | Y | Jb | Hb | b | 3.6m | 4.5m | c | c | c | ze | Separationf | ||
|---|---|---|---|---|---|---|---|---|---|---|---|---|---|---|---|---|---|
| ID | (J2000) | (J2000) | (mag) | (mag) | (mag) | (mag) | (mag) | (mag) | (mag) | (mJy) | (mJy) | (mJy) | (3.6µm) | (4.5µm) | (arcsec) | ||
| J090855.2+003051 | 4739 | ||||||||||||||||
| J090842.2+001815 | 4779 | ||||||||||||||||
| J090831.3+002251 | 4849 | ||||||||||||||||
| J090833.9+004616 | 4850 | ||||||||||||||||
| J090847.1+003247 | 4930 | ||||||||||||||||
| J090931.4+003936 | 5050 | ||||||||||||||||
| J090741.5+002103 | 5082 | ||||||||||||||||
| J090757.3+003006 | 5157⋆ | ||||||||||||||||
| J090846.2+004110 | 5258 | ||||||||||||||||
| J090938.9+003240 | 5267 | ||||||||||||||||
| J090840.6+001725 | 5327 | ||||||||||||||||
| J090759.7+002033 | 5366 | ||||||||||||||||
| J090932.9+002242 | 5386 | ||||||||||||||||
| J090314.0+004235 | 5422 | ||||||||||||||||
| J090914.8+002041 | 5450 | ||||||||||||||||
| J090929.6+003313 | 5521 | ||||||||||||||||
| J090837.1+005002 | 5530 | ||||||||||||||||
| J090825.8+004217 | 5538 | ||||||||||||||||
| J090821.9+002445 | 5564 | ||||||||||||||||
| J090910.9+003517 | 5621 | ||||||||||||||||
| J090848.1+002626 | 5691 | ||||||||||||||||
| J090812.1+002430 | 5735 | ||||||||||||||||
| J090852.9+004106 | 5774 | ||||||||||||||||
| J090912.3+002129 | 6012 | ||||||||||||||||
| J090908.3+002545 | 6100⋆ | ||||||||||||||||
| J090902.6+004737 | 6146 | ||||||||||||||||
| J090928.7+002630 | 6189⋆ | ||||||||||||||||
| J090754.6+003345 | 6220⋆ | ||||||||||||||||
| J090946.4+003847 | 6224 | ||||||||||||||||
| J090832.0+002749 | 6324 | ||||||||||||||||
| J090956.0+003739 | 6348 | ||||||||||||||||
| J090840.1+001928 | 6480 | ||||||||||||||||
| J090847.1+001512 | 6792 | ||||||||||||||||
| J090324.0+003954 | 6893 | ||||||||||||||||
| J090808.2+002115 | 6962 | ||||||||||||||||
| J091308.7-005605 | 6991 | ||||||||||||||||
| J090915.4+003450 | 7107 | ||||||||||||||||
| J090855.7+002121 | 7216 | ||||||||||||||||
| J090836.5+002513 | 7826 | ||||||||||||||||
| J090842.8+003623 | 8022 | ||||||||||||||||
| J091309.5-005417 | 9262 | ||||||||||||||||
| J090830.0+002439 | 9290 | ||||||||||||||||
| J090909.4+003440 | 10110 | ||||||||||||||||
| J090820.3+002808 | 11918 | ||||||||||||||||
| J090834.7+003635 | 15947 |
Note. – ⋆ ID with color-magnitude method. a Coordinates are the position of IRAC counterparts. b Photometry from the VIKING survey () is extracted in diameter apertures (Sutherland et al. in prep). c The reported SPIRE 350 and 500 µm fluxes are measured at the postions of 250 µm sources; no SNR cut is applied. d R is reliability of the counterparts calculated separately at 3.6 and 4.5 µm from the LR method (section 3.1). e Redshifts are from the SDSS catalogue for sources detected in that survey. f The separation between the centroid of the SPIRE emission and the IRAC counterpart.