An Extreme X-ray Disk Wind in the Black Hole Candidate IGR J170913624
Abstract
Chandra spectroscopy of transient stellar-mass black holes in outburst has clearly revealed accretion disk winds in soft, disk–dominated states, in apparent anti-correlation with relativistic jets in low/hard states. These disk winds are observed to be highly ionized, dense, and to have typical velocities of 1000 km/s or less projected along our line of sight. Here, we present an analysis of two Chandra High Energy Transmission Grating spectra of the Galactic black hole candidate IGR J170913624 and contemporaneous EVLA radio observations, obtained in 2011. The second Chandra observation reveals an absorption line at 6.910.01 keV; associating this line with He-like Fe XXV requires a blue-shift of km/s (0.03, or the escape velocity at 1000 RSchw). This projected outflow velocity is an order of magnitude higher than has previously been observed in stellar-mass black holes, and is broadly consistent with some of the fastest winds detected in active galactic nuclei. A potential feature at 7.32 keV, if due to Fe XXVI, would imply a velocity of km/s (0.05), but this putative feature is marginal. Photoionization modeling suggests that the accretion disk wind in IGR J170913624 may originate within 43,300 Schwarzschild radii of the black hole, and may be expelling more gas than accretes. The contemporaneous EVLA observations strongly indicate that jet activity was indeed quenched at the time of our Chandra observations. We discuss the results in the context of disk winds, jets, and basic accretion disk physics in accreting black hole systems.
Subject headings:
X-rays: binaries — accretion, accretion disks — black hole physics1. Introduction
A detailed observational account of how black hole accretion disks drive winds and jets remains elusive, but the combination of high resolution X-ray spectroscopy, improved radio sensitivity, and comparisons across the black hole mass scale hold great potential. The broad range in X-ray luminosity covered by transient stellar-mass black holes makes it possible to trace major changes in the accretion flow as a function of the inferred mass accretion rate; this is largely impossible in supermassive black holes. Disk winds and jets, for instance, appear to be state-dependent and mutually exclusive in sources such as H 1743322 (Miller et al., 2006a; Blum et al., 2010), GRO J165540 (Miller et al., 2008; Luketic et al., 2010; Kallman et al., 2009), and GRS 1915105 (Miller et al., 2008; Neilsen & Lee, 2009). This may offer insights into why many Seyfert AGN, which are well known for their disk winds, are typically radio–quiet (though not necessarily devoid of jets; see King et al., 2011a; Jones et al., 2011; Giroletti & Panessa, 2009).
The proximity of Galactic black hole binaries (BHB) ensures a high flux level and spectra with excellent sensitivity in the Fe K band. This is of prime importance because He-like Fe XXV and H-like Fe XXVI lines can endure in extremely hot, ionized gas (see, e.g. Bautista & Kallman, 2001), and therefore trace the wind region closest to where it is launched near the black hole. Studies of some stellar-mass black hole disk winds find that the gas is too ionized, too dense, and originates too close to the black hole to be expelled by radiative pressure or by thermal pressure from Compton heating of the disk, requiring magnetic pressure (Miller et al., 2006a, b; Kubota et al., 2007). Winds that may originate close to the black hole and carry high mass fluxes are also observed in AGN (e.g., Kaspi et al., 2002; Chartas et al., 2002; King et al., 2011b; Tombesi et al., 2010).
In this Letter, we present evidence of a particularly fast disk wind in the black hole candidate IGR J170913624. The current outburst of IGR J170913624 was first reported on 2011 January 28 (Krimm et al., 2011). Our observations caught IGR J170913624 in the high/soft state, but it is important to note that the source has also showed low/hard state episodes with flaring and apparent jet activity in radio bands (Rodriguez et al., 2011). X-ray flux variations in IGR J170913264 bear similarities to the microquasar GRS 1915105 (e.g., Altamirano et al., 2011).
2. Observation and Data Reduction
IGR J170913624 was first observed with Chandra on 2011 August 1 (ObsID 12405), starting at 06:59:16 (UT), for a total of 30 ksec. The High Energy Transmission Gratings (HETG) were used to disperse the incident flux onto the Advanced CCD Imaging Spectrometer spectroscopic array (ACIS-S). To prevent photon pile-up, the ACIS-S array was operated in continuous clocking or “GRADED_CC” mode, which reduced the nominal frame time from 3.2 seconds to 2.85 msec. The zeroth order flux is incident on the S3 chip, and frames from this chip can be lost from the telemetry stream if a source is very bright. We therefore used a gray window over the zeroth order aimpoint; only one in 10 photons were telemetered within this region. For a longer discussion of this mode, please see, e.g., Miller et al. (2006) and Miller et al. (2008). The source was observed for a second time on 2011 October 6, starting at 11:17:02 (UT), again for a total of 30 ksec. The relatively low flux observed during the first observation indicated that the ACIS-S array could be operated in the standard “timed event” imaging mode during this second observation.
Data reduction was accomplished using CIAO version 4.1 (Fruscione et al., 2006). Time-averaged first-order High Energy Grating (HEG) and Medium Energy Grating (MEG) spectra were extracted from the Level-2 event file. Redistribution matrix files (rmfs) were generated using the tool “mkgrmf”; ancillary response files (arfs) were generated using “mkgarf”. The first-order HEG spectra and responses were combined using the tool “add_grating_orders”. The spectra were then grouped to require a minimum of 10 counts per bin. All spectral analyses were conducted using XSPEC version 12.6.0. All errors quoted in this paper are 1 errors.
Nearly simultaneous radio observations were made with the EVLA at each Chandra pointing. The first radio epoch included a two hour integration at 8.4 GHz on 2011 August 2 (MJD 55776) at 1:01:04 (UT), while the second was a two hour integration at both 8.4 and 4.8 GHz on 2011 October 6 (MJD 55841) at 22:10:16 (UT). The flux and bandpass calibrator was 3C 286. The phase and gain calibrators were J1720-3552 and J1717-3624, for the first and second observations, respectively. The data are reduced using CASA version 3.2.1 (McMullin et al., 2007).
3. Analysis and Results
A black hole mass has not yet been determined for J170913624; a value of is assumed throughout this work. Preliminary fits to the HETG spectra of IGR J170913624 suggested a relatively high column density, in keeping with values predicted from radio surveys (e.g. ; Dickey & Lockman, 1990). Due to this high column that predominantly affects lower energies, the MEG spectra have comparatively low sensitivity as compared to the HEG, and were therefore excluded.
The limitations of the HEG and our instrumental configuration enforce an effective lower energy bound of 1.3 keV. In the second observation, the instrumental configuration served to enforce an upper limit to the fitting range of 7.6 keV. This limit was adopted for the first observation as well.
3.1. The Spectral Continuum
The HEG spectra were fit with a fiducial spectral model including an effective H column density (TBabs), a disk blackbody component, and a power-law component.
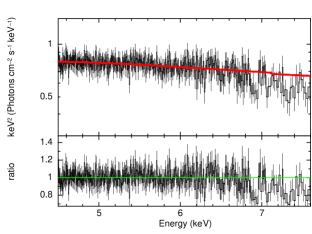
The first observation (MJD 55775) is well described by column density of NH=9.9 cm-2, and a disk blackbody temperature of 1.3 keV. The resulting fit gave a = 2657/3156 = 0.84. This spectrum is dominated by the disk black body component, typical of the high soft state of BHB. A power-law continuum component is not statistically required. An unabsorbed flux of F2-10keV = 1.5 ergs cm-2 s-1 was measured.
The second observation (MJD 55841) also had a consistent flux, F2-10keV = 1.9 ergs cm-2 s-1. Again, the column density was large, at NH= 1.22 cm-2. A power-law photon index of = 1.7 and a disk blackbody temperature of 2.3 keV were measured. This disk temperature is high but common in GRS 1915105 (see, e.g., Vierdayanti et al., 2010). The resulting was 2754/3414=0.81.
3.2. The Line Spectra
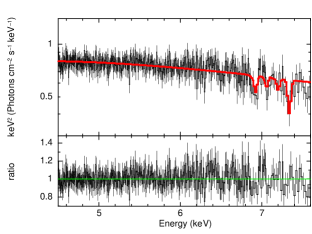
In the second HEG spectrum, absorption features are noted in the Fe K band (See Figure 1), and these were initially fit with simple Gaussians. The two strongest lines are found at energies of 6.91 keV and 7.32. Via an F-test, (see Protassov et al., 2002, for some cautions), these lines are significant at the 99.94% and 99.67% confidence levels respectively. Dividing the flux normalization of each line by its minus-side error suggests that the feature at 6.91 keV is significant at the 4 level of confidence, while the 7.32 keV line is marginal at a 2 confidence level.
We also modeled the second observation continuum with a Comptonization model (compTT) instead of the disk blackbody and power-law. In general, this gave a reasonable fit at =2884/3414 = 0.84. This model also showed residual absorption features at high energy, which again we modeled with Gaussian functions. Relative to this continuum, the features at 6.91 keV and 7.32 keV are detected at a higher level of significance (6).
It is reasonable to associate the line at keV with He-like Fe XXV, which has a rest energy of 6.70 keV (Verner et al., 1996). This translates into a blue-shift of 9300 km/s. This feature clearly signals an extreme disk wind in IGR J170913624. Typical velocities in X-ray Binaries are km/s (Miller et al., 2006a, b). If the feature at 7.32 keV is real and can be associated with H-like Fe XXVI at 6.97 keV, it would correspond to a blue-shift of 14600. For additional details, see Table 1. Although less likely, the 6.91 keV line could also be associated with a redshift from the H-like Fe XXVI line. The corresponding inflowing velocity would be 2600 km/s. If this is due to gravitational redshift, the corresponding radius would be 1.7 cm (60).
The absence of emission lines in the second spectrum of IGR J170913624 is notable, but is only suggestive of an equatorial wind. Given that disk winds have only been detected in sources viewed at high inclination angles, and given the similarities between IGR J170913624 and GRS 1915105, it is likely that IGR J170913624 is also viewed at a high inclination. However, there is no evidence of eclipses in this source, so inclinations above 70∘ can be ruled out.
Absorption lines like those detected in the second observation of IGR J170913624 are absent in the first observation. Fits to the Fe K band using a local continuum model, and narrow Gaussian functions with FWHM values corresponding to those measured in the second observation give 1 confidence limits of 3 eV or less on lines in the 6.70–7.32 keV band. This is significantly below the equivalent widths measured in the second observation. (see Table 1) This may simply be due to a variable absorption geometry in IGR J170913624; this has previously been observed in H 1743322 and GRS 1915105 (Miller et al., 2006a, b, 2008; Neilsen & Lee, 2009).
3.3. Photoionization Modeling
To get a better physical picture of the absorption in the second observation of IGR 170913624, we also fit the data with a grid of self-consistent photoionization models created with XSTAR (Kallman & Bautista, 2001). The ionizing luminosity for this model was derived from extrapolating the unabsorbed spectrum from the second observation to 0.0136–30 keV, ensuring coverage above 8.8 keV, which is required to ionize Fe XXV. A distance of 8.5 kpc is first assumed to derive this luminosity (Lion=3.5 ergs/s), owing to the location of J170913624 within the Galactic bulge. However, Altamirano et al. (2011b) also suggest the possibility that this source could be accreting at high Eddington fractions but further away, and a distance of 25 kpc was also adopted in a second XSTAR grid (Lion=3.5 ergs/s).
The density of the absorbing material was chosen to be log() = 12.0. This is a reasonable assumption based on the modeling of similar X-ray binaries: GX 13+1, cm-3(Ueda et al., 2004), GRO J1655-40, cm-3(Miller et al., 2008), H1743-322, cm-3 (Miller et al., 2006a). A turbulent velocity of km/s was found to provide the best fit after various trials. A covering factor of 0.5 was chosen as the absence of emission lines suggests an equatorial wind. Finally, the Fe abundance was assumed to be twice the solar value after initial fits; this characterizes the Fe K lines but does not predict absorption lines, e.g. Si, that are not observed.
The initial, lower luminosity grid was fit to the data in XSPEC as a multiplicative model; free parameters included the column density, ionization, and velocity shifts of the absorbing gas (see Table 1 and Figure 2). For the disk blackbody and power-law continuum, an ionization parameter of = 3.3 is required, as well as a wind column density of N = 4.7 cm-2. Velocity shifts consistent with simple Gaussian models are found using the XSTAR grid.
To fit the putative higher energy absorption, a second outflow component is required. An additional, lower luminosity XSTAR component is significant at the level, relative to both continua. The wind column density was higher at N = 1.7 cm-2, and the = 3.9. This system is moving even faster at 15400 km/s = 0.05c. (See Table 1 and Figure 2)
Repeating this analysis, but utilizing the higher luminosity XSTAR grid, we find that the two components are again required. In fact, the values of the column density, ionization and velocity shifts are nearly identical and well within of the previous model.
To derive one estimate to the radius where these winds are launched, we can estimate the radius at which the observed velocity equals the escape velocity. This constrains the radius to be at cm (970 RSchw). Using and N, where f is the 1-dimensional filling factor, we can then derive the filling factor and density of the region. Assuming the ionizing luminosity is erg/s, the resulting filling factor is , and the density is cm-3. However, if the luminosity is higher (Lion= erg/s), the filling factor decreases to , and the density increases to cm-3.
These density estimates are quite high when compared to other X-ray binaries (e.g., Ueda et al., 2004; Miller et al., 2006a, 2008). However, we can invert the previous argument and instead derive the filling factor and radius from an assumed density, i.e. cm-3. We find a larger filling factor, (), and radius, ( cm, 43,300 ), if we require a luminosity of erg/s. A larger luminosity, i.e. Lion= erg/s, reduces the filling factor, () but increases the radius ( cm, 100,000 ). At these radii the escape velocity is much lower than the observed velocity.
Finally, we can estimate the mass outflow rate () using a modified spherical outflow, which can be approximated as . Here, we assume a covering factor , and an outflowing velocity of km/s. A luminosity of erg/s and filling factor of , gives a lower limit of g/s. However, a much larger outflow rate of g/s is found, if we assume erg/s and filling factor of
For comparison, , where is an efficiency factor typically taken to be 10%. For IGR J170913624, g/s. Using from the disk blackbody and power-law model, we find that the observed portion of the outflow is likely to carry away 0.4–20 times the amount of accreted gas. Unless a geometrical consideration serves to bias our estimates, a high fraction of the available gas may not accrete onto the black hole. This trend is not only seen in BHB but in Seyferts as well. Blustin et al. (2005) note that more than half of their observed Seyferts show .
3.4. Radio Non-Detections
The EVLA radio observations at 8.4 GHz were made nearly contemporaneously with their X-ray counterparts. Both radio observations were nearly two hours in duration. Neither observation detected a source at the location of IGR J170913624. The RMS noise level for each observation was 0.02 mJy and 0.07 mJy for the two epochs, respectively. The second observation had extended coverage to 4.8 GHz that also had a non-detection. The RMS for this frequency was 0.13 mJy. In contrast, IGR J170913624 was detected at the 1–2 mJy level during the low/hard state (Rodriguez et al., 2011). This supports prior findings that the radio jet is absent during the periods when winds are seen in BHB (Miller et al., 2006a, 2008; Neilsen & Lee, 2010).
4. Discussion and Conclusions
At ionizations above , radiation pressure is inefficient, and it is not able to drive these winds (e.g., Proga et al., 2000). Thus, although the UV components of disk winds in AGN are driven at least partially by radiation pressure, the wind in IGR J170913624 likely cannot be driven in this way. A thermal wind can arise at radii greater than (Woods et al., 1996), where , where is the Compton temperature of the gas in units of K. The spectrum observed in the second observation gives cm. Therefore, if we assume our conservative estimate of the launching radius, it is possible for IGRJ170913624 to have a thermally driven wind. However, if the wind originates closer to the black hole, then it is likely that magnetic processes – either pressure from magnetic viscosity within the disk (e.g., Proga, 2003) or magneto-centrifugal acceleration (e.g., Blandford & Payne, 1982) – must play a role in launching the wind observed in IGR J170913624.
Fast X-ray disk winds are not only seen in BHB like IGR J170913624, but also in AGN and quasars (e.g., King et al., 2011b; Chartas et al., 2002). The fastest UV winds observed in AGN are pushed to high velocities by radiation pressure. It remains to be seen whether a common driving mechanism works across the black hole mass scale to drive fast, highly ionized X-ray disk winds. Chartas et al. (2002) show that in the quasar APM 08279+5255 there are broad absorption features, which are likely highly relativistic Fe XXV and/or Fe XXVI lines. In these regards, it bears some similarities to the most extreme winds in BHB’s.
Observations of BHB point to an anti-correlation of wind and jet outflows from accretion disks (Miller et al., 2006a, 2008; Blum et al., 2010; Neilsen & Lee, 2010). Winds appear to only be detected, or at least are considerably stronger, in soft, disk–dominated states, and absent in hard states where compact, steady jets are ubiquitous (Fender, 2006). In H 1743322, in particular, there is evidence that the absence of winds in hard states is not an artifact of high ionization hindering the detection of absorption lines, but instead represents a real change in the column density (and thus the mass outflow rate) in any wind (Blum et al., 2010).
It appears that our coordinated Chandra and EVLA observations of IGR J170913624 support this anti-correlation. The EVLA observations place very tight limits on the radio flux when the disk wind is detected, orders of magnitude below the level at which IGR J170913624 was detected in radio during its low/hard state only a few months prior (Rodriguez et al., 2011).
Neilsen & Lee (2009) suggested that the production of winds may be responsible for quenching jets in GRS 1915105. It might then be the case that jets should be observed whenever winds are absent. In our first observation of IGR J170913624, however, neither a wind nor a jet is detected, with tight limits. Instead, the apparent dichotomy between winds and jets may signal the magnetic field topology in and above the disk is state-dependent. This is broadly consistent with multi-wavelength studies suggesting synchrotron flares above the disk, but only in the hard state (e.g. GX 3394, XTE J1118480, Di Matteo et al., 1999; Gandhi et al., 2010). It is interesting to speculate that the magnetic field might be primarily toroidal in the soft state, where a Shakura-Sunyaev disk is dominant, but primarily poloidal in the hard state, when the mass accretion rate is lower (e.g., Beckwith et al., 2008). The type of outflow that is observed may also depend greatly on how much mass is loaded onto magnetic field lines; that could depend on variables including the mass accretion rate through the disk.
We would like to thank the anonymous referee. We thank Michael Nowak for his instrumental help as well. ALK gratefully acknowledges support through the NASA Earth and Space Sciences Fellowship. JMM gratefully acknowledges support through the Chandra Guest Observer program. The National Radio Astronomy Observatory is a facility of the National Science Foundation operated under cooperative agreement by Associated Universities, Inc.
| Parameter | Model 1 | Model 2 | Model 3 | Model 4 |
|---|---|---|---|---|
| diskbb + po | (diskbb + po) | comptt | (comptt) | |
| + Gauss + Gauss | Xstar Xstar | + Gauss + Gauss | Xstar Xstar | |
| NH (1022 cm-2) | 1.14 | 1.13 | 0.475 | 0.558 |
| - | ||||
| Tin (keV) | 1.53 | 1.51 | - | - |
| Norm | 13.1 | 13.8 | - | - |
| 1.93 | 1.91 | - | - | |
| Norm | 0.35 | 0.34 | - | - |
| - | ||||
| T0 (keV) | - | - | 0.58 | 0.59 |
| kT (keV) | - | - | 10.5 | 9.8 |
| - | - | 2.24 | 2.28 | |
| Norm | - | - | 0.0584 | 0.062 |
| - | ||||
| EFeXXV (keV) | 6.91 | - | 6.91 | - |
| FWHM (keV) | 0.091 | - | 0.13 | - |
| EW (keV) | 0.021 | - | - | |
| Norm () | 3.5 | - | 6.0 | - |
| v (km/s) | 9300 | - | 9300 | - |
| - | ||||
| EFeXXVI (keV) | 7.32 | - | 7.300.02 | - |
| FWHM (keV) | 0.081 | - | 0.25 | - |
| EW (keV) | 0.032 | - | - | |
| Norm () | 3.4 | - | 11.8 | - |
| v (km/s) | 14600 | - | 13800 | - |
| - | ||||
| N (1022 cm-2) | - | 0.47 | - | 0.45 |
| (ergs cm s-1) | - | 3.3 | - | 3.4 |
| v (km/s) | - | 9600 | - | 9600 |
| - | ||||
| N (1022 cm-2) | - | 1.66 | - | 1.97 |
| (ergs cm s-1) | - | 3.9 | - | 3.7 |
| v (km/s) | - | 15400 | - | 15400 |
| - | ||||
| 2725/3408 = 0.80 | 2731/3408 = 0.80 | 2793/3408 = 0.82 | 2761/3408 = 0.81 |
Note. — This Table lists the line detections using Gaussian functions as well as more self-consistent, photoionization components created with XSTAR, assuming two different continuum models. TBabs is applied to all the models and the errors are 1 confidence level.
References
- Altamirano et al. (2011) Altamirano, D., et al. 2011, The Astronomer’s Telegram, 3299, 1
- Altamirano et al. (2011b) —. 2011b, ApJ, submitted
- Bautista & Kallman (2001) Bautista, M. A., & Kallman, T. R. 2001, ApJS, 134, 139
- Beckwith et al. (2008) Beckwith, K., Hawley, J. F., & Krolik, J. H. 2008, ApJ, 678, 1180
- Blandford & Payne (1982) Blandford, R. D., & Payne, D. G. 1982, MNRAS, 199, 883
- Blum et al. (2010) Blum, J. L., Miller, J. M., Cackett, E., Yamaoka, K., Takahashi, H., Raymond, J., Reynolds, C. S., & Fabian, A. C. 2010, ApJ, 713, 1244
- Blustin et al. (2005) Blustin, A. J., Page, M. J., Fuerst, S. V., Branduardi-Raymont, G., & Ashton, C. E. 2005, A&A, 431, 111
- Chartas et al. (2002) Chartas, G., Brandt, W. N., Gallagher, S. C., & Garmire, G. P. 2002, ApJ, 579, 169
- Di Matteo et al. (1999) Di Matteo, T., Celotti, A., & Fabian, A. C. 1999, MNRAS, 304, 809
- Dickey & Lockman (1990) Dickey, J. M., & Lockman, F. J. 1990, ARA&A, 28, 215
- Fender (2006) Fender, R. 2006, Jets from X-ray binaries, ed. Lewin, W. H. G. & van der Klis, M., 381–419
- Fruscione et al. (2006) Fruscione, A., et al. 2006, Proc. SPIE, 6270
- Gandhi et al. (2010) Gandhi, P., et al. 2010, MNRAS, 407, 2166
- Giroletti & Panessa (2009) Giroletti, M., & Panessa, F. 2009, ApJ, 706, L260
- Jones et al. (2011) Jones, S., McHardy, I., Moss, D., Seymour, N., Breedt, E., Uttley, P., Körding, E., & Tudose, V. 2011, MNRAS, 412, 2641
- Kallman & Bautista (2001) Kallman, T., & Bautista, M. 2001, ApJS, 133, 221
- Kallman et al. (2009) Kallman, T. R., Bautista, M. A., Goriely, S., Mendoza, C., Miller, J. M., Palmeri, P., Quinet, P., & Raymond, J. 2009, ApJ, 701, 865
- Kaspi et al. (2002) Kaspi, S., et al. 2002, ApJ, 574, 643
- King et al. (2011a) King, A. L., et al. 2011a, ApJ, 729, 19
- King et al. (2011b) King, A. L., Miller, J. M., & Raymond, J. C. 2011b, ApJ, submitted
- Krimm et al. (2011) Krimm, H. A., et al. 2011, The Astronomer’s Telegram, 3144, 1
- Kubota et al. (2007) Kubota, A., et al. 2007, PASJ, 59, 185
- Luketic et al. (2010) Luketic, S., Proga, D., Kallman, T. R., Raymond, J. C., & Miller, J. M. 2010, ApJ, 719, 515
- McMullin et al. (2007) McMullin, J. P., Waters, B., Schiebel, D., Young, W., & Golap, K. 2007, in Astronomical Society of the Pacific Conference Series, Vol. 376, Astronomical Data Analysis Software and Systems XVI, ed. R. A. Shaw, F. Hill, & D. J. Bell, 127
- Miller et al. (2006a) Miller, J. M., et al. 2006a, ApJ, 646, 394
- Miller et al. (2006b) Miller, J. M., Raymond, J., Fabian, A., Steeghs, D., Homan, J., Reynolds, C., van der Klis, M., & Wijnands, R. 2006b, Nature, 441, 953
- Miller et al. (2008) Miller, J. M., Raymond, J., Reynolds, C. S., Fabian, A. C., Kallman, T. R., & Homan, J. 2008, ApJ, 680, 1359
- Neilsen & Lee (2009) Neilsen, J., & Lee, J. C. 2009, Nature, 458, 481
- Neilsen & Lee (2010) Neilsen, J., & Lee, J. C. 2010, in Bulletin of the American Astronomical Society, Vol. 42, American Astronomical Society Meeting Abstracts #215, 371.04
- Proga (2003) Proga, D. 2003, ApJ, 585, 406
- Proga et al. (2000) Proga, D., Stone, J. M., & Kallman, T. R. 2000, ApJ, 543, 686
- Protassov et al. (2002) Protassov, R., van Dyk, D. A., Connors, A., Kashyap, V. L., & Siemiginowska, A. 2002, ApJ, 571, 545
- Rodriguez et al. (2011) Rodriguez, J., Corbel, S., Caballero, I., Tomsick, J. A., Tzioumis, T., Paizis, A., Cadolle Bel, M., & Kuulkers, E. 2011, A&A, 533, L4
- Tombesi et al. (2010) Tombesi, F., Sambruna, R. M., Reeves, J. N., Braito, V., Ballo, L., Gofford, J., Cappi, M., & Mushotzky, R. F. 2010, ApJ, 719, 700
- Ueda et al. (2004) Ueda, Y., Murakami, H., Yamaoka, K., Dotani, T., & Ebisawa, K. 2004, ApJ, 609, 325
- Verner et al. (1996) Verner, D. A., Verner, E. M., & Ferland, G. J. 1996, Atomic Data and Nuclear Data Tables, 64, 1
- Vierdayanti et al. (2010) Vierdayanti, K., Mineshige, S., & Ueda, Y. 2010, PASJ, 62, 239
- Woods et al. (1996) Woods, D. T., Klein, R. I., Castor, J. I., McKee, C. F., & Bell, J. B. 1996, ApJ, 461, 767