Precise Half-Life Measurement of the Superallowed Emitter 46V
Abstract
The half-life of 46V has been measured to be 422.66(6) ms, which is a factor of two more precise than the best previous measurement. Our result is also consistent with the previous measurements, with no repeat of the disagreement recently encountered with values measured for the same transition. The value for the 46V superallowed transition, incorporating all world data, is determined to be 3074.1(26) s, a result consistent with the average value of 3072.08(79) s established from the 13 best-known superallowed transitions.
pacs:
21.10.Tg, 23.40.-s, 27.40.+zI Introduction
At present, the most stringent test of the unitarity of the Cabibbo-Kobayashi-Maskawa (CKM) matrix depends on results from superallowed nuclear decay. Precise measurements of values for these superallowed transitions provide a direct determination of the weak vector coupling constant within an uncertainty of 0.013 and lead to the most precise value of , the up-down quark-mixing element of the CKM matrix, within 0.023 to10 . Incorporating this result, the sum of squares of the top-row elements of the CKM matrix satisfies the unitarity condition at the level of 0.06 to10 . This remarkable agreement with the standard model constrains the scope of any new physics possible beyond the standard model, and motivates the quest for still higher experimental precision to make the unitarity test even more definitive.
The value that characterizes a -transition depends on three measured quantities: the total transition energy , the half-life of the parent state, and the branching ratio for the particular transition of interest. The statistical rate function depends on the fifth power of the value, while the partial half-life is given by the half-life divided by the branching ratio. Thus, the fractional uncertainty required for -value measurements must be five times smaller than that for half-life and branching-ratio measurements to have the same impact on the fractional uncertainty for the value. Within the past decade, the advent of on-line Penning traps has made a significant improvement possible in measurements, which has had an important impact on world data for superallowed beta decay.
The decay of 46V was the first of the nine best-known superallowed transitions to have its value measured (in 2005) with an on-line Penning trap sa05 . The result differed significantly from the previously accepted result – a longstanding reaction-based value published in 1977 vo77 – and shifted the 46V value two standard deviations out of agreement with other well-known superallowed transitions. This apparent deviation from the conserved vector current (CVC) expectation raised several concerns, among them the possibility of systematic differences between reaction and Penning-trap measurements of values. As a result, another independent Penning-trap measurement was performed a year later, in which the value for 46V was determined again, along with the values for two other superallowed beta emitters, 26Alm and 42Sc er06 . The second measurement for 46V confirmed the first Penning-trap result. At the same time though, the -value results for 26Alm and 42Sc were consistent with previous reaction-based values, thus demonstrating that there were no widespread systematic effects afflicting all reaction-based measurements. Evidently, the problem with the 46V value arose from some flaw specific to one particular set of reaction measurements vo77 . This conclusion was further strengthened by a subsequent -value measurement in 2009 fa09 , which used the same (3He, ) reaction and some of the same equipment as had been used 32 years earlier in the flawed measurement. It obtained a value for 46V that was entirely consistent with the two Penning trap results. Finally, even more recently, another Penning-trap measurement of the 46V value has been published Er11 with a 100-eV uncertainty, a factor of three smaller than any previous measurement. It agrees with the previous Penning-trap measurements and with the recent (3He, ) result.
In parallel with these experimental studies, the theory used in the analysis of the 46V results was carefully reexamined as well. In order to extract from a measured value, radiative and isospin-symmetry-breaking corrections must both be applied to convert the measured value into a corrected value ha09 . In the case of 46V and the other -shell nuclei, the original isospin-symmetry-breaking corrections had been derived with a shell model based on a closed shell at 40Ca. However the presence of low-lying and states in 45Ti and other nuclei in the region shows that core orbitals must play an important role. Accordingly, the isospin-symmetry-breaking corrections were improved to08 by the inclusion of core orbitals in the model space used in the calculation. The choice of which orbitals to include was guided by the measured spectroscopic factors for single-nucleon pickup reactions on the nuclei of interest. This improvement had the largest effect on the 46V transition, but also had smaller effects on other superallowed transitions, especially on those in the shell. These new corrections, which were incorporated into the most recent survey of world data ha09 , eliminated the 46V anomaly, restored the consistency with CVC and retained agreement with CKM matrix unitarity.
All these experimental and theoretical studies have proceeded under the tacit assumption that the previously accepted half-life of 46V was completely correct. Although there was no reason to suspect that this half-life result was in error, there had not been any reason to suspect that there was anything wrong with the now-discredited value either. We have addressed this potential weakness and report here on a new measurement of the 46V half-life, which confirms the average of previous measurements but is a factor of two more precise than the best of them.
II Experimental details
After making concerted efforts over several years to develop a useful titanium beam from our ECR ion-source, we employed a metal foil, 94 enriched in 47Ti, as source material and successfully obtained a 32 MeV 47Ti beam with up to 50 nA of current from the K500 superconducting cyclotron at Texas AM University. Directing this beam into a hydrogen gas target, we produced 46V via the inverse-kinematics reaction 1H(47Ti, 2)46V. The hydrogen gas cell had 4-m-thick Havar entrance and exit windows. To increase the gas density and the yield of reaction products, it was operated at liquid-nitrogen temperature and at 2-atm pressure. The fully-stripped reaction products exiting the target cell entered the Momentum Achromat Recoil Spectrometer (MARS) tr89 , where they were separated according to their charge-to-mass ratio , with 46V being selected in the focal plane.
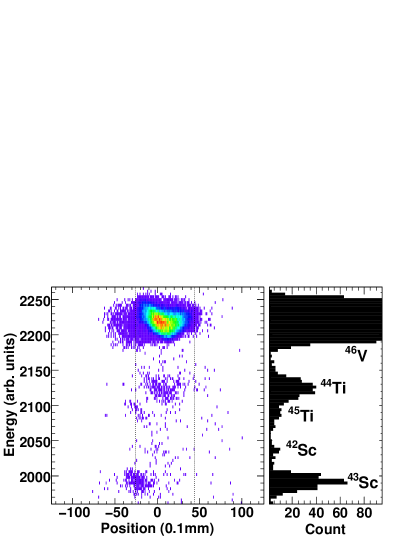
Initially working with a low-current primary beam, we inserted a 1-mm-thick 16-strip position-sensitive silicon detector (PSSD) at the focal plane of MARS. This detector was used first for the identification of secondary reaction products, then for the control of the selection and focus of 46V in the center of the beam line. As shown in Fig. 1, in addition to 46V, there were four reaction products, 42Sc ( = 680.72 ms), 43Sc ( = 3.891 h), 44Ti ( = 60.0 y) and 45Ti ( = 3.08 h), that appeared between the extraction slits and were thus weak contaminants in the extracted 46V beam. The presence of 44,45Ti and 43Sc was not problematic since their half-lives are more than four orders of magnitude longer than 423-ms 46V. Our only concern was 42Sc, another superallowed -emitter with a rather similar half-life to that of 46V. With the focal-plane acceptance slits of MARS set to a width of 7 mm, the total extracted beam contained 0.12 of 42Sc nuclei. The composition of the beam exiting MARS was checked on a daily basis during our half-life measurement: on each occasion we reinserted the PSSD at the MARS focal plane and acquired a spectrum equivalent to the one shown in Fig. 1. There were no appreciable changes observed in the extracted beam composition at any time.
We removed the PSSD and increased the primary beam intensity after the tune-up procedures were completed. The 46V beam from the extraction slits then exited the vacuum system through a 51-m-thick Kapton window, passed through a 0.3-mm-thick BC404 scintillator, where the ions were counted, and then through a stack of aluminum degraders, finally stopping in the 76-m-thick aluminized Mylar tape of a fast tape-transport system. A sample was collected in the tape for a fixed time – either 0.3 s or 0.5 s – after which the cyclotron beam was interrupted and the activity moved in 180 ms to the center of a 4 proportional gas counter located at a well-shielded area about 90 cm away. The length of the collection period was chosen to obtain an initial -particle counting rate of between 5000 and 10000 particles/sec; it was altered when necessary to compensate for changes in the primary beam intensity. The 4 proportional gas counter and associated electronics were the same as those originally described in ko97 and again in the reports of our previous half-life measurements (e.g. Refs. ia06 ; ia10 ); the gas counter was always operated in the plateau region.
Multiscaled signals from the gas counter were recorded for 10 s into two separate 500-channel time spectra, each corresponding to a different pre-set dominant dead-time. Having these two data streams allowed us to test that our dead-time corrected results were independent of the actual dead time of the circuit (see Sec. III.2). The time increment per channel for the multichannel scalars was externally controlled by a function generator accurate to 0.01 ppm and the two different non-extending dead times were continuously monitored on-line to an accuracy of 5 ns. The collect/move/count cycle timing was continuously monitored on-line as well. The cycles were repeated until the desired overall statistics had been achieved.
Before the 46V half-life measurement began, we took special precautions to reduce the effect of the 0.12% 42Sc contaminant in the 46V beam exiting from MARS. These were based on the fact that the 42Sc ions have a different range in the aluminum absorbers than do the 46V ions. To be able to make good use of this fact, we measured the amount of 46V activity collected in the Mylar tape as a function of the thickness of aluminum degraders as we changed the degrader thickness from 57.2 m to 133.4 m in increments of 6.4 m. This allowed us to determine the thickness of aluminum degraders required to place the collected 46V activity exactly midway through the tape. The thickness so determined turned out to be very close to the thickness calculated with the code SRIM zi08 and confirmed the reliability of the code in this application. We then used SRIM to determine the difference between the range of 42Sc and that of 46V, finding the former to be longer by about half the thickness of the Mylar tape. Thus, by depositing the collected 46V samples near the back of the Mylar tape we could ensure that 42Sc passed entirely through the tape. This virtually eliminated any contribution from 42Sc to our measured decay spectra. We will return to this point in Sec. III.1.
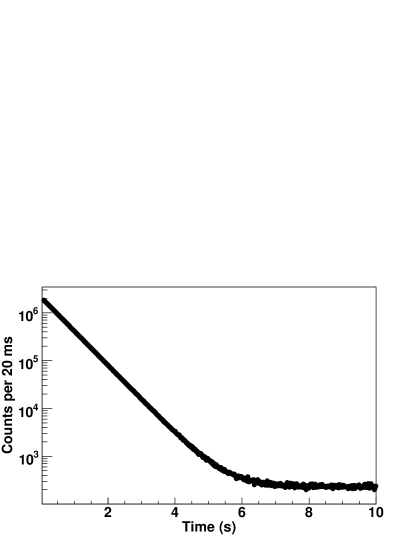
The measurement itself was subdivided into a number of separate runs so that we could thoroughly test for possible systematic effects caused by detection parameters. Run by run, we used different combinations of four dominant dead times (3, 4, 6 and 8 s), three discriminator thresholds (150, 200 and 250 mV), and two detector biases (2650 and 2750 V). In all, over 65 million events were recorded from 14422 cycles divided into 16 runs. To illustrate the overall quality of the data, we present in Fig. 2 the total time-decay spectrum obtained by combining all the runs. In our actual analysis though, we treated the data in each run separately.
As our experiment was aimed at the highest possible precision, several other special precautions were taken as well:
-
(i)
Our tape-transport system is quite consistent in placing the collected source within 3 mm of the center of the detector. However, it is a mechanical system and some exceptions occur. We monitored its performance closely by separately recording the number of nuclei detected in the BC404 scintillator at the exit from MARS during the collection period of each cycle, and the number of positrons detected in the gas counter during the subsequent count period. The ratio of the latter to the former is a sensitive measure of whether the source was seriously misplaced in the proportional counter. We used this ratio as one of the data-selection criteria in our later analysis (see Sec. III).
-
(ii)
In one run, the decay spectrum was measured with 300 s collect and detect times to probe for unanticipated longer-lived impurities. Apart from 46V and a low-level constant background, nothing was found.
-
(iii)
A background measurement was made in which all conditions were identical to those of a normal run except that the tape motion was disabled. The background rate at our shielded counting location was 1 count/s, which is 3-4 orders of magnitude lower than the initial count rate for each collected sample and is consistent with the background level observed in normal runs (see Fig. 2).
III Analysis and Results
Before analysis, we pre-selected the data based on two criteria. First, a cycle was rejected if the total number of -particles detected by the gas counter was less than 500, indicating that there had been little or no primary beam from the cyclotron during the collection period. With the rather difficult 47Ti beam this occurred quite often, so approximately 9% of the total cycles from all 16 runs were eliminated by this criterion. The second criterion we used to exclude cycles was the measured ratio of detected -particles to implanted 46V ions as observed in the BC404 scintillator. For each run we restricted the ratio to being between 90 and 100% of the maximum value obtained for that run; this ensured that the 46V sample had been centrally located in the detector. We have already shown this to be a safe range for the ratio ia10 but, to be doubly sure, we checked it again with this measurement: we found that enlarging the accepted range by a further 10% had no appreciable effect on the extracted half-life. With the 90-100% criterion applied to the ratio, another 8% of the total cycles were rejected from all 16 runs. The remaining data were then corrected cycle-by-cycle for dead-time losses, based on the method described in Ref. ko97 . The final decay spectrum for each run was then obtained from the sum of the dead-time corrected decay spectra for all accepted cycles in that run.
III.1 Sample impurity
As explained in Sec. II, 42Sc is the only impurity in the beam with the potential to affect our half-life measurement. Other weak impurities seen in the MARS focal plane have half-lives much too long to be of any concern. We confirmed this conclusion by the decay spectrum taken with 300-s collect and detect times, in which no impurities with intermediate half-lives were detected. We also explained that we located each 46V sample at the back of the collection tape to ensure that any 42Sc present in the beam passed entirely through the tape.
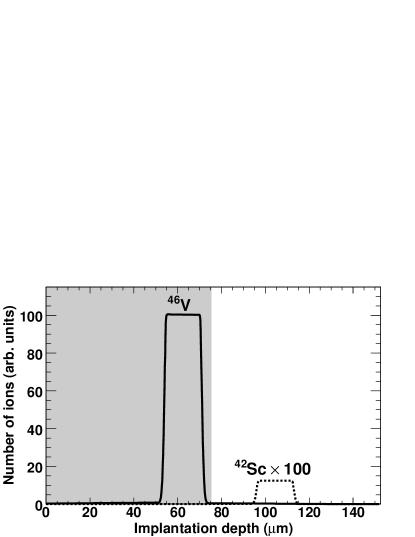
To be more quantitative, we show as the solid line in Fig. 3 a simplified functional form for the implantation depth distribution of 46V, which is consistent with the results of our scan of 46V activity versus degrader thickness (see Sec. II) and with the known momentum spread as set by the momentum slits in MARS (). We have then reproduced the shape of this empirical depth distribution as a dashed line to represent the distribution of 42Sc. The difference in depth between the two was taken from a calculation with the SRIM code zi08 and the relative magnitude was set at 0.12%, the amount we determined from our measurement with the PSSD in the MARS focal plane (see Sec. II). Although it is too small to be visible in the figure, our detailed scan of 46V activity versus degrader thickness showed evidence of a very weak tail, amounting to 1% of the total, extending to the left of the depth distribution. We take this result to be a good gauge of the upper limit for how many 42Sc nuclei could have been retained in the collection tape. With this approach we can then conclude that the 42Sc/46V ratio in the collected samples was less than 0.0015, a result that makes negligible any contribution from 42Sc to our extracted half-life for 46V.
We also used a second independent method to search for any evidence of 42Sc activity by examining the recorded time-decay spectra. We fitted each spectrum from the 16 individual runs with a function including two exponentials, one each for the decays of 46V and 42Sc, together with a constant background. In the first fit, we set the initial 42Sc/46V ratio of intensities to the 0.0015 value just obtained; set the half-life of 42Sc to its world-average value, 680.72 ms ha09 ; and extracted a half-life for 46V. Then we refitted the same 16 spectra with the initial 42Sc/46V ratio as the adjustable parameter. In this case, the half-life of 42Sc was again set to its world-average value but the 46V half-life was fixed at a range of values around the average value obtained from the first fit. We found that the 42Sc/46V ratio obtained from the fits was very insensitive to the half-life used for 46V, and that, in all cases, the ratio was less than 0.01.
In arriving at the final half-life for 46V and its uncertainty, we have adopted a very conservative range for the 42Sc/46V ratio, taking the value to be 0.006(6)%.
III.2 Time-decay analysis
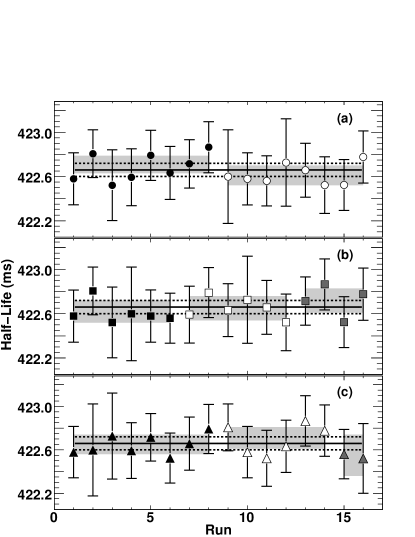
We fitted the data from each of the 16 runs separately, incorporating three components: 46V, 42Sc and a constant background. The half-life of 42Sc was fixed at its known value of 680.72 ms ha09 and, as explained in the last section, the initial activity of 42Sc relative to 46V was set at 0.006. Since each run was obtained with a different combination of detection settings, we could use the individually fitted half-lives of 46V to test for any systematic dependence on those settings. As displayed in Fig. 4, the half-life results showed no systematic dependence on detector bias voltage, discriminator threshold setting, or the dominant dead time we imposed in the electronics, the average half-life yielding a remarkably low value for the normalized of 0.2. With this degree of consistency in the data, we can be confident that any systematic dependence on detection parameters must be negligible with respect to our quoted statistical uncertainty.
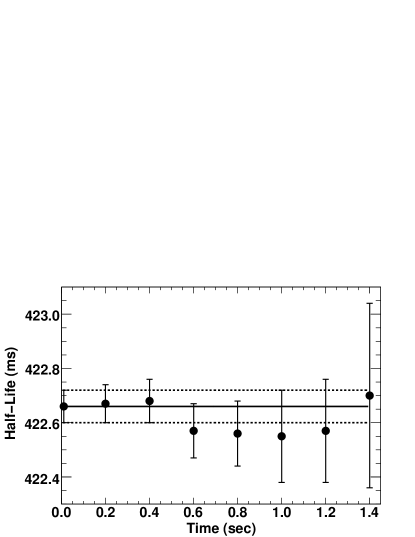
Our final systematic check was to test for unanticipated short-lived impurities in the decay spectrum or for any other evidence showing count-rate dependence of the half-life. In each run we removed data from the first 0.2 s of the counting period and fitted the remaining data; then we removed an additional 0.2 s of data and refitted again. This procedure was continued until 1.4 s of data – 3.3 half-lives of 46V – had been removed. The average half-life from all 16 runs was then obtained for each set of truncated data. The result is given in Fig. 5 where it can be seen that the half-lives so obtained were consistent with one another within statistical uncertainties.
With these possible systematic effects eliminated as significant factors, our final result for the half-life of 46V is 422.66(6) ms. As shown in Table 1, the quoted uncertainty is dominated by counting statistics since the only other identifiable contribution – from a possible 42Sc impurity – is substantially smaller even when very generous limits have been applied (see Sec. III.1).
| Source | Uncertainty (ms) |
|---|---|
| statistics | 0.06 |
| sample impurity (42Sc) | 0.02 |
| Total | 0.06 |
| 46V half-life result (ms) | 422.66(6) |
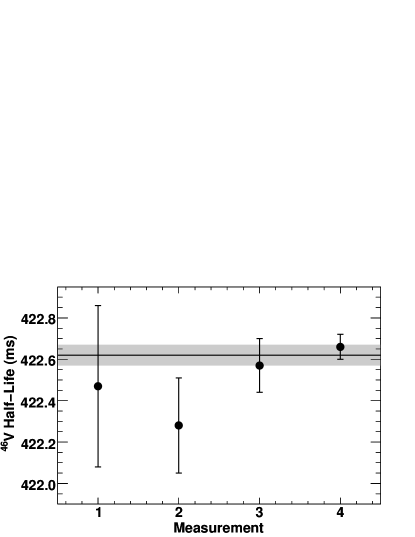
The quoted precision of our result is 0.014. There have also been three previous measurements claiming sub 0.1% precision; they yielded half-life values of 422.47(39) ms al77 , 422.28(23) ms ba77 , and 422.57(13) ms ko97 , all less precise than ours. The first two of these measurements depended on plastic scintillators to detect particles from the decay, while the third used a very similar technique to ours, with a proportional gas counter used for detection. Only the latter experiment had assured purity of the decaying sample, having employed an on-line isotope separator to produce it. These three previous results are compared with our new value in Fig. 6. All four values are statistically consistent with one another, with only the result from Ref. ba77 lying slightly outside of one standard deviation from the overall average, which is 422.62(5) ms. The normalized for the average is a satisfactory 1.0.
IV Conclusions
We have measured a new value for the half-life of the superallowed emitter 46V. Our result, 422.66(6) ms, is a factor of two more precise than the best previous result, with which it is completely consistent. If our half-life value is combined with previous measurements of the same quantity, it yields a new world average of 422.62(5) ms. The other properties of this decay – its value, branching ratio and the calculated corrections for radiative and isospin-symmetry breaking effects – have been tabulated recently in Ref. ha09 . Combining the new world-average half-life and the new value from Ref. Er11 with these tabulated values we obtain a corrected value for the 46V superallowed transition of 3074.1(26) s, where the uncertainty is dominated by the uncertainties applied to the theoretical correction terms. This result is entirely consistent with the average value of 3072.08(79) s established in the most recent survey ha09 of world data from 13 well-known superallowed transitions.
Evidently, the important experimental components of the 46V superallowed transition – its half-life and value – have now been satisfactorily confirmed and improved. The value for this transition is certainly not anomalous at the 0.08% level of precision currently quoted on that quantity.
Acknowledgements.
We thank Dr. D.P. May and Dr. G.J. Kim for developing the challenging 47Ti beam used in our measurement. This work was supported by the U.S. Department of Energy under Grant No. DE-FG03-93ER40773 and by the Robert A. Welch Foundation under Grant No. A-1397.References
- (1) I.S. Towner and J.C. Hardy, Rep. Prog. Phys. 73, 046301 (2010).
- (2) G. Savard, F. Buchinger, J.A. Clark, J.E. Crawford, S. Gulick, J.C. Hardy, A.A. Hecht, J.K.P. Lee, A.F. Levand, N.D. Scielzo, H. Sharma, K.S. Sharma, I. Tanihata, A.C.C. Villari, and Y. Wang, Phys. Rev. Lett. 95, 102501 (2005).
- (3) H. Vonach, P. Glässel, E. Huenges, P. Maier-Komor, H. Rösler, H.J. Scheerer, H. Paul, and D. Semrad, Nucl. Phys. A 278, 189 (1977).
- (4) T. Eronen, V. Elomaa, U. Hager, J. Hakala, A. Jokinen, A. Kankainen, I. Moore, H. Penttila, S. Rahaman, J. Rissanen, A. Saastamoinen, T. Sonoda, J. Aysto, J.C. Hardy, and V.S. Kolhinen, Phys. Rev. Lett. 97, 232501 (2006).
- (5) T. Faestermann, R. Hertenberger, H.-F. Wirth, R. Krücken, M. Mahgoub, and P. Maier-Komor, Eur. Phys. J. A 42, 339 (2009).
- (6) T. Eronen, D. Gorelov, J. Hakala, J.C. Hardy, A. Jokinen, A. Kankainen, V.S. Kolhinen, I.D. Moore, H. Penttila, M. Reponen, J. Rissanen, A. Saastamoinen and J. Aysto, Phys. Rev. C 83, 055501 (2011).
- (7) J.C. Hardy and I.S. Towner, Phys. Rev. C 79, 055502 (2009).
- (8) I.S. Towner and J.C. Hardy, Phys. Rev. C 77, 025501 (2008).
- (9) R.E. Tribble, R.H. Burch and C.A. Gagliardi, Nucl. Instr. and Meth. in Phys. Res. A 285, 441 (1989).
- (10) V.T. Koslowsky, E. Hagberg, J.C. Hardy, G. Savard, H. Schmeing, K.S. Sharma and X.J. Sun, Nucl. Instr. and Meth. in Phys. Res. A 401, 289 (1997).
- (11) V.E. Iacob, J.C. Hardy, J.F. Brinkley, C.A. Gagliardi, V.E. Mayes, N. Nica, M. Sanchez-Vega, G. Tabacaru, L. Trache and R.E. Tribble, Phys. Rev. C 74, 055502 (2006).
- (12) V.E. Iacob, J.C. Hardy, A. Banu, L. Chen, V.V. Golovko, J. Goodwin, V. Horvat, N. Nica, H.I. Park, L. Trache and R.E. Tribble, Phys. Rev. C 82, 035502 (2010).
- (13) J.F. Ziegler, http://www.srim.org/ (2008).
- (14) D.E. Alburger and D.H. Wilkinson, Phys. Rev. C 15, 2174 (1977).
- (15) P.H. Barker, C.J. Scofield, R.J. Petty, J.M. Freeman, S.D. Hoath, W.E. Burcham, and G.T.A. Squier, Nucl. Phys. A 275, 37 (1977).