Quantum Limiting Behaviors of a Vortex Core in an Anisotropic Gap Superconductor
Abstract
Quantized bound states at a vortex core are discretized in YNi2B2C. By using scanning tunneling spectroscopy with an unprecedented 0.1 nm spatial resolution, we find and identify the localized spectral structure, where in addition to the first main peak with a positive low energy, a second subpeak coming from the fourfold symmetric gap structure is seen inside the energy gap. Those spectral features are understood by solving the Bogoliubov-de Gennes equation for a fully three-dimensional gap structure. A particle-hole asymmetric spectrum at the core site and quantum oscillation in the spectra are clearly observed.
Quasiparticles (QPs) bound in a vortex core, such as Majorana particles, are expected to play a fundamental role in various physical situations [1, 2], ranging from the static and dynamical properties of vortex matter to quantum computation where it is required to exchange QPs bound in a core to encode a qubit through non-Abelian statistics[3, 1]. In order to isolate and manipulate those QPs, we need to identify such particles experimentally and theoretically as a first step. Namely, we need to find the quantized energy levels for QPs using spectroscopic methods, such as scanning tunneling microscopy and spectroscopy (STM/STS). This task is still far from being realized although several STM/STS experiments have probed the broad peak centered at the approximately zero-bias energy associated with the vortex bound states [4, 5], namely, the so-called Caroli-de Gennes-Matricon (CdGM) state [6], but those experiments did not resolve each discretized energy level fully quantum-mechanically. The origin of the difficulty in observing a discretized core bound state is due to the fact that (A) should be sufficiently low to satisfy the condition ( is the superconducting transition temperature and is the Fermi energy). (B) The spatial resolution of STM/STS should be sufficiently fine to see the isolated bound state. Those two conditions have not been fulfilled in the exiting STM/STS experiments.
In our previous STS study of the vortex bound state in YNi2B2C at 0.46K [5], we have observed broad peaks with electron-hole asymmetry in intensity in the tunneling spectrum around the center of the vortex core and interpreted them in terms of a quantum regime vortex core where the wave function of the hole-like bound state starts from zero at the center and that of the electron-like bound state does from the maximum. In that study, the spatial resolution was about 1 nm and the average spectra in the 22 nm2 of the vortex core were measured. Here, we have performed an STM/STS experiment at lower with an unprecedented spatial resolution (0.1 nm), expecting to clarify the quantum nature of vortex core states and to possibly observe new features such as the quantum oscillations of QPs in YNi2B2C where =15.6 K, =8.8 T, the mean free path =32 nm, the coherent length =6 nm, and the penetration depth =110 nm. We have also theoretically analyzed the obtained spectra to reveal that the STS data indeed exhibit crucial information on discretized quantum level structures.
A homemade scanning tunneling microscope can be operated at temperature down to 180 mK and at magnetic fields of up to 6 T. We used a Pt-Ir alloy wire with a diameter of 0.3 mm that was mechanically sharpened in this experiment. Before cooling down the sample, we checked the tip condition over the Au film. STS measurement was conducted simultaneously with STM measurement. Using STM, we scanned the sample for a wide surface where the square lattice can be seen. We chose a suitable spot and size range for the STS measurement. Bias voltage and feedback current were set before the measurement. We measured the - characteristics of the sample and numerically calculated the differentiation of the - characteristics to find the differential conductance. We normalized with the slope of the - characteristics by fitting it linearly. Then the vortex was imaged by plotting the value of at various biases.
In YNi2B2C, a variety of experiments [8, 7, 9] have shown on the existence of point nodes, such as angle-resolved specific heat [7] and thermal conductivity [8]. From an STS experiment, the tunneling spectrum was found to have an dependence near in the superconducting gap at zero magnetic field. In order to explain the dependence, the existence of point nodes with the asymmetric recovery and the need for 3D calculation were proposed [10]. Angle-resolved photoemission measurement shows a strong gap magnitude variation on the cylindrical Fermi surface in the 17th band at the X point of the tetragonal Brillouin zone of this material [9]. It is known that a two-dimensional -wave nodal gap does not yield an isolated vortex bound state inside the bulk gap because all the low-energy wave functions are extended, leaking out from the nodal directions [11], in contrast to the isotropic -wave gap [12]. Thus, it is not clear whether the point node case exhibits the CdGM like bound state.
Our analytic strategy is to solve the Bogoliubov-de Gennes (BdG) equation in three dimensions (3D) for various possible 3D gap functions, including the point node gap function on a cylindrical Fermi surface. The BdG formalism deals with the quantum limiting regime beyond the quasiclassical approximation [13, 16, 15, 14] in the sense of the accessibility to discretized eigenstates and their quantum oscillation with the order of lattice spacing.
In general, the BdG equation in spin singlet superconducting states is given as
| (3) | |||
| (4) |
where the single particle Hamiltonian and the QP wave function with the Fermi energy . The pair potential is decomposed into in the center-of-mass coordinate , where , and the gap function in the relative coordinate . Here, we consider the single vortex state described as , where the coherence length and the azimuthal angle . In this model, the wave number becomes a well-defined quantum number because of the translation symmetry along the -axis. The BdG equation (3) is reduced to the -resolved two-dimensional form
| (7) | |||
| (8) |
where and . The two-dimensional form of the Fermi energy reflects the -cross section of the Fermi surface. The index denotes the -th excited state of the -resolved BdG equation, eq. (7). The gap function is obtained from in the -space by performing the fast Fourier transform. We can solve the BdG equation for the arbitrary anisotropic function . Then, we obtain the QP local density of states (LDOS)
with the Lorentzian function . is adjusted to compare the experimental data of the STS measurements below. The procedure of the numerical diagonalization of the BdG equation is explained in ref. References.
It is considered that the gap function of YNi2B2C is suppressed at four points, where nesting vectors exist [18, 15]. We parametrize the gap function as
| (9) |
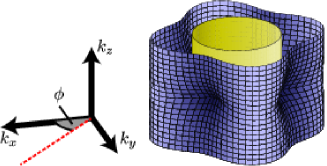
where the angle and in-plane gap minimum . This gap function is equivalent to the -wave gap [18] function in the plane, and the parameters , , and signify how rapidly the point nodes at the and plane recover the full gap with increasing toward the Brillouin zone boundary at . We choose the cylindrical Fermi surface as the first approximation, where is constant. This is because we focus on the 17th Fermi surface around the X point of YNi2B2C, which does not close in the Brillouin zone as obtained by the band calculation [19]. Figure 1 shows a three-dimensional view of along with the cylindrical Fermi surface. As we will see later, the combination of the Fermi surface shape and the gap function along the direction is crucial for reproducing the STS data. We carry out the calculation within the quantum limit regime . In the case of the YNi2B2C, the direction of the Fermi velocity at gap nodes [19] is different by from that of the wave vector , so that the low-energy QP spectrum rotates by from the isotropic case [16]. Thus, the spectrum along the [110] ([100])-axis in our experiments corresponds to that along the in our calculations.
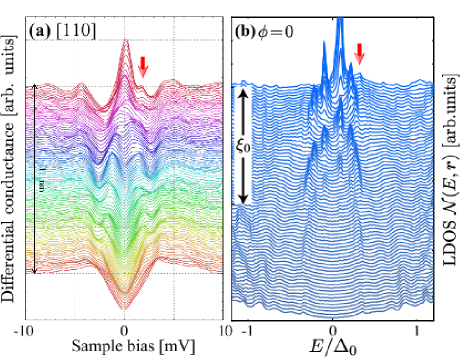
Figure 2 shows the experimental (a) and theoretical (b) spectral evolutions along the directions (a) [110] and (b) . In the experimental data shown in Fig. 2(a), it is evident to see that (i) the main peak at the core is situated on the positive energy side of about 0.3 meV with an asymmetric shape. (ii) The 2nd peak at the core site exists at the positive bias meV, marked with the arrow in Fig. 2(a). (iii) The spatial modulated behavior appears on the evolution ridge. We note that the average of the present STS data with a 0.1 nm spatial resolution in a 22 nm2 well reproduces the previous STS results of tunneling spectra by Nishimori [5] These features (i)-(iii) are supported by the numerical calculation shown in Fig. 2(b). In particular, in Fig. 2(b), the feature (iii) is interpreted as the quantum oscillations of the peak intensities associated with several lower energy excitations. We also find that (iv) quantum oscillation depends on either the or direction. The finite energy spectrum near in the direction extend longer than that in the direction. This angular dependence is also shown in the experimental data as the difference between the evolution of the [110] and [100] directions. These consistencies with the theory denote that the experimental data in Fig. 2 shows the quantum limiting behaviors of the vortex core bound states whose discreteness is specified by the energy scale . It is also found that the spherical or ellipsoidal Fermi surface smoothens the quantum oscillation of the LDOS. Hence, the cylindrical Fermi surface is necessary for the quantum oscillation.
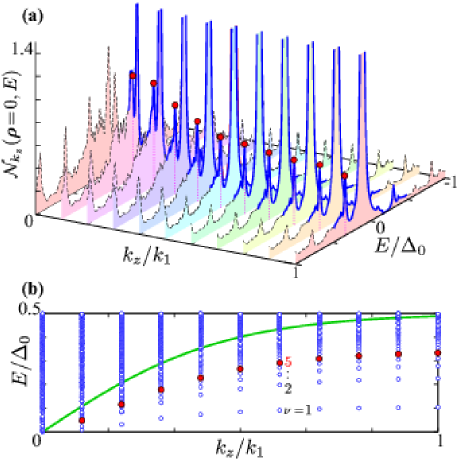
It is emphasized that the 2nd peak that appears at , shown in Fig. 2(b), is a consequence of the rotational symmetry due to the point nodes and is never seen in the LDOS of isotropic -wave superconductors [12]. In order to understand the physical origin of the 2nd peak, we decompose the spectrum into the -resolved spectra as shown in Fig. 3(a), where the -resolved spectra at the core are shown. The strong peak at is associated with the lowest bound state . This peak becomes stronger and shifts to the positive side as increases because the gap becomes wider. Simultaneously, the 2nd peak at grows and is distinctly separated from the main peak when . Figure 3(b) shows the -resolved eigenenergy of the BdG equation eq. (7). At , where the in-plane gap minimum is , the spectrum is continuous, and the eigenstates with lower than the gap minimum become discrete with increasing . The eigenenergy is marked in Fig. 3 with filled symbols, which consists of the 2nd peak in the LDOS.
The physical origin is explained as follows. As , which is the limit of a two-dimensional isotropic -wave case [12], the branches of the eigenstates approach the eigenstates quantized by the angular momentum with the energy , where , and the wave function near the vortex core, where is the Bessel function [6, 12]. The only state has a nonzero core-site wave function . When , however, the fourfold rotationally symmetric pair potential hybridizes with the eigenstates with the angular momentum () [13]. Thus, the state can be hybridized to the states, which are realized as the states described as
| (10) |
This contribution of the state in the wave function is the origin of the 2nd peak of the core-site LDOS. The peak arising from the state is most enhanced because the state is the nearest-energy state from the state. Although there are peaks from the states in the -resolved core-site LDOS, these peaks cannot be seen in Fig. 2(a) or 2(b) with the integration.
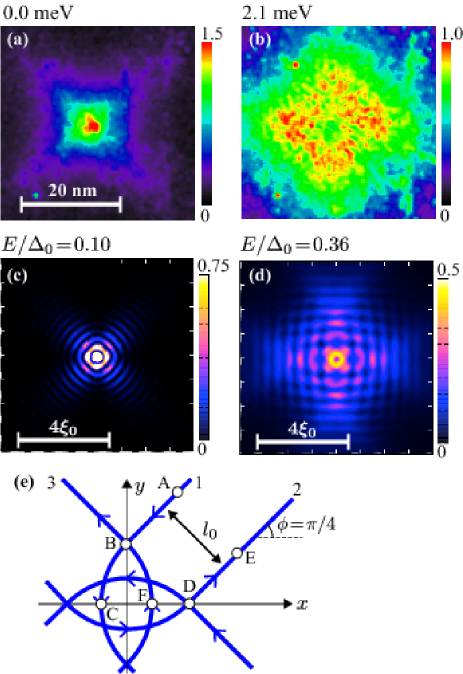
Next, we move to the two-dimensional profile of the LDOS. Figure 4 shows that the experimental and theoretical two-dimensional LDOSs with different energies. It is known that the LDOS has a long tail along the nodal direction near ; as the energy increases, the direction of the tails rotates to in the case of the fourfold rotationally symmetric gap function at low energies. The corresponding theoretical LDOS is shown in Figs. 4(c) and 4(d) where clear two-dimensional quantum oscillations are observed. Although in Figs. 4(a) and 4(b) those two-dimensional oscillations are hardly visible owing to the lack of spatial resolution in this case, the quantum oscillations are well anticipated from Fig. 2(a) where the linear line cut of the two-dimensional LDOS with the finest spatial resolution is displayed. On the other hand, the depleted spectral weight on the vortex center and the surrounding four peaks observed in Fig. 4(b) are not reproduced in the theoretical LDOS in Fig. 4(d), because of the technical difficulty in the numerical diagonalization.
The two-dimensional oscillatory behaviors are understandable with the schematic picture of the QP path shown in Fig. 4(e). In the fourfold rotationally symmetric gap function, the low-energy QPs move from the direction to the direction around the vortex core [13, 16, 15, 14]. The interference between the wave functions of the countercurrent QPs leads to a standing wave, that is, the oscillation of the LDOS. When the energy is and the distance is in Fig. 4(e), the QP “1” moving from A to B and the QP “2” moving from D to E interfere with each other. The resulting wavefront direction of the standing wave is , as shown in Fig. 4(c). On the other hand, when the energy becomes larger, the distance between paths becomes as large as with the growth of the impact parameter. The large allows the formation of the interference pattern by the QP “1” moving from B to C and the QP “3” moving from F to B in Fig. 4(e). Thus, the LDOS oscillation pattern appears along the direction in the high-energy region , as shown in Fig. 4(d). The change in the orientation of the LDOS is clearly observed in the experimental results in Fig. 4. The observation of the rotation of the oscillation pattern remains a future problem.
We have performed STM/STS experiments on YNi2B2C under an unprecedented spatial resolution of 0.1 nm at low temperatures. Through the full quantum mechanical analysis based on the Bogoliubov-de Gennes equation for three-dimensional gap structures, we have succeeded in identifying at the core position the quantized bound state at a positive energy as the first peak with the particle-hole asymmetric shape. We have also found the second peak induced by the fourfold symmetric gap structure. This is the first experimental observation of clearly discretized Caroli-de Gennes-Matricon vortex bound states. We conclude that, in reciprocal space, the point node positions correspond to the continuum spectra with a zero energy, while the gapped positions give rise to discrete spectra. Note that the energy of first peak at the vortex core center meV in Fig. 2(a) is much larger than , where the Fermi energy is eV. However, if we estimate that as , where the experimentally obtained value is , the resulting is reasonable. One of the reasons for the discrepancy between these estimates is that the realistic dispersion relations of YNi2B2C differ from the free electron model used in our analysis. In order to achieve quantitative estimates, one should take into account the realistic dispersion relations.
We are grateful to M. Ichioka for stimulating discussions. This work was supported in part by the 21st Century G-COE Program of Tokyo Tech ”Nano Science and Quantum Physics”, JSPS (No. 2200247703, 2074023303, 2134010303), and the “Topological Quantum Phenomena” (No. 22103005) and the ”Heavy Electrons” (NO. 20102006) KAKENHI in innovation areas from MEXT.
References
- [1] C. Nayak, S. H. Simon, A. Stern, M. Freedman, and S. Das Sarma: Rev. Mod. Phys. 80 (2008) 1083.
- [2] M. Z. Hasan and C. L. Kane: Rev. Mod. Phys. 82 (2010) 2045.
- [3] D. A. Ivanov: Phys. Rev. Lett. 86 (2001) 268.
- [4] H. F. Hess, R. B. Robinson, R. C. Dynes, J. M. Valles, and J. V. Waszczak: Phys. Rev. Lett. 62 (1989) 214.
- [5] H. Nishimori, K. Uchiyama, S. Kaneko, A. Tokura, H. Takeya, K. Hirata, and N. Nishida: J. Phys. Soc. Jpn. 73 (2004) 3247.
- [6] C. Caroli, P. G. de Gennes, and J. Matricon: Phys. Lett. 9 (1964) 307.
- [7] T. Park, M. B. Salamon, E. M. Choi, H. J. Kim, and S. I. Lee: Phys. Rev. Lett. 90 (2003) 177001.
- [8] K. Izawa, K. Kamata, Y. Nakajima, Y. Matsuda, T. Watanabe, M. Nohara, H. Takagi, P. Thalmeier, and K. Maki: Phys. Rev. Lett. 89 (2002) 137006.
- [9] T. Baba, T. Yokoya, S. Tsuda, T. Watanabe, M. Nohara, H. Takagi, T. Oguchi, and S. Shin: Phys. Rev. B 81 (2010) 180509(R).
- [10] H. Nishimori: Dr. Thesis, Department of physics, Tokyo Institute of Technology, Tokyo (2005) [in Japanese].
- [11] M. Franz and Z. Tešanović: Phys. Rev. Lett 80 (1998) 4763.
- [12] N. Hayashi, T. Isoshima, M. Ichioka, and K. Machida: Phys. Rev. Lett. 80 (1998) 2921.
- [13] M. Ichioka, N. Hayashi, N. Enomoto, and K. Machida: Phys. Rev. B 53 (1996) 15316.
- [14] N. Hayashi, M. Ichioka, and K. Machida: Phys. Rev. Lett. 77 (1996) 4074.
- [15] Y. Nagai, Y. Ueno, Y. Kato, and N. Hayashi: J. Phys. Soc. Jpn. 75 (2006) 104701.
- [16] Y. Nagai, Y. Kato, N. Hayashi, K. Yamauchi, and H. Harima: Phys. Rev. B 76 (2007) 214514.
- [17] T. Mizushima and K. Machida: Phys. Rev. A 82 (2010) 023624; J. Low Temp. Phys. 162 (2011) 204.
- [18] K. Maki, P. Thalmeier, and H. Won: Phys. Rev. B 65 (2002) 140502(R).
- [19] K. Yamauchi, H. Katayama-Yoshida, A. Yanase, and H. Harima: Physica C 412-414 (2004) 225.