Czech Republic
11email: skoda@sunstel.asu.cas.cz
Identification of important VO spectral services benefiting from deployment on the Grid
Abstract
The majority of VO-compatible spectra handling applications operates only with a few spectra entirely downloaded from single or several SSAP servers. We try to identify the scientific cases which could immediately benefit from future SSAP applications designed for GRID deployment. Their key feature is the sophisticated spectra pre-selection and preprocessing done on distributed servers using the intelligent agent summarising the results and performing final high-level processing or analysis.
keywords:
Techniques:spectroscopic – Grid – Virtual Observatory1 Introduction
There is a wealth of calibrated astronomical spectra accessible in current data archives, however most of them are not suitable for direct physical analysis. Being pre-reduced by some automatic pipeline or individually by manual reduction, they are mostly stored in archives in form of FITS file or ASCII table as the relation of intensity in arbitrary numbers (instrumental counts, digital numbers etc.) and wavelength (or frequency).
The scientific analysis of such spectra requires further processing by the variety of different methods. In certain studies a huge number of spectra has to be collected from different servers (e.g. in different spectral regions ) and transformed into common units.
The clear definition of metadata description and easy unit conversion as well as transparent lookup and download of spectra in Virtual Observatory has a great potential to become a new advanced way of astronomical research. The connection of powerful distributed computing available by GRID, Web Services and VO protocols can establish an innovative research environment allowing the data mining of huge datasets.
2 Current status of VO tools for spectroscopy
Although there is a number of various tools written for the analysis of spectra of astronomical objects (e.g IRAF packages splot and spectool, Starlink DIPSO, MIDAS XALICE as well as numerous single-purpose C, FORTRAN and IDL routines), the number of modern tools understanding the VO protocols (especially spectra access protocol - SSAP) is still very low. We are giving a brief overview of their capabilities and status of development (in July 2008).
2.1 VOSpec
http://esavo.esa.int/vospec/
-
•
Developed at ESA
-
•
Very simple (mainly for building SED)
-
•
Polynomial and Gaussian fits only
-
•
Blackbody fit
-
•
No RV measurement built-in
-
•
It can be called directly from VizieR
-
•
Can work with linelists through Simple Line Access Protocol (SLAP)
-
•
Theoretical VO (TVO) supported (synthetic spectra: Kurucz, disks)
-
•
Rapid development
-
•
Integration of some methods in users own program possible
-
•
JAVA applet
-
•
Contains PLASTIC VO-interoperability layer
-
•
De-reddening of extragalactic objects built-in
-
•
Support of dimensional equations for units (DIMEQ, SCALEQ)
-
•
Rather complicated view of users data - needs to create SSA wrapper and prepare VOTable even for one simple FITS spectrum before viewing
2.2 SpecView
http://www.stsci.edu/resources/
software_hardware/specview
-
•
It is available as JAVA applet or stand-alone application
-
•
Developed and supported by STScI
-
•
Understands a number of formats from HST instruments and most NASA/ESA satellites
-
•
Easy work with local data (binary or ASCII tables and 1D FITS)
-
•
Well tailored for practical spectral analysis
-
•
Powerful linelists (many included)
-
•
Fitting of models by — even user models may be constructed
-
•
Built-in number of standard stars spectra and models for various physical conditions
-
•
Whole Kurucz library of spectra available for immediate display.
-
•
Only simple polynomials for visual fit available
-
•
De-reddening, CLOUDY models built-in
-
•
Proper error propagation of fitted values
-
•
Support of dimensional equations
-
•
Does not support PLASTIC
2.3 SPLAT-VO
http://star-www.dur.ac.uk/~pdraper/
splat/splat-vo/
-
•
Supported by JCMT after closing Starlink
-
•
Most advanced for stellar astronomy (fitting by freehand drawing, INTEP)
-
•
RV measurement - both Gaussian fit and mirroring
-
•
Custom line list for individual spectra available
-
•
Wavelet analysis
-
•
Full featured data and editor and spreadsheet
-
•
Publication quality output, powerful plotting options, annotations
-
•
Supported PLASTIC
-
•
Reads 1D FITS image files (e.g. rebinned IRAF multispec files)
-
•
Asynchronous SSAP queries
2.4 Period04
http://www.univie.ac.at/tops/Period04/
-
•
Its predecessor was widely used Period98
-
•
Period04 is rewritten in Java (and partly C)
-
•
Needs formatted text files
-
•
supports VOTable files
-
•
Several period finding methods built-in
-
•
Can handle even the regular period shifts
-
•
PLASTIC layer under preparation
2.5 FROG
http://www.jach.hawaii.edu/software/
starlink/
-
•
Part of Starlink Java package
-
•
Included in last JCMT Starlink release (Hokulei)
-
•
VO-protocols built-in
-
•
Almost same capabilities as Period04
-
•
Not developed after closing Starlink
-
•
Last version since 2004
-
•
The period searching engine available remotely as a SOAP service
-
•
Web service for Fourier transform
-
•
Collaborates with TOPCAT, but not PLASTIC
-
•
Easy but powerful for doing period analysis in VO environment
2.6 SDDS Spectrum Services
http://voservices.net/spectrum
-
•
Advanced access and visualization of Sloan spectra
-
•
Search of similar spectra using PCA method
-
•
Several continuum and line fitting procedures
-
•
Programmable interface available but in .Net or Mono framework
-
•
Collaboration with other SSA servers not supported - Only SDSS data at JHU
3 Spectra post-processing
The current VO applications using SSA protocol are very simple providing only the URL of the given dataset, so the client gets a whole (often quite large) file. The further processing is then done fully by the client who has to download all the relevant datasets and keep them in the memory or local storage. The real strength of the VO technology lies, however, in transferring part of the client’s work to the server, which usually runs on a powerful machine with fast connection to the data archives. The typical example of commonly required post-processing of fully reduced spectra (at least in stellar astronomy) are given below:
-
•
Cutout services (selection of only certain spectral lines or regions giving the wavelength range)
-
•
Projection of multidimensional datasets (in 3D spectroscopy)
-
•
Rectification of continuum
-
•
Rebinning to given, usually equidistant grid of wavelengths (constant or )
-
•
(De)convolution of instrumental profile
-
•
Application of physical broadening functions (rotation, limb darkening)
-
•
Shift in radial velocity, application of heliocentric correction computed on server
-
•
Merging of individual echelle orders in a single spectrum
Although most of these post-processing methods can be implemented in a straightforward way, the rectification of continua may be a difficult art or black magic. Especially two problems are most common and most difficult to solve easily.
Normalising echelle spectra
A really challenging problem (which had not yet been solved fully) is the
normalisation of echelle spectra - especially with wide absorption lines or
complicated profiles (P Cyg, Be stars). Some wide lines may span several
echelle orders and so the individual orders have to be precisely unblazed and
then merged. This problem is very complex, depending on construction of
individual spectrograph, the observation strategy etc. The explanation of
problem and partly the solution is given by Škoda & Hensberge (2003),
Škoda & Šlechta (2004), Prugniel & Soubiran (2001) or
Erspamer & North (2002).
fitting procedures
The more advanced way of normalising is the least squares fitting based on some
theoretical model. It is very popular in radioastronomy and X-ray astronomy (XSPEC)
rather for estimation of the global SED fit parameters (usually only as
combination of several simple power law functions). Quite useful in optical
spectroscopy is the usage of appropriate synthetic spectrum to find the real
continuum in data. The implementation of such a procedure in VO tools could
call the Theory VO (TVO) servers to get correct models (e.g. Kurucz) and, if
necessary, to improve the models by recomputing on the GRID in a iterative way.
Unfortunately, the models of many interesting objects are very speculative.
4 Advanced spectral analysis
As the goal of VO is to make easy and comfortable the physical analysis of a huge number of fully reduced (and post-processed) spectra in the environment of VO client (or web portal), the common recipes of spectral analysis have to be implemented as VO-compatible. While the simplest ones may be done by client, the full power of VO may be exploited only by their implementation on server side (and best deployed on GRID due to their inherent independencies). Here are the examples of most commonly used techniques of spectra analysis in the stellar astronomy:
4.1 Dynamical spectrum
It is sometimes called the gray representation or trailed spectrum. The basic idea is to find the small time-dependent deviations of individual line profiles from some average.
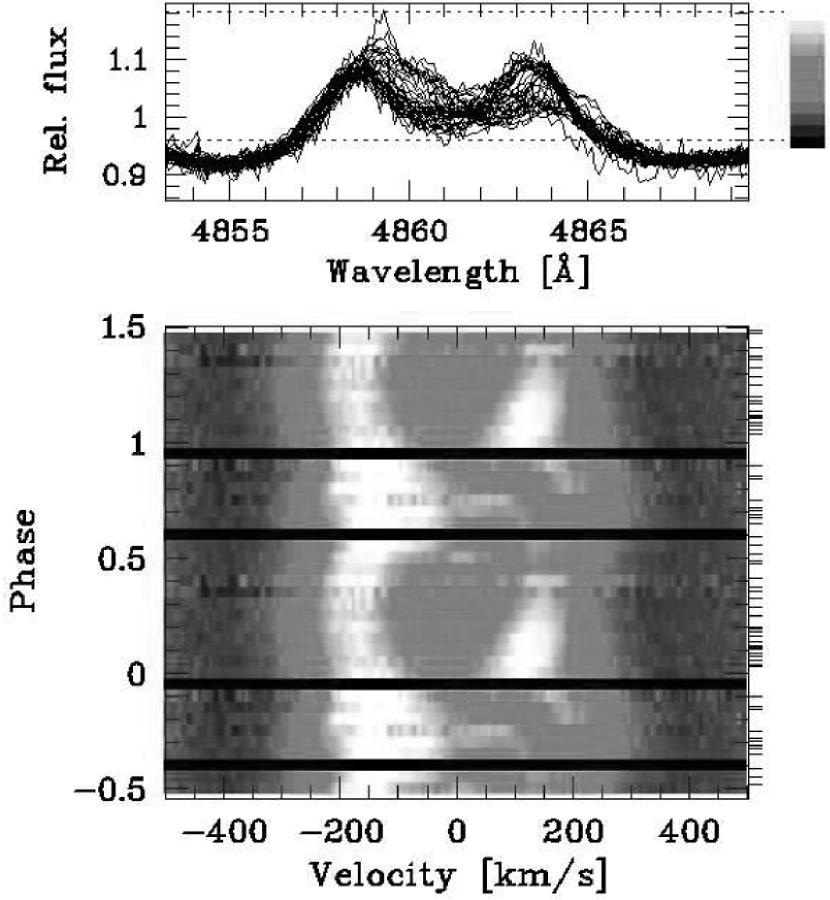
First the average of many high dispersion high SNR spectra (with removal of outliers) is prepared (called template spectrum). Then each individual spectrum in time series is either divided by the template (quotient spectrum) or the template is subtracted from it (the differential spectrum). The group of similar resulting intensities is given the same colour or level of gray. See Fig. 1. More examples may be found e.g. in de Jong et al. (1999), Maintz (2003) or Uytterhoeven (2004).
The result is drawn in 2D image where on horizontal axis is a wavelength in the line profile or corresponding RV relative to laboratory wavelength, on the vertical axis the time of middle of observation (in HJD) or the circular phase when the data are folded with certain period.
4.2 Measurement of radial velocity and higher moments of line profile
The one of the important information received from spectrum is the radial velocity (RV) of the object. From its changes the binarity can be revealed, or the possession of extrasolar planet. RV is sometimes presented as zero-th moment of the spectral line profile. The higher moments of the line profile are important as well. The first moment is equivalent width. The combination of higher moments of line profile is a one of the possible ways of determination of non radial pulsation modes – numbers (Aerts et al., 1992). The RV is usually measured from single lines (by finding their centre using fits or mirroring) or from part of spectrum by cross-correlation techniques using the template spectra (observed or synthetic) of similar object.
4.3 Measurement of equivalent width
The Equivalent width (EW) of the spectral line gives the information about the number of absorbing or emitting atoms of given element. The measurement of equivalent width (EW) of a given line needs the determination of area bordered by line profile and the continuum. This area is transformed to the rectangular line with the depth of 1.0. The width of this rectangle is called equivalent width. Emission lines by definition have negative EW. The changes in EW during time may bring about the information about the dynamic evolution of the target and may be subjected to period analysis.
Due to its dependency on continuum placement, a problem of automatic rectification arises again. It is extremely difficult on echelle spectra and spectra of late type stars. If not rectified properly, the extremely shallow lines may give large error in EW (Vrancken et al., 1997).
EW are often used in abundance analysis. A good check of correct normalisation is the comparison of EW of spectral lines of the same element in different spectral regions (Hensberge et al., 2000).
Some attempts of automatic rectification have been proposed eg. by Zhao et al. (2006) but in general another kind of information (synthetic spectrum or template from other instrument) is required.
The measurement of EW of a number of lines in thousands of spectra may be accomplished as a VO service and run in parallel on a GRID.
4.4 Bisector analysis
It is a method describing quantitatively the tiny asymmetry or subtle changes in line profiles. It is easily done by marking the middle of horizontal cuts of profile in different line depths. The line connecting such points (called bisector) is then zoomed in horizontal (wavelength or RV) direction. See Fig. 2.
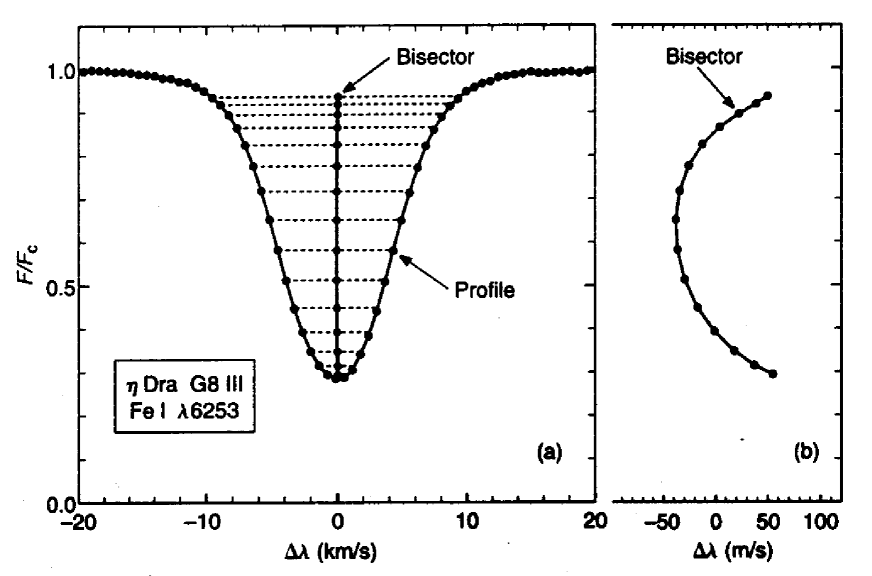
The characteristic shape of bisector gives the information about turbulence fields (e.g. convection) in stellar photosphere, characterised by the value of micro-turbulent velocity (Gray, 1982, 2005) or about other processes causing the tiny profile asymmetry. It has been used successfully for searching of extrasolar planets (Povich et al., 2001) or in asteroseismology. Requires high resolution (echelle) and high SNR normalised spectra.
4.5 Period Analysis
One of the most popular methods used in astronomy is the period analysis. Its aim is to find the hidden periods of variability of given object. Sometimes this period can be identified with some physical mechanism (e.g. orbital period of binaries, rotational modulation or pulsations). Wide range of objects show the multi-periodicity on various time scales (e.g. binary with pulsating components). Ones the suspected period is found, the data may be folded accordingly, plotted in circular phase corresponding this period. Very helpful is a interactive capability of showing data folded while selecting different peaks at the periodogram.
The current availability of VO tools is limited. The nice FROG (part of Starlink new Java-based development) is abandoned and so the only hope is the Period04 by P. Lenz, who is working on the PLASTIC compatible data exchange of VO tables (Lenz, 2008, private communication).
Periodogram of line profiles. It is a kind of gray representation with period on vertical axis and the zoomed line profile on horizontal. See Fig. 3. Works well for analysis of multi-periodical non-radial pulsations (de Jong et al., 1999).

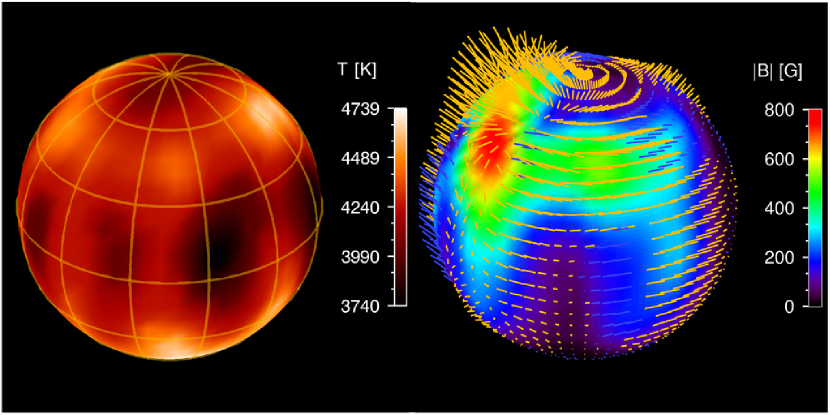
4.6 Doppler imaging
It was introduced by Vogt & Penrod (1983a) as a method allowing the surface mapping of stellar spots. First test were done on stars of RS CVn type and on Oph (Vogt & Penrod, 1983b). Works well on rapid rotators and needs a high resolution spectra with very high SNR (300–500). Tho whole rotational period should be covered well, better several times. When all the requirements are met, the map of surface features (spots, nodes of non radial pulsations) is obtained with very high accuracy. See the left panel of Fig. 4.
4.7 Zeeman Doppler Imaging
Quite complicated processing of spectra is required for study of stellar magnetic fields. The estimation of magnetic field from polarimetry using the Zeeman phenomena involves the processing of long series of homogeneous spectra to be accomplished in parallel with extreme precision and requires again the information from synthetic models (simulation of Stokes parameters on simulated magnetic stars) The nice example is the model of II Peg by Strassmeier (2008). See the right panel of Fig. 4.
4.8 Spectra disentangling
This method allows to separate the spectra of individual stars in binary or multiple systems and simultaneously to find orbital parameters of the system, even in case of heavy blending of lines. It supposes the changes in line profile are caused only by combination of Doppler shifted components (no intrinsic variability of star). The best solution of orbital parameters and disentangled line profiles of individual stellar components are found by least square global minimisation. The method also enables to remove the telluric lines with great precision. The good orbital coverage and the estimate of orbital parameters is required. Two approaches exist:
Wavelength space disentangling
developed by Bagnuolo & Gies (1991) and improved by
Simon & Sturm (1994). It needs a large memory to store sparse matrices,
requires large computing power. It is more straightforward to understand the
results and sources of errors.
Fourier space disentangling
introduced by Hadrava (1995, 1997) in
program KOREL. Another program available today (still based on KOREL ideas) is
FDBINARY (Ilijic et al., 2004). They work in Fourier space, and
transform the wavelengths into . They solve a small amount of
linear equations, so they are memory savvy and can be run on even small
computer. The method, however, requires perfect continuum fit (difficult to
achieve at merged echelle spectra). On unreliably rectified spectra strange
artifacts may appear (Ilijic et al., 2004).
4.9 Deconvolution of Iodine lines
One of the new approaches to high precision radial velocity measurement is the usage of Iodine vapour cells in front of the spectrograph. The idea is to use the huge amount of sharp Iodine lines as a ruler for marking exact position of investigated stellar line thus eliminating the instrumental shifts.
However, the Iodine lines have to be first removed from spectra to see the stellar ones. The process is not so straightforward and requires the models and templates from high resolution Fourier Transform Spectrographs as well as exposures without the cell. Finally the global optimization (e.g. by maximum entropy method) is required. See e.g. Martínez Fiorenzano (2006).
4.10 Classification of stellar spectra
It is a one of the methods where the full power of the Virtual observatory infrastructure could be exploited to work on massive data volumes. The goal is to assign to every spectrum a short string of letters and numbers representing the physical characteristics of the star (surface temperature, size, mass, peculiar behaviour etc.).
It used to be a time consuming method done by visual comparison of many spectra from photographic plates (e.g. MKK classification). Today it has been done finding the minimal differences between a grid of template (or even synthetic) spectra and the examined one. The techniques of artificial intelligence (e.g. neural networks, genetic algorithms, self-organizing maps, cluster analysis techniques) may be very efficient, but the global optimization using the minimization seems to be more reliable with possibility of iterative control. An example of automatic classification engine for white dwarfs is described by Winter (2006).
As it can be seen, the algorithm can run in parallel and uses workflows, so it may be nicely implemented as Grid application of VO services.
5 Spectral analysis in Grid supported VO services
5.1 Workflows and pipelines
Many astronomical legacy applications are designed to run as a single task on local PC, the exchange of results with other tools is done over the local files and a processing is driven by a set of parameters. Some packages have to be run as separate tasks in given order as some task are dependent on a information written to the processed file by the preceding tasks.
So the work has to be done in a strictly serial manner — step by step. Thus the idea of workflows is quite natural for the most of scientist’s work but there is a strong reluctance of astronomers (driven by a strong conservatism and habits) to use modern workflow builders/executors in the data reduction or spectra analysis. The certain level of workflow management is accepted for distributed computing of models on clusters — usually using batch queue scheduler scripts either on GRID or on institutional network of PC (e.g. Condor, Beowulf).
5.2 Massive parallel spectra reduction
The processing of spectra coming from current sophisticated spectrographs is a quite computer demanding task and thus may be the good candidate for processing on GRID. Especially the rigorously correct reduction of echelle spectra requiring the non-linear Least Squares optimization (Piskunov & Valenti, 2002) or even the estimate of background light model (Churchil & Allen, 1995) for the hundreds of echelle exposures would benefit from GRID as it can be run in parallel for all frames using the same calibrations (flat, bias) and templates (order position, aperture estimates). Some pipeplines are already written using the concept of workflows (e.g. Gasgano, Reflex for ESO UVES and FORS spectrograph, respectively).
5.3 Advantages of VO services
The key VO feature, that allows the novel approach to the everyday scientific work and thus promises new discoveries, is the interoperability of all VO-compatible tools and common format for describing metadata (VOTable).
It allows (in principle) the most of current work of an astronomer to be done in one GUI which can provide an transparent access to VO tools accomplishing all of the most tedious and routine work:
The VO infrastructure enables transparent search, download and on-the-fly conversion of data, unified presentation of different relations from multi-dimensional datasets, the complicated reduction and analysis tasks to be done in background or deployed on GRID, the results may be stored directly in databases or staged on virtual network home space (like MySpace). The most sophisticated data processing may be implemented in the form of web services (WS).
Although most of the methods described may be (and have been) run in local environment using the legacy astronomical application, their implementation as VO services would benefit from the VO infrastructure and might allow the analysis of a huge amount of data easily. The key issues in VO approach are the
-
•
Unified data format (VO-Table, semantics of variables)
-
•
Quick search for available data in a global manner using SSAP and registries
-
•
Transparent data conversion, homogenization, rescaling
-
•
Powerful presentation with remote data and theoretical results (TVO)
-
•
Staging disks with virtual home (VOSpace, MySpace)
Combining the VO infrastructure power and the easy and transparent high performance computing on GRID will allow the advanced analysis of large spectral surveys feasible in a reasonable time. It may force even the kind of serendipitous research — e.g. you may click on star in the image of globular cluster to see its dynamic spectra folded with estimated period.
6 Killer spectral applications for VO
Here we give some scientific cases that may be the killer applications forcing the stellar astronomers to use the VO tools suggested above despite their current reluctance and hesitation:
-
•
Use VO to find all stars with emission in given line, find the time when it was in emission and plot the time evolution of its EW.
-
•
Use VO to get 1000 or more spectra of the given object, cut out regions around given lines, plot the lines, make a gray dynamic spectrum folded in time
-
•
The same, but fold by period clicked on interactive periodogram
-
•
Get the unknown lines identification of piece of spectra from theoretical observatory (Simple line access protocol) having the line selection limited by pre-estimated temperature (using Saha equation)
-
•
Create light and radial velocity curve of a binary star for given period (estimated by other VO tool running in parallel and exchanging data over PLASTIC)
-
•
Fit the grid of models () to the observed spectrum for many stars (e.g. from given cluster)
7 Conclusions
Astronomical spectroscopy uses a wide range of techniques with different level of complexity to achieve its final goal — to estimate the most precise and reliable information about celestial objects. The large part of spectroscopic analysis today has been accomplished by several independent non VO-compatible legacy packages, where each works with different local files in its own data format. Analysis of large number of spectra is thus very tedious work requiring good data bookkeeping.
Accomplishing the analysis in VO infrastructure may benefit from automatic aggregation of distributed archive resources (e.g. the multispectral research), seamless on-the-fly data conversion, common interoperability of all tools (using PLASTIC protocol) and powerful graphical visualisation of measured and derived quantities.
The currently available VO clients supporting the SSA protocol can provide with only basic functions in a interactive environment. The more advanced work with spectra (e.g. automatic preprocessing or advanced analysis) is not supported in VO at all. The most of the legacy applications should be turned into the VO server side services and the conversion of legacy scripts and recipes into Workflows will allow their easy deployment on GRIDs.
Modern techniques of astronomical analysis require the considerable amount of computing power and very offten the iterative comparison with theoretical models is indispensable. The properly designed VO service getting both observed and synthetic spectra transparently from VO resources and processing the number of objects in parallel on GRID might become a killer application turning the attention of wide astronomical community to the Virtual observatory as a viable and innovative way of modern astronomical research.
By introduction of modern VO-aware tools into the astronomical spectral analysis a remarkable increase of effectiveness of astronomical research can be achieved.
Acknowledgements.
This work has been supported by grant GACR 205/06/0584 and EURO-VO DCA WP6. The Astronomical Institute Ondřejov is supported by project AV0Z10030501References
- Aerts et al. (1992) Aerts, C., de Pauw, M., & Waelkens, C. 1992, A&A, 266, 294 17(4), 589
- Bagnuolo & Gies (1991) Bagnuolo, W. G., Jr., & Gies, D. R. 1991, ApJ, 376, 266 Kannappan, S. J., Kurtz, M. J., & Geller, M. J. 2000, PASP, 112, 367
- Churchil & Allen (1995) Churchil., C., W., & Allen, S. L. 1995, PASP, 107, 193
- de Jong et al. (1999) de Jong, J. A., Henrichs, H. F., Schrijvers, C., Gies, D. R., Telting, J. H., Kaper, L., & Zwarthoed, G. A. A. 1999, A&A, 345, 172
- Erspamer & North (2002) Erspamer, D. & North, P. 2002, A&A, 383, 227
- Gray (1982) Gray, D. F. 1982, ApJ, 255, 200
- Gray (2005) Gray, D. F. 2005, PASP, 117, 711
- Hadrava (1995) Hadrava, P. 1995, A&AS, 114, 393
- Hadrava (1997) Hadrava, P. 1997, A&AS, 122, 581 Kubát, J. 2003, in “Stellar Atmosphere Modeling”, ASP Confer. Ser. 288, 149
- Hensberge et al. (2000) Hensberge, H., Pavlovski, K., & Verschueren, W. 2000, A&A, 358, 553
- Ilijic et al. (2004) Ilijic, S., Hensberge, H., Pavlovski, K., & Freyhammer, L. M. 2004, in “Spectroscopically and Spatially Resolving the Components of the Close Binary Stars”, ASP Confer. Ser. 318, 111
- Maintz (2003) Maintz,M. 2003, Be binary stars with hot, compact companions, PhD. thesis, University of Heidelberg
- Martínez Fiorenzano (2006) Martínez Fiorenzano, A. F., 2006, PhD. thesis, Padova university, Italy
- Piskunov & Valenti (2002) Piskunov, N. E. and Valenti, J. A., 2002 A&A, 385, 1095
- Povich et al. (2001) Povich, M. S., Giampapa, M. S., Valenti, J. A., Tilleman, T., Barden, S., Deming, D., Livingston, W. C., & Pilachowski, C. 2001, AJ, 121, 1136
- Prugniel & Soubiran (2001) Prugniel, P. & Soubiran, C. 2001, A&A, 369, 1048
- Simon & Sturm (1994) Simon, K. P., & Sturm, E. 1994, A&A, 281, 286
-
Strassmeier (2008)
Strassmeier, K., G., 2008, published at web
http://www.aip.de/groups/activity
/index.php/new-results/zemman-doppler
-imaging-results.html - Škoda & Hensberge (2003) Škoda, P. & Hensberge, H. 2003, in Astronomical Data Analysis Software and Systems XII ASP Conference Series, Vol. 295, 2003 H. E. Payne, R. I. Jedrzejewski, and R. N. Hook, eds., 415
- Škoda & Šlechta (2004) Škoda, P., Šlechta, M., 2004, in Variable stars in the Local Group, IAU Coll. 193, eds. D. Kurtz and K. Pollard, ASP Conf. Ser., 310, 571
- Uytterhoeven (2004) Uytterhoeven, K. 2004, An observational study of line-profile variable B stars in multiple systems, PhD. thesis, KU Leuven
- Vogt & Penrod (1983a) Vogt, S. S., & Penrod, G. D. 1983a, PASP, 95, 565
- Vogt & Penrod (1983b) Vogt, S. S., & Penrod, G. D. 1983b, ApJ, 275, 661
- Vrancken et al. (1997) Vrancken, M., Hensberge, H., David, M., & Verschueren, W. 1997, A&A, 320, 878
- Winter (2006) Winter, Ch., 2006, PhD. thesis, Armagh Observatory, Northern Ireland
- Zhao et al. (2006) Zhao, J.-K., Zhao G., Chen Y.-Q, Shi J.-R., Liu Y.-J, Zhang J.-Y, 2006, Chin. J. Astron. Astrophys., 6, 689