GALEX selected Lyman Break Galaxies at : Comparison with other Populations
Abstract
We present results of a search for bright Lyman break galaxies at in the GOODS-S field using a NUV-dropout technique in combination with color-selection. We derived a sample of 73 LBG candidates. We compare our selection efficiencies to BM/BX- and BzK methods (techniques solely based on ground-based data sets), and find the NUV data to provide greater efficiency for selecting star-forming galaxies. We estimate LBG candidate ages, masses, star formation rates, and extinction from fitting PEGASE synthesis evolution models. We find about 20% of our LBG candidates are comparable to infrared luminous LBGs or sub-millimeter galaxies which are thought to be precursors of massive elliptical galaxies today. Overall, we can show that although BM/BX and BzK methods do identify star-forming galaxies at , the sample they provide biases against those star-forming galaxies which are more massive and contain sizeable red stellar populations. A true Lyman break criterion at is therefore more directly comparable to the populations found at , which does contain a red fraction.
Subject headings:
galaxies: general — galaxies: high-redshift — galaxies: evolution — galaxies: star formation — infrared: galaxies1. Introduction
Since their discovery in the early 1990s (Steidel & Hamilton, 1993), Lyman break galaxies (LBGs) have been used very successfully to study galaxy evolution processes in the high redshift Universe. Using the dropout technique, multi-wavelength surveys have built up large samples of LBGs at redshifts between , where the Lyman break is accessible with solely ground-based data sets (e.g. Steidel & Hamilton, 1993; Steidel et al., 1995, 1999, 2003; Lehnert & Bremer, 2003; Bouwens et al., 2004). The studies have shown that at , a significant fraction of the ionizing UV flux is emitted by low luminosity LBGs (e.g. Lehnert & Bremer, 2003; Sawicki & Thompson, 2006; Bouwens et al., 2007; Lehnert et al., 2010). Analysis of the stellar populations showed that the population of LBGs at consists of significantly less massive and younger galaxies than comparable samples at (e.g. Verma et al., 2007; Yabe et al., 2009). Verma et al. suggested that these LBGs are experiencing their first significant buildup of stellar mass (see also Stark et al., 2009). At , the LBG population consists of more massive galaxies that have formed stars over longer periods (e.g. Shapley et al., 2001; Reddy et al., 2008). A considerable fraction of the LBGs () consists of massive infrared luminous galaxies (Rigopoulou et al., 2006; Magdis et al., 2010); these ILLBGs are considered one possible class of progenitors of today’s massive elliptical galaxies.
Less is known about the LBGs at . At this redshift, the Lyman break occurs in the UV, which can only be observed from space. First studies using deep images observed by the GALEX satellite obtained samples of LBGs at using FUV dropouts (Burgarella et al., 2006, 2007; Haberzettl et al., 2009). The majority of LBGs ( 75%) at this redshift are disk-dominated, while the rest consist of interacting/merging galaxies (Burgarella et al., 2006).
At , a number of groups have worked around UV restrictions by using selection techniques which solely rely on ground based data sets as a proxy method for identifying star-forming galaxies. The BM/BX-method (Adelberger et al., 2004; Steidel et al., 2004) is based on UnGR color selection. The color cuts were determined from a sample of spectroscopically-verified star-forming galaxies, which were fitted with dust-reddened SEDs. The resulting best-fits were redshifted to and used to calculate characteristic colors; for more details see Adelberger et al. (2004).
A second ground-based color method is the BzK-selection (Daddi et al., 2004a). The choice of filters covers the flat UV part of the spectra and flanks the Balmer break at rest-frame 4000 Å. This method is sensitive to selecting and distinguishing between star-forming and passively evolving galaxies at . Using the K20 data from the GOODS fields, Daddi et al. identified 25 star-forming and 7 old galaxies and reported a high selection efficiency with only 13% contamination by interlopers.
Follow-up studies showed that the optically (BX) selected star-forming galaxies at have typical stellar masses on the order of and typical star formation rates of yr-1 (e.g. Reddy & Steidel, 2004; Shapley et al., 2005). Space densities are Mpc-3 with a correlation length of Mpc (Reddy et al., 2005; Adelberger et al., 2005), indicating that typical star-forming galaxies at are hosted by dark matter halos.
Studies of the optical-NIR selected star-forming galaxies by Daddi et al. (2005) show that a typical galaxy at is likely to be a ULIRG with and star formation rates SFR yr-1. The space density of these galaxies is Mpc-3, which is 2-3 times higher than at and 1 (e.g. Sanders et al., 2003; Le Floc’h et al., 2005) and makes them relatively common objects at . Their ULIRG nature is also supported by morphological studies using HST imaging (Daddi et al., 2004b), indicating that many of the -selected galaxies show hints of merger events driving strong star formation events.
Dynamical studies of star-forming galaxies at (Förster Schreiber et al., 2009), together with the results from Burgarella et al. (2006), indicate that between redshifts of and is when disk galaxies with significant masses start to contribute to the co-moving density of galaxies. It is also the phase when the star formation intensity reaches its peak (Hopkins, 2004, and references therein).
From these solely ground-based selection techniques and the development of new instruments like the IFU SINFONI at the VLT and OSIRIS at Keck, we have learned much about star formation at the critical epoch . However, since the selection processes are different to the techniques used for true LBGs at , comparisons between the samples are not straightforward. A consistent selection method using the Lyman break, independent of intrinsic galaxy properties, should be used to select consistent samples of star-forming galaxies at . Observations require the space-based facilities like GALEX or the UV-channels of the newly installed WFC3 on board HST. First studies include Hathi et al. (2010) and Ly et al. The latter analyzed a very deep (140ksec) GALEX NUV image of the Subaru Deep Field (SDF Kashikawa et al., 2004) and other filters to select true LBGs at redshifts , and compiled a sample of 8000 LBG candidates down to with , including 24 spectroscopically confirmed at . For LBGs, they reported a factor higher summed luminosity density compared to BX and LBGs, and an increase in the luminosity density by a factor of 3-6 between and .
Hathi et al. examined HST+ WFC3 images (F225W, F275W, and F336W) of a 50 arcmin2 field of the GOODS-S field, as part of an extended multi-color survey. The group used dropouts down to combined with color criteria to select 473 LBG candidates at , 2.1 and 2.7 respectively. The fitted Schechter function parameters agree well with predictions from other observations with respect to redshift.
These two studies demonstrate the feasibility of selecting samples of true LBGs at consistent with higher redshift LBG samples. Although they are a first step in better understanding this crucial population of star forming galaxies at an epoch formally known as the “redshift desert”, little currently is known about their properties. The studies either lack data coverage especially in the NIR and mid-IR (Ly et al., 2009) or field of view available (Hathi et al., 2010).
In this paper, we present first results from a dropout+color selection of a sample of true LBGs based on deep GALEX observations of the GOODS-S. Our specific purpose is to target a rarer, brighter sample of LBGs than found in the small, deep survey of Hathi et al. (2010). In addition, it complements the wider, shallower study of Ly et al. (2009) because we use a wider range of filters and target a different field, to minimize the effects of cosmic variance. We will show that we can obtain a sample of bright LBGs similar to the higher redshift population observed at . Here we report first results of estimates of ages, stellar masses, SFRs, and extinction for our purely UV-selected LBG sample. Using the deep GALEX UV data available for the CDF-S, we were able to utilize the complete size of the GOODS-S field which offers a wide range of data from the UV to mid-IR and also tripled the Hathi et al. sample size.
The paper is organized as follows: §2 summarizes the data used, §3 describes our search and defines the selection criteria, and §4, §5, and §6 present photometric redshifts, SED modeling and the results. Our summary and conclusions are in §7. Throughout the paper we use a cosmology with km s-1 Mpc-3, . All distances quoted are comoving.
2. Data
We base our study on GOODS and supporting surveys, which offer a wide variety of ground- and space-based imaging and spectroscopic data sets, all centered on the CDF-S and HDF-N. We concentrated our studies on the CDF-S, since this field offers the best data coverage. See Table 1 for a complete listing.


2.1. GALEX data
We used very deep GALEX FUV and NUV imagery, which is part of the GALEX Deep Imaging Survey (DIS). The data set consists of a 87 ksec FUV and a 89 ksec NUV exposure centered on the CDF-S (Martin et al., 2005) covering a 1 deg2 field of view. Without deconvolution, the data (FUV and NUV) provide a 3 detection limit of mAB=24.5 (MAG_ISO from SExtractor). Confusion noise in such deep images, with the large GALEX PSF (5.4′′), contributes to decreasing the detection sensitivity of the data. However, since we were interested in the detection of LBGs at 2, where the Lyman break is shifted in the NUV-band, it is the non-detections and the detection limits that are important. Therefore, our results are not seriously affected by confusion or overlapping sources, and consequently we did not deconvolve the NUV images. We adopted an effective detection limit where the completeness reaches 70-75% at mAB(FUV)26.2 and mAB(NUV)26.7 within a 5′′ aperture (Figure 1). We calculated the completeness using simulated images created with skymaker v3.3.3 and verifying detection probability using SExtractor. Figure 1 has been generated using a magnitude bin size of 0.125. The process was repeated 100 times, with 50000 stars per square degree between 18 and 28 mag per iteration. The errors for the completeness are represented by the standard deviations for the single bins. The smooth decline in completeness, starting around 23 mag, correlates with the number density of the simulated objects and can be interpreted as result of confusion due to the large PSF of the GALEX data. The steep decrease at faint magnitudes (marked by the big crosses in Figure 1) indicates where the sample starts to become rapidly incomplete. We chose a threshold of because it is where the steepest decline sets in and thus becomes very sensitive to photometric uncertainties, i.e. the detection or non-detection of sources becomes sensitive to even small photometric errors.
To avoid false detections or non-detections (for example due to objects being merged with bright and/or extended neighbors) we visually inspected each candidate. The relatively small number of objects made this inspection straightforward, and 10% of the objects had multiple identifications which could imply mergers or clumpy extinction but probably not separate but overlapping sources.
| Survey | Filter | Telescope | tot. Exp. Time | FWHM | mlim | Comment |
|---|---|---|---|---|---|---|
| s | arcsec | ABmag | ||||
| GALEX DIS | FUV | GALEX | 87042 | 4.5 | 27.0a | Martin et al. 2005 |
| GALEX DIS | NUV | GALEX | 89199 | 5.6 | 26.5a | Martin et al. 2005 |
| GaBoDS | U | ESO/MPG 2.2 m+WFI | 78891 | 1.01 | 26.3b | Hildebrandt et al. 2005 |
| B | 69431 | 0.98 | 27.2b | Hildebrandt et al. 2005 | ||
| V | 104603 | 0.92 | 26.8b | Hildebrandt et al. 2005 | ||
| R | 87653 | 0.79 | 26.8b | Hildebrandt et al. 2005 | ||
| I | 34575 | 0.93 | 25.0b | Hildebrandt et al. 2005 | ||
| GOODS/GEMS | F850LP | HST+ACS | 18232 | 0.03 | 26.0 | Giavalisco et al. 2004, |
| Rix et al. 2004 | ||||||
| GOODS | J | VLT+ISAAC | Giavalisco et al. 2004 | |||
| Ks | data release v1.0 | Giavalisco et al. 2004 | ||||
| [3.6] | Spitzer+IRAC | 82800, 165600c | 3.6 | 24.0 | Dickinson et al. in prep. | |
| [4.5] | 82800, 165600c | 3.6 | 24.0 | Dickinson et al. in prep. | ||
| [5.8] | 82800, 165600c | 3.6 | 23.0 | Dickinson et al. in prep. | ||
| [8.0] | 82800, 165600c | 3.6 | 23.2 | Dickinson et al. in prep. | ||
| [24.0] | Spitzer+MIPS | 82800 | 3.6 | 20.5 | Dickinson et al. in prep. | |
| MOS | VLT+VIMOS | Popesso et al. 2009 | ||||
| MOS | VLT+FORS2 | Vanzella et al. 2008 |
a 1.5 detection limit used within SExtractor
search
b 5 detection limit within a 2′′
aperture
c total exposure time for the central overlap region
d 10 detection limit within a
1′′ aperture
2.2. Optical and NIR data
We used deep public images from the GaBods survey for the object search and color selection of LBG candidates (Hildebrandt et al., 2005). The data set offers 0.25 deg2 UBVRI pointings centered on the CDF-S, and was observed using the ESO/MPG 2.2 m telescope with the Wide Field Imager (WFI). The images reach 5 detection limits in UBVRI for a 2′′ aperture of 26.3, 27.2, 26.8, 26.8. For more details, see Table 1.
Deep NIR data are available as part of the GOODS survey observed using ISAAC at the ESO VLT (Giavalisco et al., 2004b). We used data release v1.0 covering a 1016′ area observed in the - and -filters and reaching 3 detection limits of 25.5 and 25.1 respectively. The images yield an average resolution of arcsec in and arcsec in .
Besides the ground based broad-band imaging, we also used high resolution space-based imaging covered with ACS on the Hubble Space Telescope, in particular data from GOODS (Giavalisco et al., 2004a) as well as GEMS (Rix et al., 2004), observed in the Sloan z-band. The data offer a pixel size of 0.03′′ or 250 pc at 2, and provide us with basic morphological information for 1.52.5 LBG candidates.
2.3. Spitzer data
Additional photometric information in the mid-IR was provided by deep Spitzer images observed in the 3.6, 4.5, 5.8, 8.0 and 24m bands. The data are part of the GOODS survey and were observed as a Spitzer Legacy program in 2004; we used the data version v0.3 (Dickinson et al., in preparation). The images cover . Due to the observing strategy for the IRAC bands (3.6 to 8.0 m), which are comprised of 2 exposures taken 6 months apart and rotated 180∘ against each other, the central 1/3 ultra-deep parts of the final images were exposed twice as long as the outer super-deep regions (Table 1). The MIPS data were only observed during the epoch 1 observing campaign and correspond to the super-deep IRAC images. The Spitzer data cover the rest frame NIR for the selected LBGs, and probe the older low mass part of the stellar populations, thus better constraining the SED fits.
2.4. Spectroscopic data
Redshift information is available for parts of our sample from the GOODS-ESO observations with VLT+VIMOS (Popesso et al., 2009). We used redshifts from the low resolution VIMOS LR-Blue grism data, which have a spectral resolution of 28 Å, with a 5.7 Å/pixel dispersion. The spectra cover 3500–6900 Å (1167–2300 Å at ). A second set of redshifts used in our study was also available via GOODS, and was obtained with the VLT+FORS2 (Vanzella et al., 2005, 2006, 2008). The observations were taken using the 300I grism without an order-separating filter, resulting in a 3.2 Å/pixel dispersion and a 9 Å resolution at 8000 Å, spanning 6000–10000 Å. For this study we could use a total of 1075 redshifts in the field, covering 05.

2.5. Photometry
In the following, unless stated otherwise, we will solely concentrate on the analysis of objects found in the GOODS-S, the inner part of the CDF-S which is covered extensively in all 13 filter bands. Since the smallest total area coverage (140 arcmin2) is offered by the NIR data observed by ISAAC on the ESO VLT, we used it to determine the area over which we selected our final sample.
Throughout this paper we employ both aperture and total magnitudes. We used the aperture photometry for photometric redshift estimations and SED fitting. To perform aperture photometry we applied the aper task from NASA’s IDL Astronomy User’s Library. We measured the fluxes using apertures with equal radii of 2′′ in the optical and the NIR filter bands, based on double the FWHM of 1′′ in the U-band which functions as our detection filter. However, since the GALEX and Spitzer data offer much lower spatial resolution, we modified the aperture sizes accordingly (6′′ for GALEX FUV- and NUV-bands and 4′′ for the IRAC bands). We did not determine aperture magnitudes for the Spitzer m MIPS images.
| Filter | radius | mapercor | mapercor |
|---|---|---|---|
| ′′ | ABmag | ABmag | |
| FUV | 3.0 | 0.98 | 0.78 |
| NUV | 3.0 | 0.81 | 0.48 |
| U | 1.0 | 0.35 | 0.17 |
| B | 1.0 | 0.28 | 0.07 |
| V | 1.0 | 0.27 | 0.07 |
| R | 1.0 | 0.23 | 0.08 |
| I | 1.0 | 0.31 | 0.10 |
| J | 1.0 | 0.14 | 0.11 |
| KS | 1.0 | 0.14 | 0.17 |
| 2.0 | 0.34 | 0.10 | |
| 2.0 | 0.21 | 0.08 | |
| 2.0 | 0.17 | 0.06 | |
| 2.0 | 0.31 | 0.17 |
To account for aperture losses, we derived aperture corrections in every filter-band using a set of about 100 stars found in the GOODS-S field. The aperture corrections and their uncertainties range between for the GALEX FUV and for the ISAAC KS (Table 2), and were calculated from the growth curves using the mean aperture magnitudes and standard deviations of the stellar sample. The total errors for the aperture magnitudes were determined by adding the uncertainties of the magnitude zero-points and aperture corrections to the errors determined by aper in quadrature. For the Spitzer IRAC-bands we used the following magnitude zero-point errors: mag, mag, mag, mag, which were calculated from the flux uncertainties of the flux zero-points given in the Spitzer manual.
3. Search and color selection
To select LBG candidates in the redshift range 1.52.5, we first detected possible candidates performing SExtractor searches in every single filter band. Specifically, we did not extract sources from one image based on the detection of an object in another image. Rather, we detected objects in every filter band independently, and then measured total magnitudes for them. The resulting object catalogs were then cross-correlated against each other, creating a master catalog including all imaging results. For the correlation, we applied matching radii according to the spatial resolution of the images used (Table 1, column 5). As a final step, we matched the imaging master catalog with the two spectroscopic catalogs from GOODS (VIMOS and FORS spectroscopy).
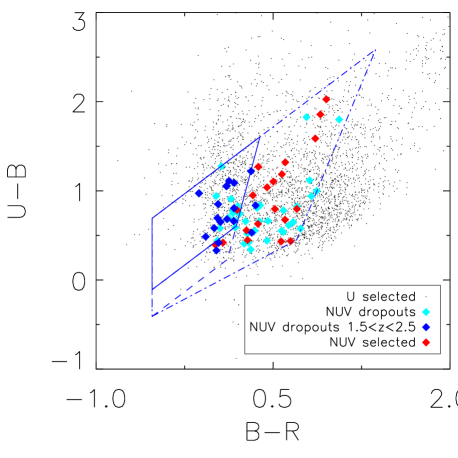
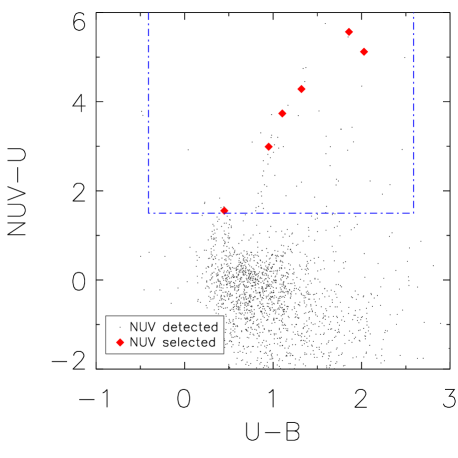
To identify LBG candidates at , we employed two different approaches. We limited the size of the field searched to the area of the sky covered by the ISAAC NIR observations. Since this data set covers the smallest area, this step guaranteed to restrict our sample only to candidates observed in all 13 filter-bands. Over this field we selected all U-band sources brighter than 25.3 (AB magnitudes) with no detection in the FUV- and NUV-bands (NUV-dropouts i.e. in a 5′′ aperture), and compared their locations in a vs. color-color diagram to those of model galaxies at (Figure 2). The U-band selection limit allowed us to detect objects with a Lyman break (NUV-U) of at least 1.4 magnitudes.
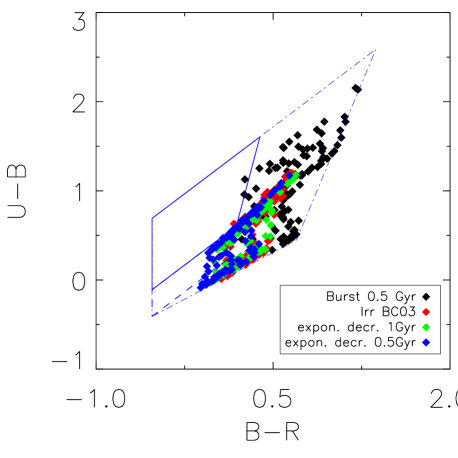
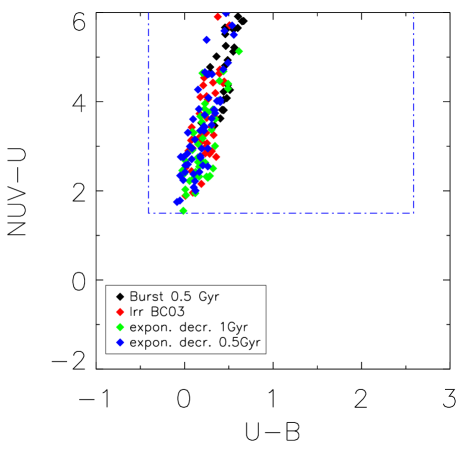
We calculated model galaxy colors using template SEDs from Fioc & Rocca-Volmerange (1997, PEGASE) and Bruzual & Charlot (2003), and employed the photo-z algorithm HyperZ (Bolzonella et al., 2000) to derive the model color tracks (Table 3) for a variety of star formation laws, ages and dust properties (Figure 2 bottom row). The template SEDs were extinction-adjusted via HyperZ using the reddening law of Calzetti et al. (2000) and ranging between 0 and 1.2. We furthermore accounted for absorption by the Ly forest on the SEDs using the method from Madau (1995) within HyperZ.
| model | star formation law | age |
|---|---|---|
| [Gyr] | ||
| Irr Bruzual & Charlot 2003 | constant | 2-3.7 |
| PEGASE | burst | 0.5 |
| exponential decr. | 0.5 | |
| exponential decr. | 1.0 |
The location of the model galaxies in the diagram defined the color selection criteria (largest blue dash-dotted quadrilaterals in Figure 2) for galaxies which, with the NUV Lyman break, we used to select our LBG candidates (Figure 2 top row). The color cuts are:
| (1) | |||||
We applied a second set of selection criteria for LBGs at the lower redshift end (), for which the redshifted Lyman break falls within the NUV band (). Those color cuts are (Figure 2, left panels):
| (2) | |||||
The NUV-selected LBG candidates had to meet both sets of color selection criteria, and be detected in the NUV but not in the FUV. The limits in the vs. diagram were the same as in the vs. diagram, while the limit represents the blue end of the model SED tracks.
Finally, we cleaned our selected sample for stellar contamination by comparing it with a stellar catalog (Groenewegen et al., 2002), which was created using a magnitude-limited, SED fitting approach. This resulted in a sample of 400 stellar candidates in the central 0.1 deg2 of the CDF-S. About 10% of the NUV-dropout and 47% of the NUV-selected galaxies were rejected as stars. As a further check, we visually inspected the NUV images of the LBG candidates and rejected objects which were false negatives (non-detections in the NUV), e.g. objects merged with bright neighbors. In total, the cleaning for stellar contamination and the visual inspection for false NUV-dropouts reduced our sample size from 171 to 127 candidates.
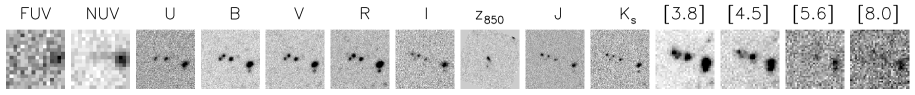
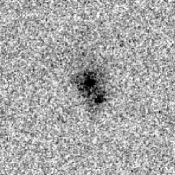
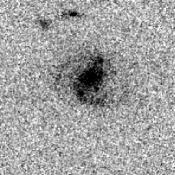
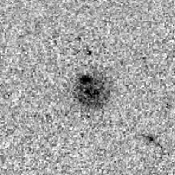
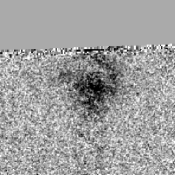
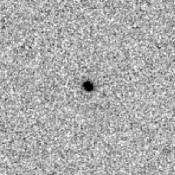
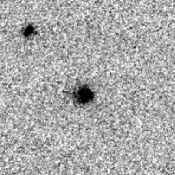
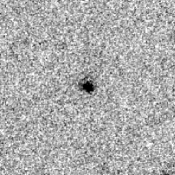
For our subsequent analysis, we concentrate on the bright population of LBGs in our target redshift range. Therefore, we only included objects which were observed in all filter bands between U and 4.5m. That resulted in a sample with uniform sampling across a wide wavelength range for SED and photometric redshift determinations. This final sample contains 53 NUV-dropout LBG candidates (see Figure 3 for 2 example images in the available filter bands) and 20 NUV-selected LBG candidates down to .


4. Photometric Redshifts
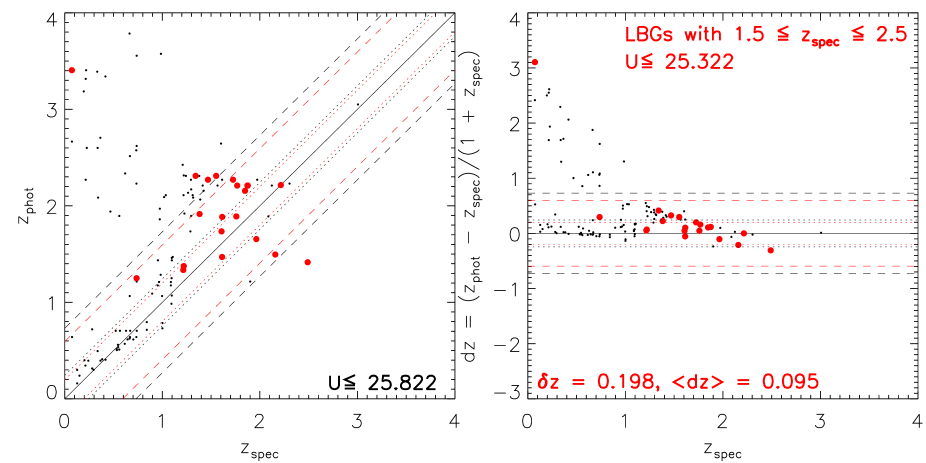
Using our 13-band photometry from UV to IR (GALEX FUV to Spitzer 8m, but excluding the ACS z-band), we estimated photometric redshifts with HyperZ v1.3 (Bolzonella et al., 2000). The redshift determination was done by cross-correlating a set of template spectra to the colors of our sample galaxies. In the current version of HyperZ, we used a set of five template spectra from Bruzual & Charlot (2003), consisting of an elliptical, Sc, Sd, Irr, and starburst galaxy. In cases where the objects were not detected in a filter band, except for the GALEX FUV- and NUV-bands, we omitted the non-detection for the redshift determination. To account for the Lyman break, the flux levels in the GALEX FUV and NUV band non-detections were set to zero during the template correlation. HyperZ can account for the effect of the Ly/Ly forest, therefore we applied the corresponding Ly forest opacity estimates of Madau (1995). We accounted for internal reddening of the LBG candidates by employing the reddening law of Calzetti et al. (2000), with set to range between 0 and 1.2 mag in steps of 0.2. The resulting redshift distributions for galaxy samples selected with the BM/BX, BzK and our dropout technique are shown in Figure 4. The peak at low redshift in the dropout and NUV selected sample (left panel) is mainly due to residual stellar contamination in the NUV selected sample. Five stars were identified when checking the HST images by eye. One of the low redshift galaxies, selected with the NUV selection method, clearly shows flux in the FUV filter-band. The flux is weak and merged with emission from a nearby bright star, leading to a false non-detection. Both the star and the galaxy were removed from the sample and not considered for further analysis. The second low redshift galaxy, selected with the NUV dropout method, does not show obvious emission in the UV filter-bands. We therefore keep this object in our sample at this stage. Our subsequent analysis will use redshift limits to restrict the sample further, minimizing the effects on the results by foreground or background objects.
While our NUV dropout selection and the BM/BX method allowed for a relatively clean selection of star forming galaxies, the contamination with low redshift interlopers is much higher for the selection method.
We calculated photometric redshift uncertainties (right panel Figure 5). Overall, the rms is , with an averaged offset of . The fraction of catastrophic outliers () is 14%. The accuracy of the photometric redshift estimation increases with the use of our LBG selection method: for our LBG candidate sample, the rms is , with an average of , indicating no significant systemic offsets. The fraction of catastrophic outliers decreased to 5% (1/20). We therefore conclude that the photometric redshift determination enables us to estimate unbiased photometric redshifts for our LBG sample.
5. SED Modeling
In order to estimate intrinsic properties of the LBG sample, we fitted our 13-band aperture photometry to a library of spectral energy distributions (SEDs) created by the synthesis evolution model PEGASE (Fioc & Rocca-Volmerange, 1997). We chose the PEGASE models mainly because of the possibility to model SEDs using consistent chemical evolution which constrains the metallicity as a function of time. We think this is a more realistic approach than using stellar populations with a fixed metallicity (e.g. Bruzual & Charlot, 2003). Also, due to an otherwise similar modeling approach (similar stellar library, similar treatment of the TP-AGB phase, etc.) our results are more comparable to other studies of LBGs based on Bruzual & Charlot models (e.g. Shapley et al., 2001, 2005).
Our library consisted of several thousand PEGASE spectra including star formation histories with constant and exponentially decreasing star formation rates. The decay times for the exponentially decreasing SFRs range from Myr (burst-like scenarios) to Myr (close to constant star formation).
We modeled the SEDs using a Kroupa et al. (1993) initial mass function (IMF), including consistent chemical evolution and following a closed box approach excluding gas infall and outflow. Although that it is likely that high-redshift star-forming galaxies have outflows (e.g. Steidel et al., 2010), we decided not to consider outflows in the PEGASE SEDs. Again, this allows for a better comparison with previously published results based on the Bruzual & Charlot models.
The model fits and the conversion into physical parameters (mass, SFR, ) were done using an IDL based chi-square minimization routine. Our routine applies the Calzetti et al. (2000) extinction law to the PEGASE models for dust correction. We chose the Calzetti et al. law since it has been used by many other studies of high redshift galaxies (e.g. Shapley et al., 2001, 2005; Yabe et al., 2009). We applied extinction corrections to the PEGASE model SEDs ranging between AV=0-5 mag in steps of 0.1 mag. The extinction-corrected PEGASE models were then redshifted and fitted following the chi-square minimization approach described by Gwyn & Hartwick (2005). The normalization of the measured SEDs was derived including only the observed frame optical () filter-bands.
When possible, we employed spectroscopic redshifts, and photometric redshifts otherwise.
From the model fits we estimated ages, stellar masses, SFRs and dust extinction for LBG candidates. Our results only allow for best-fitting SEDs which were younger than the age of the Universe. We estimated uncertainties for the calculated parameters as the standard deviation of the expectation value of each parameter (see Noll et al., 2009, for more details). We restrict the final sample of LBG candidates to galaxies with photometric and spectroscopic redshifts , which includes 61 objects.
The SED fitting resulted in a median of the reduced values
for the complete sample . Acceptable fits
with a probability of
0.1% (1%) have and make up about 70% (56%) of
the sample.
Larger reduced values appear to result from two main sources:
1) small photometric errors, especially in the NIR and mid-IR filter bands,
indicating that we are underestimating the photometric uncertainties
in these bands.
2) Uncertainties in the photometric redshift estimation. We
find that reduced -values for objects with spectroscopic redshifts
() are smaller than for objects with only photometric redshifts
available. The median reduced for the objects with spectroscopic
redshifts is , with about 83% having
, while the median reduced for the objects with
only photometric redshifts is . This
indicates that uncertainties in the photometric redshift estimation resulted in
higher uncertainties in the SED fits. Since even small redshift uncertainties
can have large implications for the fit result when including the NUV filter
(especially for the lower redshift LBGs ), we decided to exclude
the NUV and FUV photometry from the SED fits.
The majority of best-fitting models are those with either constant SFRs (11%) or long decay times Myr (61%) which are in practice nearly constant. Another 20% of the fitted galaxies are best described by exponentially decreasing SFRs with moderate decay times Myr. Only 8% of the galaxies are best represented by exponentially decreasing SFRs with short decay times Myr i.e. starbursts. All except one of the fitted galaxies are best described by dust-reddened SED models. About 84% of the sample is best fitted with an extinction correction of . and 52% with .
Stellar masses and SFRs are relatively well constrained with median uncertainties of about -0.4 dex. We did not find an obvious correlation between stellar masses and SFRs vs. their -values and their errors. However, the highest masses (M⊙) seem to be best constrained, showing the smallest uncertainties. In contrast, the uncertainties for the ages are large, with a median value of 0.9 dex. Older galaxies in the sample ( Myr) are found to have relatively well-constraint ages with a median error of 0.4 dex. Unlike the stellar mass and the SFRs, the ages show an increase in uncertainties with increasing . Therefore, most of the uncertainties in the best-fitting models lie in the age estimates.
Examples of successful SED fits are shown in Figure 6. The right panel shows an SED for which only photometric redshifts were available, while the left panel shows an example fit for which the spectroscopic redshifts could be used.
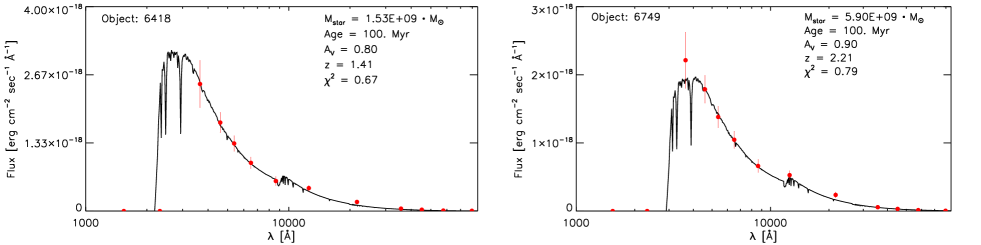
with spectroscopic (left) and photometric (right) redshifts. Error-bars for the and IRAC-bands are smaller than the symbol sizes.
6. Results
6.1. Dropout selection
From the GOODS-S spectroscopic data (Vanzella et al., 2008; Popesso et al., 2009), we were able to obtain spectroscopic redshifts for 25 (20 dropout and 5 NUV-selected) of our 67 total LBG candidates. About 80% of the dropout selected (16/20) and only 20% (1/5) of the NUV selected LBG candidates were found to have redshifts in our target range of . However, an additional 15% (3/20) of the NUV-dropouts and 60% (3/5) of the NUV-selected objects have . Including this poorly explored redshift range, inaccessible from the ground for true dropout identifications, increased the selection efficiency from 80% to 95% for the dropout selected and 20% to 80% for the NUV selected LBG candidates.
Comparison with BM/BX. In the last few years, several selection methods like the BM/BX- (Steidel et al., 2004; Adelberger et al., 2004) and BzK-methods (Daddi et al., 2004a, b) have been employed, which solely rely on ground-based photometry to create samples of star-forming galaxies at . We compared the selection efficiency of these methods here to our dropout selection which directly probe their Lyman break spectral regions, and thus are more directly analogous to the LBG samples at . To avoid effects due to selecting fainter objects especially with the BM/BX method, we applied the same brightness limits ( AB) as for the dropout selection. Figure 2 shows our Lyman break+color criteria (large dot-dashed quadrilaterals, left panels) compared to the BM/BX-method (smaller solid/dashed blue quadrilaterals respectively). The overlap is relatively small, and consists mainly of model galaxies with relatively complex star formation histories (e.g. exponentially decreasing SFRs). The allowed LBG parameter space increases when including more evolved and/or dust-reddened cases – because the dropout method does not depend on (optical) colors redward of the rest-frame Lyman limit. In summary, only 2/3 of the NUV-dropout selected sample of LBG candidates (34 of 53) are detected with the BM/BX criteria, and only about 60% of the BM/BX selected galaxies (26 of 45) would have been selected by our color plus NUV-dropout criteria.
Comparison with BzK.
Only 9 LBG candidates (20% of the NUV-dropout selected LBG
candidates) satisfy the BzK “” color requirement.
Only 25% of the BzK-selected galaxies (11 of 48) were found to be
NUV-dropouts and about 80% of the BzK NUV-dropouts (9 of 11)
were located within our color-selection region in the diagram (Fig. 2).
These results show that a true Lyman break selection targets a different population of galaxies, perhaps more evolved and/or reddened than the BM/BX-selected galaxy population and more similar to the BzK selection. Our dropout selection targets mainly bright star forming galaxies due to limitations in the sensitivity, especially in the K-band. However, compared to the selection, the dropout technique reduces the contamination due to interlopers and results in a cleaner, more complete sample of LBGs (Figure 7).

6.2. Masses, SFRs, and Extinction
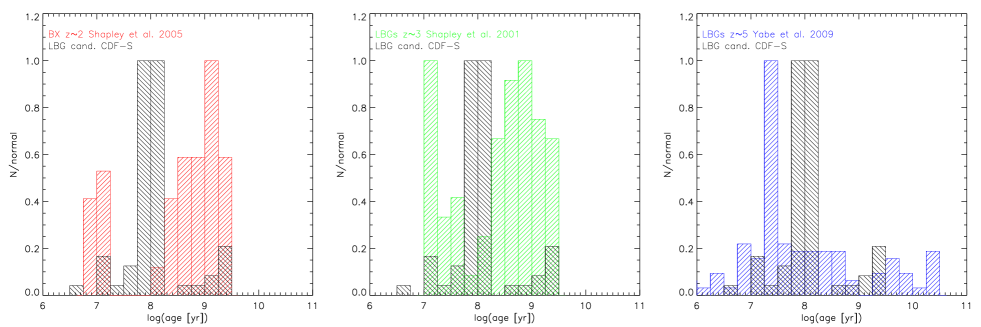
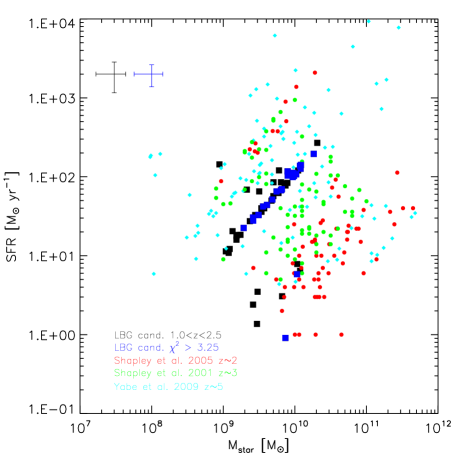
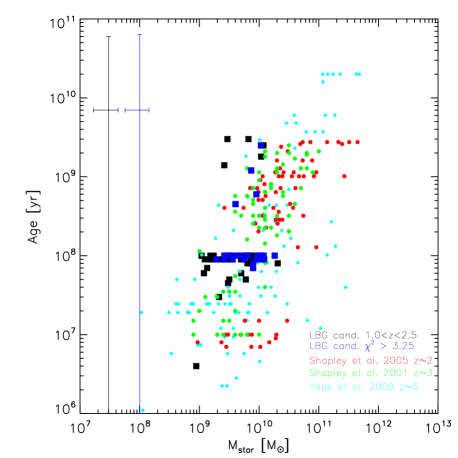
Fitting the PEGASE synthesis evolution models, we find that our UV-bright LBG sample is best represented by ages ranging between Gyr (Figure 8), stellar masses between -, and SFRs up to 270 yr-1 (Figure 9) with a median yr-1. The sample is relatively strongly reddened, with a median . The age distribution peaks around Gyr (Figure 8), with a possible second smaller peak around Gyr. We see a lack of the very young galaxies Myr found by Shapley et al. (2005), indicating that our color selection compared to the BX selected star-forming galaxies at of Shapley et al. is more sensitive to evolved galaxies with moderate star formation rates. However, when comparing the stellar mass and SFR distribution, we find that the dropout technique is more sensitive to moderate masses with a peak around and SFRs higher than those at (e.g. Shapley et al., 2001), peaking at relatively high SFRs of about yr-1. Similar to Verma et al. (2007), we find that our LBGs are more massive, older, and have similar SFRs compared to high redshift LBGs, for example the LBGs of Yabe et al. (2009).
In general, the properties of our dropout-selected LBGs based on the SED fits are more comparable to LBGs at (e.g. Shapley et al., 2001) than are BM/BX and BzK-selected galaxies. Our results demonstrate the consistent selection of the dropout technique over a large redshift range, which allows for the compilation of comparable samples to study the evolution of galaxies over cosmic time scales.
6.3. IR Luminous LBGs
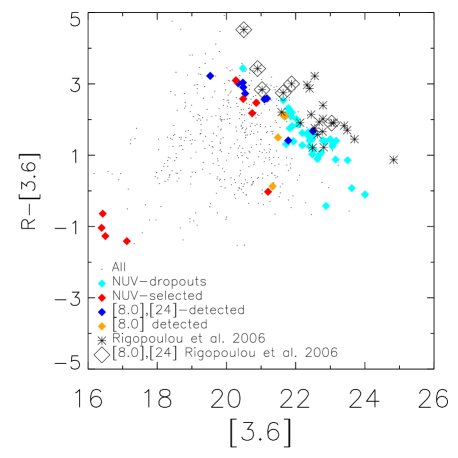
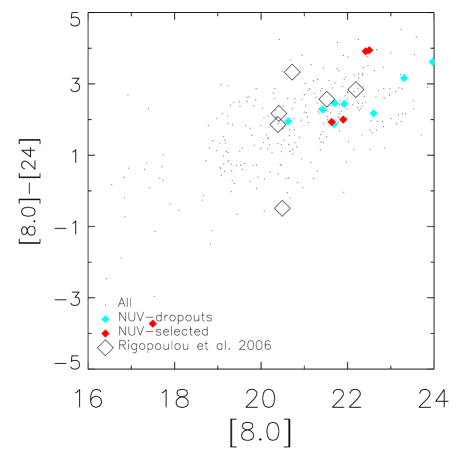
A small fraction of our LBG candidate sample has colors in the vs. color-magnitude diagram (Figure 10) comparable to infrared luminous LBGs (ILLBGs) and sub-millimeter galaxies at (e.g. Rigopoulou et al., 2006). The location in the color-magnitude diagrams indicates that our LBG sample consists of about 20% ILLBGs and/or galaxies consistent with sub-millimeter galaxies. The estimated median stellar mass of the IR luminous subsample is , and is slightly higher than the median stellar mass of the total LBG sample (). With a median SFR of yr-1, the IR luminous subsample consists mainly of LBGs with high SFRs (100 M⊙yr-1), while the distribution for the general LBG sample show a tail of LBGs with lower SFRs (30 M⊙yr-1). The higher median extinction of for the ILLBGs ( for the complete sample) indicates that light can be subjected to opacities well beyond , even in the optical. The implication is that there is still some part of the star formation that could be hidden by dust, resulting in an underestimate of the SFRs. The high dust reddening of the ILLBGs is also supported by the fact that all IR luminous candidates are found with relatively red colors in the color-color diagrams, not falling in the overlap region between BM/BX and dropouts ( and consistent with recent results for a small far-IR detected sample by Burgarella et al., 2011). Although our results indicate substantial reddening due to larger amounts of dust, we have to be careful when drawing conclusions concerning extinction from UV and optical data alone. The age-extinction degeneracy and the lack of FIR data, where the thermal emission of dust defines the spectral properties, makes any interpretation difficult at best. Using the results from the best fitting SEDs of our sample, we determine a median error for the extinction of . In all cases we find no acceptable fits with A2.3 mag, with the largest extinction corrections being found for the ILLBGs.
We also calculated the total IR luminosity following the approach of Rieke et al. (2009), estimating from the m flux using a linear approximation. The luminosities are given in , employing apparent solar magnitudes using Rieke et al. (2008) and Engelke et al. (2010). We thus estimated total IR luminosities for our subsample of ILLBGs of , with a median total IR luminosity of . Using the conversion reported by Nordon et al. (2010) this translates into a factor of two lower median SFR of about yr-1 for the ILLBG sample than derived from the SED model fits.
Compared to LBG samples at higher and lower redshifts with similar mass and UV luminosity ranges, we find that our sample consists of galaxies which are moderately higher extinction. Studies at and estimate median extinctions of (e.g. Verma et al., 2007; Yabe et al., 2009) and (e.g. Shapley et al., 2001) respectively. At the ILLBG sample of Rigopoulou et al. (2006) shows a median extinction of 1.0. Although slightly higher than the general samples of LBGs at this redshift, their reddening is lower than the median extinction of found in this study. Extinction values () similar to ours have been estimated for a 8m and 24m detected sample of LBGs by Shim et al. (2007). However, their sample consists mainly of ULIRG-like, massive LBGs with stellar masses of up M⊙ and IR luminosities of . Thus our selection, which in general selects LBGs, nevertheless favors selecting galaxies with higher extinction compared to LBGs. This is because we require them to be detected in all bands, including in the IR.
At lower redshifts, studies revealed LBGs with extinction values similar to the ones found at . At Nilsson et al. (2011) estimated extinctions of , with a median of 0.8 for a sample of LBGs in the GOODS-S field (Burgarella et al., 2007). Similarly, at , Lyman Break Analogs (LBAs) are found to have a median extinction of (Overzier et al., 2011). While overall trends in the extinction with redshift are difficult to determine, it appears that our study stands out in selecting galaxies with moderately higher extinction on average than other samples at lower and higher redshifts.
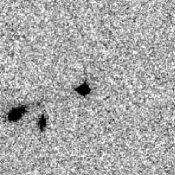
Compared with other published examples of IR luminous LBGs, we find that our sample consists of galaxies with moderate masses having a median mass of 8109M⊙. This is comparable to the LBGs of Nilsson et al. (2011), which have masses between M⊙ and M⊙. At , ILLBGs appear to be more massive. Rigopoulou et al. (2006), for example, found IR bright LBGs with masses between M⊙ and M⊙. Even higher masses of M⊙ have been reported for 24m-detected LBGs by Shim et al. (2007). With IR luminosities of , these galaxes are massive, dusty ULIRGs. The very high mass LBGs are relatively rare and might have been missed by us due to our relatively small search volume. Also, the lack of very massive LBGs in our sample might have been due to limiting our selection to UV-bright objects, requiring detections from U to IRAC 4.5m (observed frame). Both of these criteria (UV and IR luminous) favor the selection of objects with patchy extinction. Such galaxies possess strong, obscured starbursts. However, the extinction is patchy such that light from a UV-emitting stellar population, or less obscured star formation. can be observed. This can be seen in Fig. 11, where some of the galaxies have a complex morphology. The ILLBGs represent the more massive, dusty, heavily star-forming tail of the LBG population in our study, but are less massive than their high SFR, dusty counterparts at higher redshifts.
These galaxies also might resemble an interesting part of the high redshift sources contributing to cosmic IR background (CIB) light. At about 30-40% of the CIB results from LIRGs (Berta et al., 2010), which are comparable to our ILLBGs. In addition, far-infrared observations show that at m more than half of the contribution to the CIB comes from sources at redshifts (Devlin et al., 2009). Thus, a significant fraction of the SFR at this epoch might be provided by dusty IR-bright galaxies.
6.4. Morphology
From an inspection of the high resolution HST-ACS images by eye, we conclude that the majority of the LBG sample consists of galaxies showing indications of disk-like structure, while the rest can be considered compact objects (examples shown in Figure 11). Also, the majority of the sample has at least one close () neighbor or shows disturbed disk structures, such that they may be considered merger candidates. For the ILLBG subsample, we find that about 80% show indication of a disk structure and 20% are found to be compact objects. About 50% of the ILLBGs can be considered merger candidates. Although these results have to be taken carefully, since we did not apply detailed morphological analysis and a judgment by eye is very subjective, they seem to be in agreement with results found by Burgarella et al. (2006) for the LBGs which consist of about 75% disk-dominated galaxies and LIRGs (e.g. Melbourne et al., 2005; Bell et al., 2005; Hammer et al., 2007). A more detailed analysis of the morphology will be presented in a later paper (Haberzettl et al. in prep.).
7. Summary and Conclusion
We present results of a search for Lyman break galaxies at , an epoch once called the redshift desert. Over the last few years, studies employing the the BM/BX- (Steidel et al., 2004; Adelberger et al., 2004) and BzK-methods (Daddi et al., 2004a, b) used observed-frame optical color-selection criteria to find and study star-forming galaxies in this redshift range – which excluded the Lyman break. Such methods identify galaxies which, though star-forming, are not completely consistent with LBG samples at higher redshift (). The difference is that the dropout method allows for a wider range in color redward of the Lyman limit, which in practice means including redder, more evolved and potentially more massive galaxies.
Our NUV-dropout plus optical color selection technique targeted star-forming galaxies at , and is similar to the one used by Ly et al. (2009). Using the deep publicly available data set of the GOODS-S (CDF-S) field covering the UV to mid-IR, we identified a sample of 73 LBG candidates. Our selection method resulted in a success rate of % (95% for ).
The NUV dropout technique allows for the detection of more evolved and/or dust-reddened galaxies not detected with the BM/BX-method, while also decreasing the number of interlopers compared to the BzK-method. Although the BM/BX and BzK methods can select much fainter objects than we can here, due to the limitation of GALEX in sensitivity, they exclude the more evolved and/or dust-reddened galaxies completely. The fact that 40% of the dropout-selected LBGs are not detected by the BM/BX and/or BzK methods provides for additional UV/optical-selected star formation at , especially if hidden by large amounts of dust.
We find that our galaxy sample is consistent with LBGs at , and therefore allows for consistent follow-up studies at redshifts spanning .
We calculated useful photometric redshifts using HyperZ and included a small set of spectroscopic redshifts for our LBG candidate sample (Figure 5, red filled circles). The normalized rms scatter for our LBG candidate sample is , with a smaller mean offset of .
Using the combination of spectroscopic (where available) and photometric redshifts, we fitted synthetic models from a library of PEGASE spectra to our LBG sample, and determined ages ranging from 4 Myr to 3 Gyr, masses between to about , and SFRs up to yr-1.
Our LBG candidates have moderate stellar masses and SFRs consistent with LBGs (e.g. Shapley et al., 2001). Ages and dust extinction values of our sample are also more consistent with LBGs at , in comparison with the BX-selected galaxies at of (e.g. Shapley et al., 2005), although our sample shows a lack of the very young star-forming galaxies found in the BM/BX and samples (Figure 8). Our sample represents the moderate mass range of the UV luminosity distribution of LBGs at this redshift. This can lead to selection biases against objects with much higher masses. We therefore should exercise care when comparing our results to other surveys.
We also identified a small fraction of our LBG sample (20%) as potential ILLBGs and/or sub-millimeter galaxies using Spitzer 8.0 and 24 m data. Although there is some overlap with the other LBGs, the vs. plot in Figure 10 shows that the ILLBGs (blue and orange diamonds) represent the UV-bright end of the LBG distribution for a given value of . Due to their red colors at optical wavelengths (compared to the BM/BX selected), most of these galaxies are missed by the BM/BX and BzK methods (% detected).
The ILLBG SED fits result, on average, in higher total stellar masses, SFRs, and extinctions than our overall sample.
Compared with higher and lower redshift LBGs from the literature, we find that our sample has an average extinction which is higher than LBGs at (e.g Shapley et al., 2001; Verma et al., 2007; Yabe et al., 2009). A similar result holds in comparison with ILLBGs at (e.g. Rigopoulou et al., 2006), with the exception of massive, IR luminous, ULIRG-like LBGs which are selected in the infrared (Shim et al., 2007). We find that the masses and extinction values are in better agreement with results for LBGs (Nilsson et al., 2011).
The median total IR luminosity of our subsample of indicates that these ILLBGs are comprised mainly of LIRGs. Only % (2 out of 15 ILLBGs) are comparable to ULIRGs with . From the total IR luminosities, we estimate a median SFR half that compared to the one derived from the SED model fits. The role of ILLBGs in the overall scheme of star formation at and their contribution to the cosmic IR background merits further investigation, as ILLBGs could contribute significantly.
A simple morphological classification shows that the majority of our LBG candidates appear disk-like, and many show indications for mergers and interactions. Similar results were found for the ILLBGs, with 80% having disk-like morphologies. This is consistent with results published for LBGs (Burgarella et al., 2006) and LIRGs (e.g. Melbourne et al., 2005; Bell et al., 2005; Hammer et al., 2007).
Overall, our study shows that the selection of star-forming galaxies at using a true Lyman break dropout technique allows for the selection of a robust sample of LBGs, which can used for comparable follow-up studies with LBGs at higher redshifts. A Lyman break selection like we used here allows redder, more massive LBGs to be included in comparison to other selection techniques such as the BM/BX and BzK methods.
References
- Adelberger et al. (2005) Adelberger, K. L., Steidel, C. C., Pettini, M., et al. 2005, ApJ, 619, 697
- Adelberger et al. (2004) Adelberger, K. L., Steidel, C. C., Shapley, A. E., et al. 2004, ApJ, 607, 226
- Bell et al. (2005) Bell, E. F., Papovich, C., Wolf, C., et al. 2005, ApJ, 625, 23
- Berta et al. (2010) Berta, S., Magnelli, B., Lutz, D., et al. 2010, A&A, 518, L30+
- Bolzonella et al. (2000) Bolzonella, M., Miralles, J.-M., & Pelló, R. 2000, A&A, 363, 476
- Bouwens et al. (2007) Bouwens, R. J., Illingworth, G. D., Franx, M., & Ford, H. 2007, ApJ, 670, 928
- Bouwens et al. (2004) Bouwens, R. J., Thompson, R. I., Illingworth, G. D., et al. 2004, ApJ Lett., 616, L79
- Bruzual & Charlot (2003) Bruzual, G. & Charlot, S. 2003, MNRAS, 344, 1000
- Burgarella et al. (2011) Burgarella, D., Heinis, S., Magdis, G., et al. 2011, ApJ, 734, L12
- Burgarella et al. (2007) Burgarella, D., Le Floc’h, E., Takeuchi, T. T., et al. 2007, MNRAS, 380, 986
- Burgarella et al. (2006) Burgarella, D., Pérez-González, P. G., Tyler, K. D., et al. 2006, A&A, 450, 69
- Calzetti et al. (2000) Calzetti, D., Armus, L., Bohlin, R. C., et al. 2000, ApJ, 533, 682
- Daddi et al. (2004a) Daddi, E., Cimatti, A., Renzini, A., et al. 2004a, ApJ, 617, 746
- Daddi et al. (2004b) Daddi, E., Cimatti, A., Renzini, A., et al. 2004b, ApJ Lett., 600, L127
- Daddi et al. (2005) Daddi, E., Dickinson, M., Chary, R., et al. 2005, ApJ Lett., 631, L13
- Devlin et al. (2009) Devlin, M. J., Ade, P. A. R., Aretxaga, I., et al. 2009, Nature, 458, 737
- Engelke et al. (2010) Engelke, C. W., Price, S. D., & Kraemer, K. E. 2010, AJ, 140, 1919
- Fioc & Rocca-Volmerange (1997) Fioc, M. & Rocca-Volmerange, B. 1997, A&A, 326, 950
- Förster Schreiber et al. (2009) Förster Schreiber, N. M., Genzel, R., Bouché, N., et al. 2009, ApJ, 706, 1364
- Giavalisco et al. (2004a) Giavalisco, M., Dickinson, M., Ferguson, H. C., et al. 2004a, ApJ Lett., 600, L103
- Giavalisco et al. (2004b) Giavalisco, M., Ferguson, H. C., Koekemoer, A. M., et al. 2004b, ApJ Lett., 600, L93
- Groenewegen et al. (2002) Groenewegen, M. A. T., Girardi, L., Hatziminaoglou, E., et al. 2002, A&A, 392, 741
- Gwyn & Hartwick (2005) Gwyn, S. D. J. & Hartwick, F. D. A. 2005, AJ, 130, 1337
- Haberzettl et al. (2009) Haberzettl, L., Williger, G. M., Lauroesch, J. T., et al. 2009, ApJ, 702, 506
- Hammer et al. (2007) Hammer, F., Puech, M., Chemin, L., Flores, H., & Lehnert, M. D. 2007, ApJ, 662, 322
- Hathi et al. (2010) Hathi, N. P., Ryan, R. E., Cohen, S. H., et al. 2010, ApJ, 720, 1708
- Hildebrandt et al. (2005) Hildebrandt, H., Bomans, D. J., Erben, T., et al. 2005, A&A, 441, 905
- Hopkins (2004) Hopkins, A. M. 2004, ApJ, 615, 209
- Kashikawa et al. (2004) Kashikawa, N., Shimasaku, K., Yasuda, N., et al. 2004, PASJ, 56, 1011
- Kroupa et al. (1993) Kroupa, P., Tout, C. A., & Gilmore, G. 1993, MNRAS, 262, 545
- Le Floc’h et al. (2005) Le Floc’h, E., Papovich, C., Dole, H., et al. 2005, ApJ, 632, 169
- Lehnert & Bremer (2003) Lehnert, M. D. & Bremer, M. 2003, ApJ, 593, 630
- Lehnert et al. (2010) Lehnert, M. D., Nesvadba, N. P. H., Cuby, J., et al. 2010, Nature, 467, 940
- Ly et al. (2009) Ly, C., Malkan, M. A., Treu, T., et al. 2009, ApJ, 697, 1410
- Madau (1995) Madau, P. 1995, ApJ, 441, 18
- Magdis et al. (2010) Magdis, G. E., Rigopoulou, D., Huang, J., & Fazio, G. G. 2010, MNRAS, 401, 1521
- Martin et al. (2005) Martin, D. C., Fanson, J., Schiminovich, D., et al. 2005, ApJ Lett., 619, L1
- Melbourne et al. (2005) Melbourne, J., Koo, D. C., & Le Floc’h, E. 2005, ApJ, 632, L65
- Nilsson et al. (2011) Nilsson, K. K., Möller-Nilsson, O., Rosati, P., et al. 2011, A&A, 526, A10+
- Noll et al. (2009) Noll, S., Burgarella, D., Giovannoli, E., et al. 2009, A&A, 507, 1793
- Nordon et al. (2010) Nordon, R., Lutz, D., Shao, L., et al. 2010, A&A, 518, L24+
- Overzier et al. (2011) Overzier, R. A., Heckman, T. M., Wang, J., et al. 2011, ApJ, 726, L7+
- Popesso et al. (2009) Popesso, P., Dickinson, M., Nonino, M., et al. 2009, A&A, 494, 443
- Reddy et al. (2005) Reddy, N. A., Erb, D. K., Steidel, C. C., et al. 2005, ApJ, 633, 748
- Reddy & Steidel (2004) Reddy, N. A. & Steidel, C. C. 2004, ApJ Lett., 603, L13
- Reddy et al. (2008) Reddy, N. A., Steidel, C. C., Pettini, M., et al. 2008, ApJS, 175, 48
- Rieke et al. (2009) Rieke, G. H., Alonso-Herrero, A., Weiner, B. J., et al. 2009, ApJ, 692, 556
- Rieke et al. (2008) Rieke, G. H., Blaylock, M., Decin, L., et al. 2008, AJ, 135, 2245
- Rigopoulou et al. (2006) Rigopoulou, D., Huang, J., Papovich, C., et al. 2006, ApJ, 648, 81
- Rix et al. (2004) Rix, H.-W., Barden, M., Beckwith, S. V. W., et al. 2004, ApJS, 152, 163
- Sanders et al. (2003) Sanders, D. B., Mazzarella, J. M., Kim, D., Surace, J. A., & Soifer, B. T. 2003, AJ, 126, 1607
- Sawicki & Thompson (2006) Sawicki, M. & Thompson, D. 2006, ApJ, 648, 299
- Shapley et al. (2001) Shapley, A. E., Steidel, C. C., Adelberger, K. L., et al. 2001, ApJ, 562, 95
- Shapley et al. (2005) Shapley, A. E., Steidel, C. C., Erb, D. K., et al. 2005, ApJ, 626, 698
- Shim et al. (2007) Shim, H., Im, M., Choi, P., Yan, L., & Storrie-Lombardi, L. 2007, ApJ, 669, 749
- Stark et al. (2009) Stark, D. P., Ellis, R. S., Bunker, A., et al. 2009, ApJ, 697, 1493
- Steidel et al. (1999) Steidel, C. C., Adelberger, K. L., Giavalisco, M., Dickinson, M., & Pettini, M. 1999, ApJ, 519, 1
- Steidel et al. (2003) Steidel, C. C., Adelberger, K. L., Shapley, A. E., et al. 2003, ApJ, 592, 728
- Steidel et al. (2010) Steidel, C. C., Erb, D. K., Shapley, A. E., et al. 2010, ApJ, 717, 289
- Steidel & Hamilton (1993) Steidel, C. C. & Hamilton, D. 1993, AJ, 105, 2017
- Steidel et al. (1995) Steidel, C. C., Pettini, M., & Hamilton, D. 1995, AJ, 110, 2519
- Steidel et al. (2004) Steidel, C. C., Shapley, A. E., Pettini, M., et al. 2004, ApJ, 604, 534
- Vanzella et al. (2008) Vanzella, E., Cristiani, S., Dickinson, M., et al. 2008, A&A, 478, 83
- Vanzella et al. (2005) Vanzella, E., Cristiani, S., Dickinson, M., et al. 2005, A&A, 434, 53
- Vanzella et al. (2006) Vanzella, E., Cristiani, S., Dickinson, M., et al. 2006, A&A, 454, 423
- Verma et al. (2007) Verma, A., Lehnert, M. D., Förster Schreiber, N. M., Bremer, M. N., & Douglas, L. 2007, MNRAS, 377, 1024
- Yabe et al. (2009) Yabe, K., Ohta, K., Iwata, I., et al. 2009, ApJ, 693, 507