A Chandra Study of the Radio Galaxy NGC 326:
Wings, Outburst History, and AGN Feedback
Abstract
NGC 326 is one of the most prominent X- or Z-shaped radio galaxies (XRGs/ZRGs) and has been the subject of several studies attempting to explain its morphology through either fluid motions or reorientation of the jet axis. We examine a 100 ks Chandra X-ray Observatory exposure and find several features associated with the radio galaxy: a high-temperature front that may indicate a shock, high-temperature knots around the rim of the radio emission, and a cavity associated with the eastern wing of the radio galaxy. A reasonable interpretation of these features in light of the radio data allows us to reconstruct the history of the AGN outbursts. The active outburst was likely once a powerful radio source which has since decayed, and circumstantial evidence favors reorientation as the means to produce the wings. Because of the obvious interaction between the radio galaxy and the ICM and the wide separation between the active lobes and wings, we conclude that XRGs are excellent sources in which to study AGN feedback in galaxy groups by measuring the heating rates associated with both active and passive heating mechanisms.
Subject headings:
galaxies: active — galaxies: individual (NGC 326)1. Introduction
A small fraction of double-lobed extragalactic radio sources have long, centro-symmetric tails of radio emission extending from the nucleus or primary lobes in a very different direction, thereby producing “X” or “Z”-shaped radio galaxies (XRGs/ZRGs). The tails, or “wings”, are faint, do not currently harbor a relativistic jet, and can be substantially longer (in projection) than the primary lobes. They have elicited considerable interest due to the suggestion by Merritt & Ekers (2002) that they result from a recent supermassive black hole (SMBH) merger that reoriented the jet, but their origin is uncertain. It has also been suggested that the wings result from the deflection of lobe plasma by pressure fronts in the intergalactic or intracluster medium (IGM/ICM) (Leahy & Williams, 1984; Worrall et al., 1995; Capetti et al., 2002; Gopal-Krishna et al., 2003; Zier, 2005; Hodges-Kluck et al., 2010). Neither of these hypotheses have yet been proven, even in a single source.
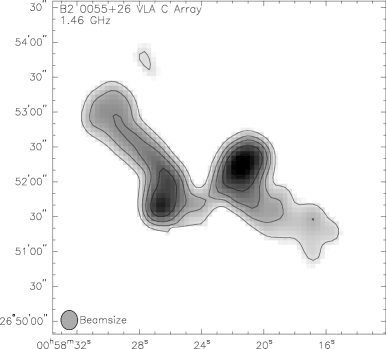
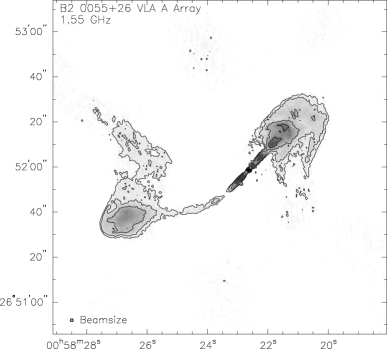
B2 0055+26 is a dramatic XRG/ZRG, with wings longer (in projection) than the primary lobes (Figure 1). The wings are highly collimated over 100 kpc. Its host galaxy is the northern component of the dumbbell NGC 326 (Colla et al., 1975) and the entire system resides in the galaxy cluster Zw 0056.9+2636 (Zwicky & Kowal, 1968). Hereafter, we adopt the convention in the literature and refer to the whole system as NGC 326. The cluster atmosphere has been characterized by Worrall et al. (1995, hereafter, W95) on large scales using ROSAT, and has an average temperature of keV. The cluster atmosphere is substantially asymmetric (Figure 2), suggesting that it is not in hydrostatic equilibrium and may be made up of two or more merging subclusters or that it is a composite of two or three poorer clusters seen in projection (W95). A detailed multifrequency study of the radio emission measured the spectral index as a function of position in the lobes and wings, finding spectral steepening in the wings and away from the ends of the jets (Murgia et al., 2001, hereafter M01).
Owing to its dramatic structure (Figure 1), NGC 326 is frequently used as the prototypical XRG/ZRG in formation models purporting to explain the X-shaped morphology. Ekers et al. (1978), who discovered the wings but not their true length, attributed them to ongoing regular precession of the relativistic jet inflating the primary lobes. Later, Merritt & Ekers (2002) argued that the striking X-shaped structure necessitated rapid secular precession. Noting that black holes are difficult to reorient via external forces other than accretion disk instabilities, Merritt & Ekers (2002) suggested instead that the X-shaped structure is the result of the final coalescence of a SMBH binary. Supposing that the components of the binary have misaligned angular momenta, the final spin axis (and jet axis) will be nearly instantaneously reoriented. Wirth et al. (1982) also argued in favor of a single rapid jet reorientation caused by a close encounter between the constituents of the dumbbell galaxy.
Based on the large-scale, hot, asymmetric cluster atmosphere, W95 found that the buoyancy of the lobe material could explain the wings provided that they were driven by rapid backflows expected near the terminal shocks of the radio jet heads. This scenario is fundamentally different from those above in that it presumes a stable jet axis. In support of the backflow hypothesis, we (Hodges-Kluck et al., 2010) reported a local asymmetric enhancement of the hot gas in a preliminary analysis of an archival 100 ks Chandra X-ray Observatory (CXO) image on the scale of 50–75 kpc where the radio beam is aligned with the major axis and the wings with the minor axis. This is also consistent with the expectation of Capetti et al. (2002) that X-shaped sources are aware of the geometry of their environments. However, it is not clear how the wings would grow so long in these models.
In this paper, we carefully consider the high-resolution CXO data in order to shed light on the history of NGC 326, evalauting possible hydrodynamic hypotheses and characterizing the interaction between the radio galaxy and its environment, which could not be resolved in the W95 study. NGC 326 is located at a redshift where kpc in the Wilkinson Microwave Anisotropy Probe cosmology ( km s-1 Mpc-1, , and ; Spergel et al., 2007). We use a Galactic photoelectric absorption in all spectral fitting of cm-2 (Kalberla et al., 2005). The total extent of the cluster atmosphere in the ROSAT image is about 20′ on a side (1.1 Mpc).
The remainder of the paper is organized as follows: in Section 2 we describe the CXO observation, data, and basic features, then in Section 3 we use the X-ray and radio data to derive quantities of interest related to the radio galaxy. In Section 4 we use these data to reconstruct the history of the radio galaxy and argue that NGC 326, as well as other XRGs, are interesting sources with regard to feedback from active galactic nuclei (AGNs). We summarize our results in Section 5.
2. Observations
NGC 326 was observed on 2006-09-02 for 94.4 ks by CXO using the Advanced CCD Imaging Spectrometer111See http://cxc.harvard.edu/proposer/POG/pdf/ACIS.pdf (ACIS) with the dumbbell galaxies located at the nominal aimpoint on the S3 chip (obs. ID 6830). We previously published these dating looking only at gross morphology (Hodges-Kluck et al., 2010). The data were reduced with the Chandra Interactive Analysis of Observations (CIAO v4.0) software, starting from the level=1 file rather than using the pipeline level=2 file. No background flares in the keV bandpass were detected in the lightcurve of low surface brightness regions on the S3 chip or empty regions on other chips (the entire S3 chip is covered by some cluster emission). For spectral fitting we used XSPEC v12.7.0 (Arnaud, 1996), with the apec model as our thermal model (Smith et al., 2001). Images produced from the reduced events file were exposure corrected using an exposure map generated in CIAO, and questionable pixels at the very edge of the chip which result from this process are excised from our analysis. For analysis of the hot cluster atmosphere, point sources are excised from the image using the CIAO wavdetect tool. We also exclude the resolved interstellar media (ISM) of the dumbbell galaxies. Since the cluster emission extends north onto the S2 chip, we follow an analogous procedure for these data.
In addition to the CXO data, we used archival NRAO222The National Radio Astronomy Observatory is a facility of the National Science Foundation operated under cooperative agreement by Associated Universities, Inc. Very Large Array (VLA) radio maps presented in M01. These include maps at 1.4, 1.6, 4.8, 8.5, and 14.9 GHz produced with the NRAO AIPS software. Re-reduction of one (post-calibration) dataset with the newer CASA software produced no significant differences. As described in M01, the angular size of the source is comparable to the size of a VLA antenna, so two pointings are combined to form the final image. The dumbbell system NGC 326 itself has been observed with the Hubble Space Telescope (HST) as a snapshot observation (Capetti et al., 2000), and there is archival ROSAT data (W95).
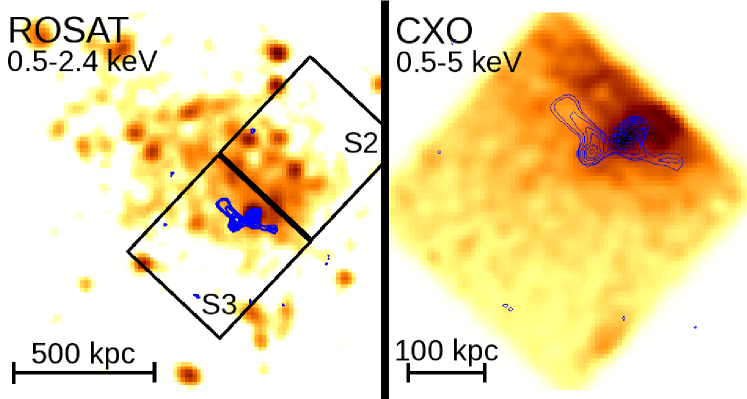
In the ROSAT PSPC image (Figure 2) the X-ray peak coincides with the radio galaxy but is not near the center of the cluster (W95). The ROSAT image does not have point sources subtracted; the bright spot near the southeast edge of the CXO S3 chip is a point source subtracted in the CXO image shown in Figure 2. The CXO image reveals a significant local anisotropic enhancement in the soft X-rays near this peak elongated in the direction of the primary lobes (Hodges-Kluck et al., 2010) that cannot be seen in the ROSAT image. In fact, the ROSAT X-ray peak is cospatial with the northern lobe of the radio galaxy and not with the dumbbell galaxies; these galaxies are visible in the CXO image but on scales much smaller than the ROSAT point spread function (PSF).
2.1. The ISM of NGC 326
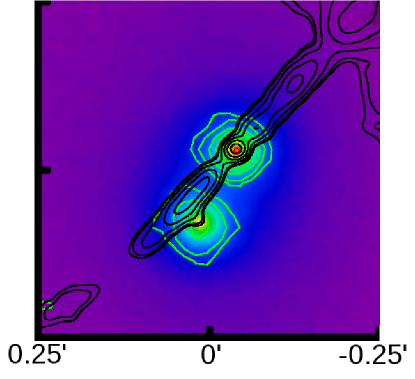
The CXO image resolves the constituents of the dumbbell NGC 326 (Figure 3, smoothed X-ray contours overlaid in green). The northern component is the host galaxy of the radio source and has an obvious strong point source at its center. As in the HST images, the northern component is the brighter of the pair (Capetti et al., 2002). Spectral fits for the two galaxies are described below.
Northern Component
In Hodges-Kluck et al. (2010) we measured a temperature of keV in this galaxy both including ( keV) and excluding ( keV) the central point source, which we fit using a power law of . Metallicity was frozen at solar abundances. This fit produces a for 16 degrees of freedom (20 counts bin-1). The (unabsorbed) model luminosity of the thermal component is erg s-1, whereas the X-ray luminosity of the power law is erg s-1.
An acceptable fit can be obtained using a 2-T fit with keV and keV. Presumably a higher temperature contribution would come from the projected ICM, but this is not a satisfactory explanation because the excess high-energy photons that require the higher temperature or power law component are concentrated inside the PSF at the location of the radio point source. Meanwhile, photons outside the half-power distance of the PSF are preferentially softer, suggesting that they are really part of the extended ISM. An AGN origin for the harder X-ray emission is therefore favored.


Southern Component
The southern component is fainter and has no obvious nuclear point source. Only 154 counts are detected, with a total luminosity of erg s-1. Despite the small number of counts, the X-ray spectrum is poorly fit by a single 1-T model ( for 8 degrees of freedom) but a good fit is achieved by including a power law component with a frozen photon index ( for 8 degrees of freedom). There are insufficient counts to constrain , but a power law interpretation is preferred as in the northern component since the harder photons are concentrated toward the center of the detect cell. Some power law emission is expected from unresolved X-ray binaries (see, e.g. Diehl & Statler, 2007), but we cannot rule out a weak nuclear source due to the 1 GHz emission from the nucleus.
A common envelope of diffuse optical emission surrounds the components of the dumbbell galaxy, but no similar envelope is detected in the X-rays. The radio image leaves open the possibility of interaction between the jet and the ISM of the southern component, but no X-ray jet is detected and the signal-to-noise ratio () in the southern component is too low to search for disturbances.
2.2. Cluster Atmosphere
The cluster X-ray emission is diffuse and extensive, covering the ACIS-S2 and S3 chips as well as some of the I2 and I3 chips. No other chips were active for this exposure. The aimpoint for the observation was on the S3 chip, so it is difficult to identify and excise point sources on the I2 and I3 chips. While bright point sources are still detected with algorithms such as wavdetect, faint point sources are distributed over many pixels and are difficult to distinguish from the cluster atmosphere or the background. Thus, we focus our efforts on the S2 and S3 chips (the radio galaxy is wholly contained in the latter). Quantities are listed in Table 1.
Large-scale structure
We generated a radial profile from the point-source subtracted images, centered on the X-ray peak near NGC 326 (Figure 4), subtracting local background from an annulus outside the fit region. We fit a 1D model (a Lorentzian of form , where is the peak amplitude in counts per square arcsecond and is the core radius in arcseconds) and find a good fit for and arcsec (100 kpc). This gives a for 11 degrees of freedom (using CIAO’s Sherpa with the Gehrels variance function). Our value of is consistent with the W95 value, but they find a core radius kpc in WMAP cosmology. This may be due to the larger field of view of the ROSAT image and the fact that our background annulus encompasses some cluster emission. There is also obvious anisotropy in the cluster on the scale of the S3 chip (Figure 2), so our fit is only a good description of the atmosphere in the vicinity of NGC 326. Since the X-ray emission may be a superposition of multiple clusters or groups (W95), we may be isolating group-scale gas associated with NGC 326.
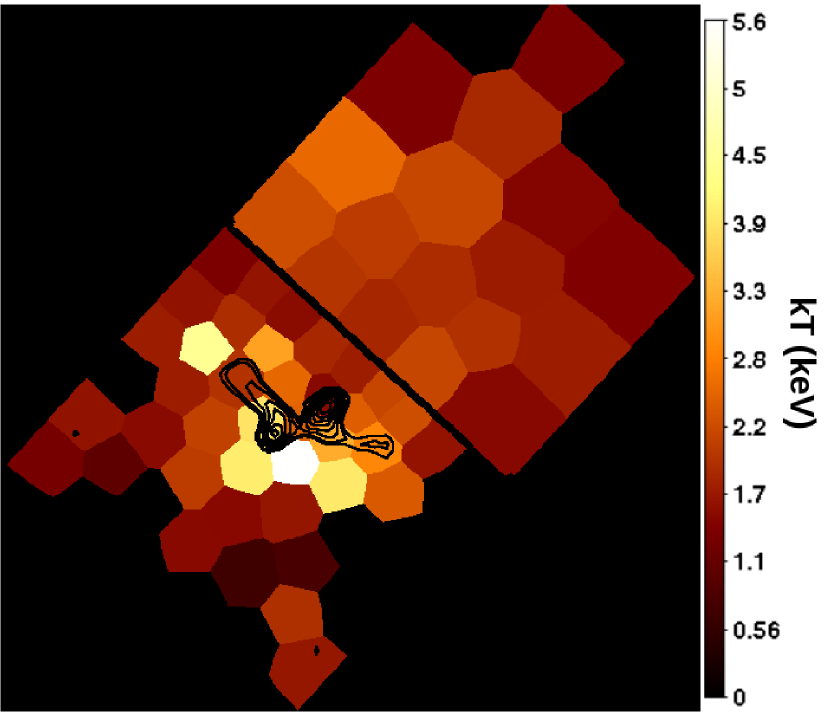
W95 measured a cluster temperature of approximately 2 keV and a metallicity of 0.3 times solar from the ROSAT data. The CXO data is largely in agreement, with temperatures ranging from keV near the core to keV near the edge of the cluster. However, a temperature map made using weighted Voronoi tessellations to adaptively bin the images into bins with (Diehl & Statler, 2006; Cappellari & Copin, 2003) shows a “front” of high-temperature plasma to the southeast of the radio galaxy (Figure 6). The temperatures in bins in this front range from keV for a fixed metallicity of (W95). The temperature is not well constrained, but no acceptable fits were found below keV for different bin sizes, metallicities, or 2-T fits.
Another way to estimate temperatures in the front is to “deproject” the emission by assuming a spherical atmosphere (within 100 kpc of NGC 326) and using annuli to break the emission into multiple bins. In this assumed geometry, a line of sight through the center sees a superposition of all the cluster emission, whereas a line of sight near the edge sees only the emission from the outskirts. Thus, each annulus is corrected for the annuli exterior to it, hopefully mitigating the effects of projection. Since the high-temperature front is about 70 arcsec from the core and the core radius is arcsec, we would expect significant contamination and that the deprojected temperature would be higher. This is indeed what we find (Figure 4), but we lack the counts to decisively bound the temperature. Since a power law model is not a good fit, the detection of hot plasma southeast of the radio source seems secure. We discuss the nature of this front in Section 3.
In addition to the high-temperature front and surface brightness enhancement around the radio galaxy, the CXO map reveals a few small-scale structures unresolved by ROSAT.
High-temperature knots
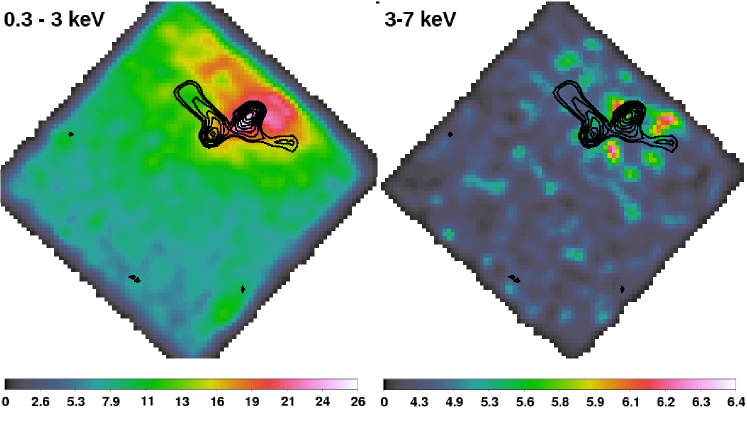
First, separating the data into soft ( keV) and hard () keV bands reveals the presence of bright knots around the radio galaxy in the hard X-ray band (Figure 5). Above 7 keV, the image is very noisy. The presence of bright knots around the radio emission suggests interaction between the radio source and the ICM. This inference of association is strengthened by the observation that the western wing appears to pass through a narrow channel devoid of hard X-ray emission in Figure 5. Although higher signal is required to establish their morphology, the data suggest that these knots are part of high-temperature rims bounding the radio source: the hard X-ray emission appears to avoid the radio emission. The presence of the brighter knots is consistent with the detection of X-ray emitting rims around radio sources (McNamara & Nulsen, 2007, and references therein). However, usually such rims are cool, whereas these features are distinct only in the hard keV band.
There are 500 total events in the keV band in these features. When spectra are extracted from these regions, the spectra are fit well by 1-T thermal models with keV. Given that we view the cluster in projection and the surrounding material has keV, this is a lower bound on the temperature in the knots. Despite the small number of counts, a nonthermal origin for the hard emission is disfavored. If we fit the spectrum with a thermal model frozen at the keV temperature of the background plasma and add a power law component, we require for a good fit, corresponding to a spectral index . There are two plausible possibilities for nonthermal emission resulting from interaction of the ICM with the edge of a radio galaxy: inverse Compton emission and Fermi acceleration from shocks. In the latter case, we would expect , so we can rule this out. Inverse Compton emission is also unlikely in this case. The spectral index of the radio galaxy is from 25 MHz through 1 GHz, so if it is synchrotron self-Compton, the boosted electrons would have to come from a population below 25 MHz. The average frequency boost is , so this would imply ! Moreover, the knots are outside the radio emission at GHz frequencies, and we would expect to see GHz emission from these regions as well. Supposing that the inverse Compton emission comes from a different source, we would still expect to see synchrotron emission in the GHz band from the boosted electrons if (discussion follows in Section 3). Thus, we conclude that the knot emission is thermal.
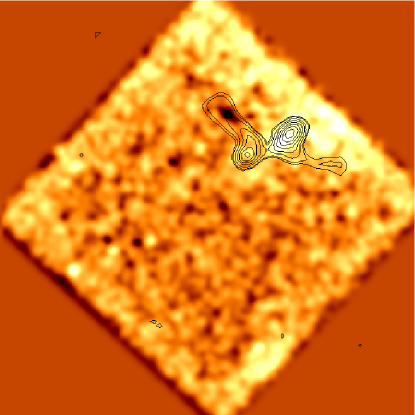
Wing Cavity
In addition to positive features, an unsharp mask image of the S3 chip (Figure 7) reveals an X-ray decrement associated with the east wing of NGC 326 centered about 95–10 kpc from the host. Although there are other X-ray decrements in the field, this is the deepest. The unsharp mask uses a radius of 50 pixels, a contrast enhancement of 5%, and a threshold of 0 counts to apply the unsharp mask. For viewing ease we show the entire chip smoothed by a Gaussian kernel with width pixels, but the chip edges enhanced by the unsharp mask are unphysical and should be ignored. This decrement is also plainly visible in a residual image produced by subtracting off the -model fit above (not shown). The decrement is in a shallow trough in the exposure map, but the trough spans the length of the chip and our exposure corrected image demonstrates that the decrement described here is substantially deeper than the trough. We tentatively identify this decrement as a “cavity” associated with the eastern wing.
Computing the significance of the decrement is not straightforward because of the obvious anisotropy of the cluster emission on scales larger than the chip. Subtracting off the -model reveals a gradient in the residuals apart from the decrement. There is no obvious way to account for this emission, since increasing the number of ad hoc model components risks overconstraining the problem. However, we can at least ask whether a cavity at the location in the cluster could be detected by using the expressions in Diehl et al. (2008). Equation 13 in their paper gives the of a cavity of a given size and at a given distance from the cluster core as a function of , , , , and observational parameters such as the detector effective area and exposure time. For our cluster ( keV, cm-3, , kpc), a cavity at the position of the decrement would require a radius of kpc in order to be detected with a in our CXO exposure.
This radius is consistent with the X-ray decrement seen in Figure 7 and the width of the eastern wing on the sky; a real cavity is unlikely to be larger than this. Hence, the decrement seen in the unsharp mask and residual image is consistent with the detection of a cavity. A deeper exposure is required to firmly establish its presence: a higher effective area (i.e., XMM-Newton) or a ks exposure with CXO would easily detect a 20 kpc cavity at more than 7.
| Parameter | Value | Units |
|---|---|---|
| Cluster Parameters | ||
| 1105 | arcsec | |
| 0.530.04 | ||
| 0.220.02 | cts/(arcsec)2 | |
| 2 | keV (avg) | |
| cm-3 | ||
| dyne cm-2 | ||
| 500 | km s-1 | |
| Radio Galaxy | ||
| N. Lobe Length | 50 | kpc |
| S. Lobe Length | 75 | kpc |
| E. Wing Length | 100 | kpc |
| W. Wing Length | 100 | kpc |
| 1 GHz | 70 | Myr |
| 7 | G | |
Note. — Measured and derived properties of NGC 326 and environs. Where errors are quoted, they are 90% confidence limits. Otherwise, quantities should be treated as approximate with justification in text. The radio structures are seen in projection and may be longer than the given values.
3. Derived Properties
Properties derived in this section are summarized in Table 1.
Sound Speed and Terminal Buoyant Velocity
Whereas powerful radio galaxies grow hypersonically as their jets plough through the tenuous IGM, the low-power FR I sources are thought to expand transonically or slower over the bulk of their lifetime (for a typical model, see Luo & Sadler, 2010). The remnants of dead radio galaxies are also thought to rise buoyantly in the ambient medium, and the growth of the wings of XRGs/ZRGs may be subsonic depending on the mechanism. Hence, the sound speed is a useful yardstick to apply to these sources.
Within 100 kpc of the cluster core, the average temperature in regions other than the high-temperature front is about keV, yielding a sound speed
| (1) |
in the approximation of an isothermal relaxed atmosphere and . is taken to be 5/3.
The terminal buoyant velocity of a light spherical bubble suspended in a medium is given by
| (2) |
where , , and are the volume, cross-sectional area, and radius of the bubble respectively, is the local gravitational acceleration, is the drag coefficient, and kpc is the core radius of the atmosphere. For the cavity at the edge of the eastern wing, kpc and kpc, so
| (3) |
Equipartition estimate of
Following Tavecchio et al. (2006), we estimate the equipartition field from the 1.4 and 4.9 GHz maps of the active lobes:
| (4) |
where is the Doppler factor, is the minimum electron cutoff energy, is the synchrotron frequency (we assume the observed frequency ), is the synchrotron luminosity in volume , and is a numerical factor in Pacholczyk (1970). The lobe volume is approximately , where and are the measured half-width and length of the lobes respectively: kpc and kpc (south) or 50 kpc (north). Hence, cm-3. The luminosity is
| (5) |
where Mpc is the luminosity distance. High quality images exist at multiple frequencies, showing no evidence for spectral steepening between 1.4 and 4.9 GHz (; M01). Since depends on the quantity , estimates of at 1.4 and 4.9 GHz must come out to be the same.
The flux at 1.4 GHz is Jy, while at 4.9 GHz Jy. These values correspond to G at 1.4 GHz and 6 G at 4.9 GHz. Since the luminosity in these images is dominated by lobe emission, presumably . Hence, we adopt
| (6) |
as the equipartition field in the lobes.
From the synchrotron frequency, Hz, we then find , yielding a synchrotron cooling time of
| (7) |
for the 1.4 GHz electrons, where is in units of and is in units of G. For the 4.9 GHz electrons, Myr. For our purposes, the synchrotron cooling time is more relevant in the wings, which will fade from view on this timescale without a fresh injection of electrons. Since the wings are bright at 4.9 GHz, the most recent injection must be no more than about 40 Myr old.
High-temperature Front/Bow Shock
The high-temperature front visible in the temperature map (Figure 6) and evident in the deprojected temperature profile (Figure 4) follows the contours of the soft X-ray emission to the southeast, and is slightly within the core radius of the 1D surface brightness profile.
The temperature of this feature is uncertain due to the low number of counts. The temperature from the adaptive binning scheme is between keV, whereas the deprojected temperature must be keV, at least times greater than the surrounding medium. We now consider whether this feature is consistent with a shock.
The Rankine-Hugoniot shock-jump conditions are
| (8) | |||||
| (9) | |||||
| (10) |
where is the adiabatic constant and is the Mach number. If we take , then . Incorporating uncertainties from the thermal models and binning scheme, we find
| (11) |
Assuming , we would expect a downstream density jump of , with a corresponding downstream surface brightness 5 times higher. However, farther downstream compressed material will relax, and the shock front is thin relative to the atmosphere. Thus, while we would expect to see a surface brightness discontinuity, it might be substantially smaller.
In fact, we do not see such a discontinuity. The 1D radial profile shows a hint of a surface brightness jump with in a region nearly cospatial with the temperature jump (Figure 4), but there are insufficient counts to conclusively identify a discontinuity or detect the expected lag between the discontinuity and rise in temperature. Another hint is the elliptical surface brightness enhancement co-aligned with the jet axis (Figure 5). This enhancement was earlier interpreted by us as the pre-outburst structure of the ICM, but it may result from the outburst. Unlike cold fronts in which a surface brightness discontinuity occurs in pressure equilibrium, the X-ray bright gas in the elliptical region has a somewhat higher pressure than outside. A deeper observation is required to confirm the discontinuity.
Another objection to the shock hypothesis is that the front is observed only on one side, but this can be explained by the fact that the cluster atmosphere brightens to the northwest and tapers off to the southeast (Figure 2). Shock-compressed gas will be most visible against a dim background, and the high-temperature knots near the northwestern lobe suggest that there is indeed shocked gas in the vicinity of the radio galaxy on the northern side. If the cluster atmosphere is denser in this direction, the shock wave will sweep up more material and advance more slowly per unit time than the southeastern front. The northwestern lobe is curtailed relative to the southeastern one, but 4 times more photons are required to measure a density gradient on the relevant scales.
If the high-temperature front is not a shock from the radio galaxy, its origin is not obvious. The radiative (free-free) cooling time of the hot gas in the region is more than 2 Gyr, but conduction due to hot electrons would also tend to spread out the thermal energy. It is possible this feature is a shock associated with a prior outburst that has since swept up material and become a large sound wave, but if it is traveling at the sound speed its distance from the active lobes would imply but a short delay between successive outbursts. It seems less likely that magnetic structures could produce a region (via anisotropic conduction) so much hotter than the surroundings. Without better data, we tentatively conclude that the feature is best explained as a shock associated with the current outburst.
Active Lobe Age and Jet Power
Assuming that the active lobes represent a single outburst and inflate bubbles as large as the region of radio emission, we can make a rough estimate of the jet power from the size of the active lobes using standard arguments: the average jet power is the cavity energy divided by the age of the outburst.
A note of caution is required because no cavity has actually been detected associated with the active lobes. Although it seems clear that radio jets must form bubbles in the ICM even when no cavity is detected, the filling factor of older cavities by ambient material is unknown. Assuming cylindrical cavities the volume depends only linearly on the projected length, so we sketch out order-of-magnitude estimates to place limits on the jet power.
The energy required to blow a bubble in the ICM is , where is the pressure, the volume, and the adiabatic constant for relativistic electrons. The cavity enthalpy can be expressed as
| (12) |
where the gas subscript refers to the ICM. kpc and kpc are estimates based on visual inspection of the M01 maps and subject to projection and resolution uncertainties; lower frequency maps suggest that a cylinder is a good representation. keV is obtained from 1-T fits to the region, and is likewise obtained from the spectral fit via the model emission measure. For assumed geometry we follow the method in Mahdavi et al. (2005), in which the emission is assumed to come from a spherical shell with outer radius and inner radius . The line-of-sight depth is then . Near the active lobes, dyne cm-2. Hence, erg. Note that is less certain than because of projection effects. Hence, if the wings were formed in the same outburst, the energy is only greater by a factor of 2.
A plausible range for the jet power can be obtained in view of the putative shock front. The presence of a shock suggests supersonic expansion, at least in the past—the radio jet is now more akin to that of an FR I source where subsonic expansion is expected. The Mach 2 shock implies a source age of less than 75 Myr, but since shocks sweep up material and slow down, the initial expansion was likely substantially faster. The well defined lobes that still give the radio galaxy an edge-brightened morphology suggest that the transition occurred recently, which is consistent with estimates of FR II and quasar lifetimes of tens of Myr (Bird et al., 2008; Martini, 2004). The shock front is also still relatively close to the radio galaxy, so a scenario in which the jets are simply illuminating a very old source is disfavored.
An average jet power of erg s-1, corresponding to a lobe age of 32 Myr, is consistent with the data. For reference, if NGC 326 had jet power commensurate with Cygnus A ( erg s-1; Stockton et al., 1994), its lobes would be inflated in just 0.3 Myr! There is no obvious cocoon and the source lacks hot spots, so this is clearly too high. On the lower end, transonic lobe expansion gives a jet power of erg s-1, which is inconsistent with the shock front. erg s-1 is therefore probably accurate to within a factor of , giving an age between 10–50 Myr. This power is akin to Perseus A (Fabian et al., 2006).
4. Discussion
4.1. Reconstructing the History of NGC 326
In view of the high resolution X-ray data, we re-examine the formation history of NGC 326 and its long wings. The salient results of the X-ray analysis follow: (i) The very long wings in a relatively cool environment require a single outburst to have an unrealistic age if they expanded transonically or slower. (ii) The putative shock and high-temperature rims appear to be causally connected to the radio outburst, but are inconsistent with the present-day jet, which strongly resembles an FR I source: the jet decelerates and breaks up before reaching the ends of the lobes, and no terminal hot spots are observed. Thus, we do not expect that the strong backflows associated with the hot spots of FR II sources are present in NGC 326. Still, it is notable that the active lobes are well defined and bright, which led to the original classification of the source as an FR II. (iii) The radio galaxy is situated at the region of brightest X-ray emission in the cluster, but the cluster emission shows structure on scales slightly smaller than the chip. The wings appear to follow an edge in this emission (Figure 2).
The data suggest that the outburst that produced the radio galaxy was much more powerful in the past. NGC 326 is very weak for an FR II source relative to its host galaxy luminosity (Cheung et al., 2009); if the present-day kinetic luminosity of the jet is in equipartition with the radiative luminosity, the jet power is on the order of erg s-1. Although equipartition need not be the case, the jet would need to be extremely radiatively inefficient in order to drive the shock and inflate the cavities if it is. The brightness of the jet near the core suggests this is not the case. If NGC 326 is the result of a powerful outburst that decayed, the shock and well defined lobes are natural consequences of the more powerful stage.
In fact, the parameters of such an outburst fall within the accepted parameters for radio-galaxy power and lifetime as well as the energy required in this system. Suppose that the jet power was initially erg s-1, more powerful than Perseus A but less powerful than Cygnus A, and decayed exponentially on an -folding time of 10 Myr (thought to be a typical FR II lifetime; Bird et al., 2008). Then the total energy input by the jet into the ICM is about erg, of which about two-thirds is injected during the FR II phase ( Myr). After an e-folding time, the power of this hypothetical jet is only a few times higher than the observed radio power of the core, and the energy injected into the ICM is within a factor of 2 of our cavity enthalpy estimate, shock energy and cosmic ray heating notwithstanding. Hence, a fast-rise exponential-decay scenario seems to fit NGC 326.
We can go a step farther since we know from the synchrotron cooling time that the plasma radiating at 5 GHz in the wings cannot be older than about 40 Myr, and from spectral aging arguments (following Myers & Spangler, 1985, using the spectral data of M01) that even the plasma radiating at 1.4 GHz is only about 10 Myr old. If this plasma was deposited by flows from the primary lobes to the wings, the wing length of 100 kpc implies flow speeds of km s-1, suggesting strong backflows (as in W95). Such backflows are associated with the hot spots of FR II sources (e.g. Leahy & Williams, 1984; Antonuccio-Delogu & Silk, 2010). The radio galaxy must then have been strong enough to form hot spots no more than a few tens of Myr ago. Note that this argument does not rely on a specific mechanism of wing formation as long as the wings are illuminated by active backflows. Such an age is consistent with the location and tentative strength of the shock, which imply an outburst age of (significantly) less than 75 Myr. If so, the length of the active lobes implies supersonic expansion, which is what we would expect from a jet driving a shock.
But where did the wings come from? There are two general ideas in the literature. First, it is possible that the wings are radio lobes which happen to grow in a different direction from the jet axis due to anisotropic pressure gradients in the hot atmospheres (e.g. W95, Leahy & Williams, 1984; Capetti et al., 2002). The other possibility is that the wings represent fossil lobes from a prior outburst in a different direction (e.g. Dennett-Thorpe et al., 2002; Merritt & Ekers, 2002). As NGC 326 has been used as the poster-child of several ideas presented in the literature, we will evaluate both hydrodynamic and reorientation models.
Powerful radio galaxies generate strong backflows at the hot spot zones of the jet head. These flows are quite rapid (up to 20% of the jet speed; Antonuccio-Delogu & Silk, 2010) despite the relatively slow advance of the jet head itself. W95 argue that these flows are buoyant in the ICM and, though rapid, may be deflected by a region of higher pressure. They find that flows of 3000 km s-1 would be buoyant in the ICM of NGC 326 and propose that they formed the wings. However, it is not likely that wings formed in this way advance at a speed close to the backflow speed. Simulations indicate that lobes are turbulent and that rapid backflows experience shocks within the lobe itself, dissipating bulk kinetic energy (e.g. Hodges-Kluck & Reynolds, 2011). Although magnetic fields may collimate flows, mature magnetized lobes still become quite turbulent (Huarte-Espinosa et al., 2011). In our recent work specifically investigating the action of pressure gradients on radio lobes in pure hydrodynamic simulations, we found that wings expand at most transonically due to this dissipation of backflow thrust. Hence, the presence of strong backflows does not guarantee rapid wing expansion (indeed, the internal sound speed of the lobes may be comparable to the backflow speed). In fact, it would be surprising if the simulations showed otherwise, since this would lead to wings significantly wider than the active lobes that also propagate faster than the jet head.
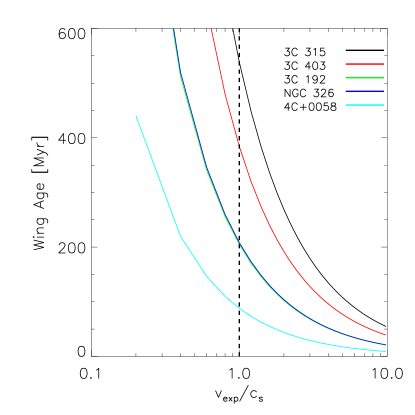
This is a significant problem because the wings in NGC 326 are at least 100 kpc long; some XRGs have even longer wings and are in cooler atmospheres. Any expansion mechanism that depends on the sound speed requires very old wings. Figure 8 shows the ages implied by (projected) wing lengths as a function of average expansion velocity for several XRGs with detected IGM/ICM emission. For reference, it would take 200 Myr to inflate the wings of NGC 326 transonically and 250 Myr to do so buoyantly.
Another possibility is that the radio galaxy is born in a dense elliptical environment with the jet aligned with the major axis of the atmosphere. The cocoon formed by the spent jet material may then become overpressured if the jet advance is stalled by the dense atmosphere, and at some point it will rupture along the minor axis, thereby forming wings (Capetti et al., 2002). Before pressure equilibrium is established, the outflow will be supersonic; afterwards, it will be akin to the buoyant backflow scenario. NGC 326 is not currently overpressured relative to its surroundings (M01, Worrall & Birkinshaw, 2000), so despite the local ICM conforming roughly to the geometry required in the Capetti et al. (2002) model, expansion would currently be driven by buoyancy and bulk flows. As described above, this expansion would be subsonic.
The circumstantial evidence therefore favors a reorientation scheme. Detection of a bow shock ahead of the wings would be a strong indictment of the backflow models, but there are insufficient counts in the CXO image to perform an adequate search. We note that the temperature map in Figure 6 reveals bins to the northeast and northwest of the cavity that are times hotter than the surrounding bins, and extraction of (low signal) spectra from bins half the size (700 counts) suggests the ICM is indeed hotter closer to the cavity edges. About four times as many counts are required to determine if this is shock heating.
On the other hand, the problem with reorientation models, as noted by W95 and Gopal-Krishna et al. (2003), is that the wings have Z-shaped morphology and the eastern wing has an off-axis extension to the northwest (Figure 1). In response to the Z-shaped wings, Gopal-Krishna et al. (2003) proposed a hybrid hydrodynamic and reorientation model in which a stream of ISM from a merging galaxy deflects the jet, thereby forming a ZRG. If a SMBH binary is formed by this merger, upon coalescence the jet axis will change and the ZRG becomes a fossil; the new lobes give the overall radio emission X-shaped morphology. This model was proposed for NGC 326 by Gopal-Krishna et al. (2003) and updated for the same by Zier (2005) with the suggestion that a stream of dense gas bent the jets at a radius between 25–50 kpc from the core. For reference, the projected separation between the nuclei of the dumbbell components in NGC 326 is 6.4 kpc.
A strength of the Gopal-Krishna et al. (2003) model is that it naturally explains the tendency for XRGs to fall near the FR I/II break (with the most recent confirmation in Cheung et al., 2009). This is because deflecting a jet requires (from purely hydrodynamic considerations) the pressure exerted by the jet on the ISM to be balanced by the pressure of the gas. For reasonable estimates of the density and bulk motion of streams of merging gas, highly relativistic jets cannot be stopped. Indeed, the non-winged FR II sources whose jets are deflected by interaction with dense gas also tend to have radio luminosity close to the FR I/II divide (e.g. PKS 215369; Young et al., 2005) or hybrid lobe morphology (e.g. 3C 321; Evans et al., 2008).
However, a jet weak enough to be deflected by the ram pressure of the ISM would likely inflate lobes at some fraction or low multiple of the sound speed (as is thought to be the case with FR I sources). Tying expansion to the sound speed suggests very long radio galaxy lifetimes (Figure 8). Apart from fueling the AGN steadily, this timescale would require the bending agent to be in contact with the jet at favorable orientations on both sides of the galaxy for up to hundreds of Myr. A gas stream 25–50 kpc from the AGN with bulk motion of 200 km s-1 (comparable to streams in similar systems; Zier, 2005) would travel perhaps tens of kpc in this time, meaning the stream must be very long and fortunately oriented in order to keep the jet bent at roughly the same angle at the same radius from the core. Although conceivable, this is a very special circumstance. Another objection in the same vein is that the time between the production of these streams of rotating gas and the coalescence of a SMBH binary that engenders the present X-shaped morphology must also be up to hundreds of Myr or the wings would not have gotten so long, regardless of the stream geometry. The time required for a SMBH binary to coalesce is unknown, but one might imagine that if the radio galaxy were driven by a component of the SMBH binary over 100 Myr, accretion from the same disk of gas would cause the spins to become aligned prior to the merger and forestall a spin-flip upon coalescence (Bogdanović et al., 2007). It is possible that the Gopal-Krishna et al. (2003) model is essentially correct, but it faces two hurdles: there is presently no evidence for the required streams in NGC 326 and the streams, if found, must be able to bend a powerful jet.
It is possible that the Z-shaped morphology formed after reorientation. The buoyant backflow and overpressured cocoon models both take advantage of the anisotropy of the atmosphere to push the radio lobes in the right direction. This motion would still occur with fossil relics. Suppose that, while active, the lobes of the wings formed an axis across the nucleus, but since the extinction of the jet in that direction evolve buoyantly. If the major axis of the pocket of ICM they inhabit is somewhat off-axis from the major axis of the radio galaxy (but still close enough to satisfy the Capetti et al., 2002, correlation), buoyancy will tend to lift the wings away from the higher pressure core in opposite directions. The centers of the wings are about 25 kpc away from a line that would connect them to the nucleus, implying a rise time of less than 50 Myr. This is consistent with the age of the active lobes. There is evidence that the wings do respond to the pressures in the ICM: both appear to be following a ridge of brighter ICM emission (Figure 5), forming a large but shallow arc. Assuming the wings were bent into this shape after the jet ceased, the radius of curvature compared to a straight line through the wings suggests buoyancy would produce this morphology within 40–70 Myr depending on the distance from the core (this estimate does not take into account spatial variations in the buoyant terminal velocity due to an anisotropic medium). However, the plume to the northwest of the eastern wing (Figure 1) would take longer to rise and is not well explained by this scenario.
4.2. Wings and Radio-Mode Feedback
In any plausible wing formation scenario, the very long wings of NGC 326 are presently evolving passively in the ICM, i.e., as buoyant structures subject to hydrodynamic forces. They are therefore akin to “dead” radio galaxies (Reynolds et al., 2002) in which the jet has ceased (in the model of Merritt & Ekers, 2002, this is precisely what they are). Dead radio galaxies are notoriously rare (for one example, see Worrall et al., 2007), but crucial to the paradigm of “radio-mode” AGN feedback.
In radio-mode feedback, radiative cooling in the ICM is regulated by the condensation of gas onto the central galaxy, fueling an AGN that drives energetic outflows into the ICM, heating it. X-ray cavities associated with radio lobes provide incontrovertible evidence that these outflows exist, interact with the ICM by inflating bubbles of relativistic plasma in it, and deposit sufficient energy to regulate cooling (for a recent review, see Gitti et al., 2011). However, it is not clear that these outflows do regulate cooling, since we do not know how this energy is thermalized and isotropized or on what timescales this occurs.
Several heating mechanisms have been identified. These include active heating through strong or weak shocks; adiabatic expansion of a jet-blown cavity; and damped sound waves associated with the cavity inflation, and passive heating such as entrainment of material in a buoyant plume or infall of displaced gas behind a buoyant bubble (McNamara & Nulsen, 2007, and references therein). Although X-ray observations demonstrate that all of these occur, their relative importance (which may be a function of time, environment, and jet power) is unknown. A key problem is that the life cycle of AGNs (which itself may be a function of redshift and whether the host galaxy is in a group or a cluster) is not understood. For example, an AGN with a short duty cycle punctuated by brief, powerful outbursts may be less effective at heating than an AGN that more or less continually blows small bubbles (“effervescent” heating; Begelman, 2001). Dead radio galaxies are therefore of interest, since their frequency is a measure of the AGN duty cycle and the rate at which they heat the ICM is a measure of the importance of passive heating.
Thus, wings may be of interest as probes of feedback. If XRG wings are dynamically similar to dead radio galaxies, they offer a few additional advantages as laboratories of dead sources. First, dead radio galaxies are most frequently detected as “ghost” cavities unassociated with GHz emission (e.g. Fabian et al., 2000; Rafferty et al., 2006; Dong et al., 2010), but ghost cavities are typically detected near the group or cluster core where the surface brightness is high. It can therefore be difficult to distinguish between features associated with old outbursts and the active ones. Wings, on the other hand, can extend more than 100 kpc from the AGN and in a very different direction. Second, it is difficult to age ghost cavities, whereas a better understanding of wing formation would yield the ages of both the active lobes and wings in XRGs. Third, winged sources are typically located in group rather than cluster environments. Until recently, feedback in groups has been largely neglected, but non-gravitational processes are even more important in these systems than in clusters, and the total number of galaxies in groups far outweighs the cluster population.
Our examination of the formation history of NGC 326 suggests another advantage to XRG wings: if the reason XRGs are typically found near the FR I/II break because they represent decaying outbursts, the total active and passive energy injection rates over the history of the source can be measured in the same system. The deep X-ray observations required for this kind of measurement only exist in a handful of clusters with both active lobes and ghost cavities (the most prominent, of course, is Perseus; Fabian et al., 2006). Since groups are much fainter, it is essential to have good targets.
The CXO observation of NGC 326 is not deep enough to carry out heating measurements, but the surface brightness of features detected suggests that an exposure with four times the counts (twice the signal) would suffice. For example, the high-temperature front has about 4,000 counts in its vicinity. To determine if it is a shock and measure its strength to 10% accuracy requires surface brightness values and deprojected temperatures to at least this accuracy in semi-annular bins about 15 arcsec wide at a radius of 50 kpc from the nucleus. This would require about 15,000 counts per bin. Since strong shocks are much more efficient at irreversibly heating the ICM than weak ones, the shock strength is of interest.
Likewise, the cavity in the wing would be detected at the level in an exposure of this duration, and cavities associated with the other lobes (which we assume to be there) would be easily detected, barring pathological projection effects. In the wing, this quality of detection would place tight constraints on the cavity size, important for determining the cavity stability and placing boundaries from which to measure the amount of entrained material, uplifted material, and temperature or metallicity gradients. An image with twice the signal would allow for adapative binning at scales significantly smaller than the lobe size with temperature measurements accurate to 20%. Specific entropy (a surer measure of irreversible heating than temperature) could also be measured on these scales. Metallicity could be determined in slightly larger bins that would still be smaller than the lobe size, enabling a measurement of metallicity gradients around and behind the cavity. Given an accurate measurement of the terminal buoyant velocity of the bubble, the displacement heating rate (Bîrzan et al., 2004) could then be measured.
Thus, while the extant CXO image lacks the depth to take advantage of the measurements sketched here, it demonstrates that such measurements are well within reach. The utility of XRG wings depends on high-quality X-ray data and better understanding wing origin, so flux estimates in other systems are important. Only 13 XRGs have CXO or XMM-Newton data, and only 8 of these have significant IGM/ICM emission (model flux estimates provided in Hodges-Kluck et al., 2010). Only two of these have moderately deep exposures (NGC 326 and 4C +00.58). The CXO image presented here suggests that for larger XRGs, the higher effective area of XMM-Newton makes it a better instrument for these types of measurements.
5. Summary and Conclusions
We report on a 100 ks CXO image of NGC 326, an XRG with wings 100 kpc long that resides in a poor cluster. Owing to its dramatic wings, NGC 326 has frequently been the subject of studies attempting to explain wing origin (W95; Wirth et al., 1982; Merritt & Ekers, 2002; Gopal-Krishna et al., 2003; Dennett-Thorpe et al., 2002; Zier, 2005; Capetti et al., 2002; Lal & Rao, 2005). The CXO image provides an important step forward in evaluating these hypotheses due to the identification of several X-ray features associated with the radio galaxy. These include a high-temperature front to the southeast of the radio galaxy (Figure 6), which we assume to be a shock front, high-temperature knots of emission around the radio galaxy akin to cavity rims (Figure 5), and a cavity associated with the eastern wing (Figure 7). The high angular resolution of CXO compared to ROSAT also allows us to remove point sources and characterize the broader ICM, revealing an X-ray peak associated with the northern lobe of the radio galaxy rather than the ISM and an elliptical enhancement around the radio galaxy (first identified in Hodges-Kluck et al., 2010).
By characterizing the immediate environment of the radio galaxy and taking into account spectral aging of the radio emission in the wings, we can construct a reasonable history for the AGN outbursts. The jets, lack of hot spots, and low radio power ( erg s-1) indicate a weak FR I-like source today, but the putative shock front, lobe size and morphology, and GHz emission at the wing tips indicate a powerful FR II source no more than 30 Myr ago. We therefore suggest the kinetic jet power could be described as erg s-1, where Myr for the current outburst. This function would account for the observed features as well as produce about the right amount of cavity enthalpy. The energy required to inflate cavities the size of the lobes places the current kinetic jet power between erg s-1. The radio power suggests that the flow is therefore still radiatively inefficient.
NGC 326 is the best studied XRG, and the variety of wing formation models associated with it is a testament to the difficulty of proving any one scenario. The sound speed in the ICM is only 500 km s-1 ( kpc Myr-1), implying that the long (100 kpc) wings must have expanded supersonically. This disfavors the backflow models, which have yet to convincingly demonstrate that internal lobe flows can generate sustained supersonic expansion; simulations indicate that they become turbulent and dissipate their thrust before reaching the wing edges. In fact, any model in which the wing growth is related to the sound speed is disfavored in systems with long wings (Figure 8). The most likely alternative is that the wings are fossil relics illuminated by the present outburst, but Gopal-Krishna et al. (2003) note that a simple spin-flip would not explain the Z-shaped morphology of the wings. However, their model relies on bending a moderately weak jet, which would not be expected to propel hypersonic lobes. As fossil radio lobes would be subject to hydrodynamic forces, it is possible that the Z-shaped morphology of the wings is produced by buoyant evolution in an anisotropic atmosphere. It would take less than 50 Myr for the wings to rise buoyantly away from an axis connecting them through the nucleus to their present-day location, which is consistent with the age of the active lobes and the age required for the wings to respond to the anisotropy of the large-scale cluster emission to form the understated C-shaped arc (Figure 5). However, this scenario fails to explain the plume on the eastern wing. It is also notable that the tendency for XRGs to have jets co-aligned with the major axes of their host galaxies (Capetti et al., 2002; Saripalli & Subrahmanyan, 2009) and hot atmospheres (Hodges-Kluck et al., 2010) extends to XRGs with very long wings. This is unexplained by any reorientation model, and remains compelling evidence that the environments of most XRGs help determine their morphology.
XRGs provide an important target for characterizing AGN feedback through the study of “ghost” cavities, both as pathfinders (they illuminate the cavities in the GHz bands) as well as targets which are readily distinguished from the active outburst. The heating rate associated with dead outbursts can then be measured in isolation, and compared to the timescales required to thermalize and isotropize the energy in the ICM. In cases such as NGC 326, where we believe most of the energy associated with the active outburst has already been deposited, we can use the AGN lifetime to estimate an average heating rate, assuming some duty cycle. XRGs are therefore interesting beyond the origin of their bizarre morphology.
References
- Antonuccio-Delogu & Silk (2010) Antonuccio-Delogu, V., & Silk, J. 2010, MNRAS, 405, 1303
- Arnaud (1996) Arnaud, K. A. 1996, in Astronomical Society of the Pacific Conference Series, Vol. 101, Astronomical Data Analysis Software and Systems V, ed. G. H. Jacoby & J. Barnes, 17–+
- Begelman (2001) Begelman, M. C. 2001, in Astronomical Society of the Pacific Conference Series, Vol. 240, Gas and Galaxy Evolution, ed. J. E. Hibbard, M. Rupen, & J. H. van Gorkom, 363–+
- Bird et al. (2008) Bird, J., Martini, P., & Kaiser, C. 2008, ApJ, 676, 147
- Bîrzan et al. (2004) Bîrzan, L., Rafferty, D. A., McNamara, B. R., Wise, M. W., & Nulsen, P. E. J. 2004, ApJ, 607, 800
- Bogdanović et al. (2007) Bogdanović, T., Reynolds, C. S., & Miller, M. C. 2007, ApJ, 661, L147
- Capetti et al. (2000) Capetti, A., de Ruiter, H. R., Fanti, R., Morganti, R., Parma, P., & Ulrich, M.-H. 2000, A&A, 362, 871
- Capetti et al. (2002) Capetti, A., Zamfir, S., Rossi, P., Bodo, G., Zanni, C., & Massaglia, S. 2002, A&A, 394, 39
- Cappellari & Copin (2003) Cappellari, M., & Copin, Y. 2003, MNRAS, 342, 345
- Cheung et al. (2009) Cheung, C. C., Healey, S. E., Landt, H., Verdoes Kleijn, G., & Jordán, A. 2009, ApJS, 181, 548
- Colla et al. (1975) Colla, G., Fanti, C., Fanti, R., Gioia, I., Lari, C., Lequeux, J., Lucas, R., & Ulrich, M.-H. 1975, A&A, 38, 209
- Dennett-Thorpe et al. (2002) Dennett-Thorpe, J., Scheuer, P. A. G., Laing, R. A., Bridle, A. H., Pooley, G. G., & Reich, W. 2002, MNRAS, 330, 609
- Diehl et al. (2008) Diehl, S., Li, H., Fryer, C. L., & Rafferty, D. 2008, ApJ, 687, 173
- Diehl & Statler (2006) Diehl, S., & Statler, T. S. 2006, MNRAS, 368, 497
- Diehl & Statler (2007) —. 2007, ApJ, 668, 150
- Dong et al. (2010) Dong, R., Rasmussen, J., & Mulchaey, J. S. 2010, ApJ, 712, 883
- Ekers et al. (1978) Ekers, R. D., Fanti, R., Lari, C., & Parma, P. 1978, Nature, 276, 588
- Evans et al. (2008) Evans, D. A., et al. 2008, ApJ, 675, 1057
- Fabian et al. (2006) Fabian, A. C., Sanders, J. S., Taylor, G. B., Allen, S. W., Crawford, C. S., Johnstone, R. M., & Iwasawa, K. 2006, MNRAS, 366, 417
- Fabian et al. (2000) Fabian, A. C., et al. 2000, MNRAS, 318, L65
- Gitti et al. (2011) Gitti, M., Brighenti, F., & McNamara, B. R. 2011, ArXiv e-prints
- Gopal-Krishna et al. (2003) Gopal-Krishna, Biermann, P. L., & Wiita, P. J. 2003, ApJ, 594, L103
- Hodges-Kluck & Reynolds (2011) Hodges-Kluck, E. J., & Reynolds, C. S. 2011, ApJ, 733, 58
- Hodges-Kluck et al. (2010) Hodges-Kluck, E. J., Reynolds, C. S., Cheung, C. C., & Miller, M. C. 2010, ApJ, 710, 1205
- Huarte-Espinosa et al. (2011) Huarte-Espinosa, M., Krause, M., & Alexander, P. 2011, MNRAS, 417, 382
- Kalberla et al. (2005) Kalberla, P. M. W., Burton, W. B., Hartmann, D., Arnal, E. M., Bajaja, E., Morras, R., & Pöppel, W. G. L. 2005, A&A, 440, 775
- Lal & Rao (2005) Lal, D. V., & Rao, A. P. 2005, MNRAS, 356, 232
- Leahy & Williams (1984) Leahy, J. P., & Williams, A. G. 1984, MNRAS, 210, 929
- Luo & Sadler (2010) Luo, Q., & Sadler, E. M. 2010, ApJ, 713, 398
- Mahdavi et al. (2005) Mahdavi, A., Finoguenov, A., Böhringer, H., Geller, M. J., & Henry, J. P. 2005, ApJ, 622, 187
- Martini (2004) Martini, P. 2004, Coevolution of Black Holes and Galaxies, 169
- McNamara & Nulsen (2007) McNamara, B. R., & Nulsen, P. E. J. 2007, ARA&A, 45, 117
- Merritt & Ekers (2002) Merritt, D., & Ekers, R. D. 2002, Science, 297, 1310
- Murgia et al. (2001) Murgia, M., Parma, P., de Ruiter, H. R., Bondi, M., Ekers, R. D., Fanti, R., & Fomalont, E. B. 2001, A&A, 380, 102
- Myers & Spangler (1985) Myers, S. T., & Spangler, S. R. 1985, ApJ, 291, 52
- Pacholczyk (1970) Pacholczyk, A. G. 1970, Radio astrophysics. Nonthermal processes in galactic and extragalactic sources, ed. Pacholczyk, A. G.
- Rafferty et al. (2006) Rafferty, D. A., McNamara, B. R., Nulsen, P. E. J., & Wise, M. W. 2006, ApJ, 652, 216
- Reynolds et al. (2002) Reynolds, C. S., Heinz, S., & Begelman, M. C. 2002, MNRAS, 332, 271
- Saripalli & Subrahmanyan (2009) Saripalli, L., & Subrahmanyan, R. 2009, ApJ, 695, 156
- Smith et al. (2001) Smith, R. K., Brickhouse, N. S., Liedahl, D. A., & Raymond, J. C. 2001, ApJ, 556, L91
- Spergel et al. (2007) Spergel, D. N., et al. 2007, ApJS, 170, 377
- Stockton et al. (1994) Stockton, A., Ridgway, S. E., & Lilly, S. J. 1994, AJ, 108, 414
- Tavecchio et al. (2006) Tavecchio, F., Maraschi, L., Sambruna, R. M., Gliozzi, M., Cheung, C. C., Wardle, J. F. C., & Urry, C. M. 2006, ApJ, 641, 732
- Wirth et al. (1982) Wirth, A., Smarr, L., & Gallagher, J. S. 1982, AJ, 87, 602
- Worrall & Birkinshaw (2000) Worrall, D. M., & Birkinshaw, M. 2000, ApJ, 530, 719
- Worrall et al. (1995) Worrall, D. M., Birkinshaw, M., & Cameron, R. A. 1995, ApJ, 449, 93
- Worrall et al. (2007) Worrall, D. M., Birkinshaw, M., Kraft, R. P., & Hardcastle, M. J. 2007, ApJ, 658, L79
- Young et al. (2005) Young, A. J., Wilson, A. S., Tingay, S. J., & Heinz, S. 2005, ApJ, 622, 830
- Zier (2005) Zier, C. 2005, MNRAS, 364, 583
- Zwicky & Kowal (1968) Zwicky, F., & Kowal, C. T. 1968, ”Catalogue of Galaxies and of Clusters of Galaxies”, Volume VI, ed. Zwicky, F., Herzog, E., & Wild, P.