Refined Metallicity Indices for M Dwarfs Using the SLoWPoKES Catalog of Wide, Low-mass Binaries
Abstract
We report the results from spectroscopic observations of 113 ultra-wide, low-mass binary systems, composed largely of M0–M3 dwarfs, from the SLoWPoKES catalog of common proper motion pairs identified in the Sloan Digital Sky Survey. Radial velocities of each binary member were used to confirm that they are co-moving and, consequently, to further validate the high fidelity of the SLoWPoKES catalog. Ten stars appear to be spectroscopic binaries based on broad or split spectral features, supporting previous findings that wide binaries are likely to be hierarchical systems. We measured the H equivalent width of the stars in our sample and found that components of 81% of the observed pairs has similar H levels. The difference in H equivalent width amongst components with similar masses was smaller than the range of H variability for individual objects. We confirm that the Lepine et al. -index traces iso-metallicity loci for most of our sample of M dwarfs. However, we find a small systematic bias in , especially in the early-type M dwarfs. We use our sample to recalibrate the definition of . While representing a small change in the definition, the new is a significantly better predictor of iso-metallicity for the higher mass M dwarfs.
Subject headings:
binaries: visual — binaries: spectroscopic — stars: abundances — stars: kinematics — stars: low mass, brown dwarfs — stars: magnetic fields stars: subdwarfs1. Introduction
Low-mass stars, generally defined as the regime bracketed by the hydrogen-burning limit (0.08 M☉) and the onset of molecular lines in the photosphere (0.8 M☉), make up 70% of the Milky Way’s stars (Bochanski et al., 2010) and are, perhaps, the best tracers of the structure, dynamics, and evolutionary history of the Galaxy. However, their intrinsic faintness has historically limited the construction of large samples. In addition, the ubiquitous molecular features in their photospheres and the resulting incomplete line lists has restricted the accuracy and usefulness of theoretical atmospheric models. Large surveys, such as the Sloan Digital Sky Survey (SDSS; York et al., 2000) and the Two Micron All Sky Survey (2MASS; Skrutskie et al., 2006), have played a large role in advancing our understanding of low-mass stars. With a photometric catalog of more than 33 million (Bochanski et al., 2010) and a spectroscopic catalog of more than 70,000 (West et al., 2011) M dwarfs, SDSS has enabled studies of the spatial (Bochanski et al., 2010) and kinematic distributions (Bochanski et al., 2007b; Fuchs et al., 2009) in the Milky Way; the mass and luminosity functions (Covey et al., 2008; Bochanski et al., 2010); and magnetic activity (e.g., West et al., 2008, 2011; Kruse et al., 2010; Kowalski et al., 2009; Hilton et al., 2010) of low-mass stars.
The metallicity of low-mass stars remains an elusive parameter to measure. Given the large number of M dwarfs in the Milky Way, an absolute metallicity scale tied to an easily observable spectral index would allow for the tracing of the formation history and the chemical evolution of the Galaxy (e.g., West et al., 2008), the dependence of the fundamental mass–radius relation on metallicity at the bottom of the main sequence (e.g., López-Morales, 2007), and the relationship between metallicity and the presence of planets (e.g., Laws et al., 2003; Valenti & Fischer, 2008). While spectral modeling has allowed for metallicity determinations and well-defined metallicity indices for warmer stars, such efforts in the late-K and M spectral type regimes (e.g., Hauschildt, Allard, & Baron 1999; Witte et al. 2011) have met with notable problems due to the onset of broad molecular lines at 4300 K and due to incomplete molecular line lists. Some authors have tried to use photometric indices to infer the metallicity (Bonfils et al., 2005; Johnson & Apps, 2009; Schlaufman & Laughlin, 2010), but these techniques rely on trigonometric parallax measurements which are uncommon for M dwarfs.
Some useful spectral features that correlate with metallicity have been identified. In the near-infrared, Rojas-Ayala et al. (2010) developed a metallicity indicator based on the strength of the Na I doublet, the Ca I triplet, and a temperature-sensitive water index. This technique has so far only been calibrated over a limited range but delivers the greatest precision among current techniques. Meanwhile, much effort has gone into optical spectra. As the TiO band in the optical spectrum becomes weaker with decreasing metallicity (Bessell, 1982), the ratio of CaH and TiO molecular bands has been used to distinguish M dwarfs from M subdwarfs (Kirkpatrick, Henry, & McCarthy, 1991; Reid, Hawley, & Gizis, 1995; Gizis, 1997; Lépine, Rich, & Shara, 2003; Burgasser & Kirkpatrick, 2006). Building on these studies, Lépine, Rich, & Shara (2007, hereafter LRS07) defined the metallicity-dependent quantity using the Reid et al. (1995) CaH2, CaH3, and TiO5 molecular band heads; this allowed for the segregation of low-mass dwarfs into four classes: dwarfs (dMs), subdwarfs (sdMs), extreme subdwarfs (esdMs), and ultra subdwarfs (usdMs). These classes may also trace the Galactic populations to which these stars belong: dMs were formed in the thin disk, sdMs in the thick disk, and esdMs/usdMs in the halo. LRS07 calibrated the definition of using the visual binary pairs known at the time, including four sdM and two esdM pairs. Woolf, Lépine, & Wallerstein (2009) mapped the index to an absolute metallicity scale using dM binaries with a FGK companion of measurable absolute metallicity; but it suffers from significant scatter (0.3 dex).
Wide binary (or multiple) systems are ideal, coeval laboratories to constrain and calibrate the observable properties of stars as the components were presumably formed at the same time and from the same primordial material but have evolved independently. In Dhital et al. (2010, hereafter Paper I) we identified the Sloan Low-mass Wide Pairs of Kinematically Equivalent Stars (SLoWPoKES) catalog consisting of 1342 ultra-wide, low-mass common proper motion (CPM) binary systems from the SDSS Data Release 7 (DR7; Abazajian et al., 2009) by matching angular separations, photometric distances, and proper motions. The binary systems in the catalog have at least one low-mass (spectral subtype K5 or later) component, projected physical separations of 103–105 AU, and distances of 50–800 pc. While most SLoWPoKES pairs are disk dwarfs, 70 low-metallicity sdM and 21 white dwarf–dM pairs were identified based on their reduced proper motions. A Galactic model—based on empirical constraints on the stellar number density (Bochanski et al., 2010; Jurić et al., 2008) and velocity (Bochanski et al., 2007a) distributions in the Milky Way—was used to assess the probability that the candidates were a chance alignment of random stars; only pairs with such probabilities 5% were published in the SLoWPoKES catalog. The overall fidelity of the catalog is expected to be 98%. Hence, the SLoWPoKES catalog is a very clean and diverse source of CPM binary systems to be used in follow-up studies. As the SLoWPoKES catalog spans a wide range in mass and a smaller, but still considerable, range in metallicity, it is an ideal sample to constrain the index as well as to eventually map it to an absolute metallicity space.
Magnetic activity has been shown to decline with age, with activity lifetimes of 1–2 Gyr for M0–M3 and 7–8 Gyr for M5–M7 dwarfs (West et al., 2006, 2008, 2011). This monotonic decline of activity with age is a signature of stellar spin-down and suggestive of a gyrochronology-like age–rotation–activity relationship in M dwarfs (Skumanich, 1972; Barnes, 2003, 2007; Delorme et al., 2010). Leveraging the coevality of components of the SLoWPoKES pairs is a good way of testing this relationship.
We have carried out a spectroscopic follow-up study of 113 CPM pairs from the SLoWPoKES catalog. Section 2 details our observations and the data reduction procedures. In Section 3 we use our radial velocities to assess the fidelity of the observed SLoWPoKES pairs, use them to redefine the LRS07 index, and examine the magnetic activity properties of the SLoWPoKES pairs. The conclusions are presented in Section 4.
2. Observations & Data Reduction
The spectroscopic targets were selected from the SLoWPoKES catalog based on their brightnesses, colors, and inferred mass ratios. Both components were required to be brighter than so as to obtain the desired S/N within a reasonable integration time. Efforts were made to obtain (i) an even distribution in space for both the primary and secondary components and (ii) a roughly equal number of equal-mass (within 5% of each other) and unequal-mass ( 5% of each other) systems. We estimated masses from the colors based on Kraus & Hillenbrand (2007).
Observations were carried out with the GoldCam spectrograph on the KPNO 2.1m telescope on two separate observing runs on January 11–16, 2009 UT and March 26–31, 2010 UT. For both runs, the #36 grating (1200 lines mm-1) in the first order, blazed at 7500 Å, along with the OG 550 order-blocking filter were used resulting in a wavelength coverage of 6200–8200 Å with a dispersion of 0.62 Å pixel-1. A slit width of 2″ was used to maximize the number of photons collected yielding an effective resolution of 1.8 Å and a resolving power of 3500. Both components of a binary were observed at the same time by rotating the slit to align with the position angle of the binary. While the rotation had to be done manually and required 10 min of overhead time, it was more efficient than observing each component separately.
Each night quartz flats and biases were taken before the targets were observed; when the first half of the night was lost due to weather, the flats and biases were taken in the morning. For wavelength calibration, HeNeAr comparison arcs, along with the BG 38 order-blocking filter, were generally taken after each target or when the CCD orientation was rotated. A suite of radial velocity standards from Delfosse et al. (1998) were observed, which we used to assess our radial velocity precision (see below). Similarly, a flux standard—HZ 44, a bright sdO star—was observed each night during the second run. Both observing runs were conducted in bright time, often during non-photometric seeing. A combination of clouds and high winds caused the loss of 3–4 nights between the two runs.
| Name | Spectral Type | (km s-1) |
|---|---|---|
| GJ 1057 | M4 | 27 |
| GJ 1093a | M4 | 30 |
| GJ 1111 | M8 | 9 |
| GJ 1156 | M5 | 4 |
| Gl 70 | M2 | 26 |
| Gl 105b | M3 | 26 |
| Gl 109 | M2 | 30 |
| G 16508 | M4 | 8 |
| Gl 205 | M0 | 8 |
| Gl 251 | M2 | 22 |
| Gl 338 | M0 | 11 |
| Gl 380 | K5 | 26 |
| Gl 411 | M2 | 85 |
| Gl 412B | M5 | 68 |
| Gl 450 | M1 | 0 |
| Gl 514 | M0 | 14 |
| Gl 581 | M2 | 10 |
| Gl 623 | M2 | 27 |
| Gl 625 | M1 | 13 |
| LHS 1805 | M4 | 1 |
| LHS 2520 | M3 | 80 |
| LHS 1885 | M4 | 16 |
All spectra were bias-subtracted, flat-fielded, extracted, co-added, wavelength-calibrated, and flux-calibrated111As flux-calibrations were not taken for the first run, we used a subset of radial velocity standards, which had absolute flux measurements as part of the Palomar-Michigan State Survey (Reid et al., 1995), as flux standards. using standard IRAF222IRAF is distributed by the National Optical Astronomy Observatory, which is operated by the Association of Universities for Research in Astronomy (AURA) under cooperative agreement with the National Science Foundation. procedures, following the prescription detailed in Massey et al. (1992). Eighteen pairs where one of the components (usually the fainter secondary) was not well-calibrated or had low S/N were removed from the sample. The stars were then manually spectral typed with the HAMMER pipeline (Covey et al., 2007); the error in the process is expected to be smaller than one sub-type, as discussed by West et al. (2011).
The radial velocities () of the stars were measured by cross-correlating the spectra using IDL routine xcorl.pro (Mohanty & Basri, 2003; West & Basri, 2009) with the appropriate spectral type templates from Bochanski et al. (2007b), which are in the heliocentric rest frame. The cross-correlation was performed in the wavelength range of 6600–7550 Å. Since templates are only available for M0–L0 dwarfs, M0 templates were used for K7 dwarfs. However, as each spectral type spans a range in mass and temperature, the spectral features in stars of the same subtype can differ significantly. This is probably the largest source of error in measuring with the cross-correlation techniques. However, cross-correlation with templates typically yields with 10 km s-1 precision for SDSS spectra (Bochanski et al., 2007a) Other sources of error include difference in resolution between the template and object spectra and the accuracy of wavelength calibration, which was 0.04 Å/pixel rms (1.4 km s-1) for all but a few of the objects.
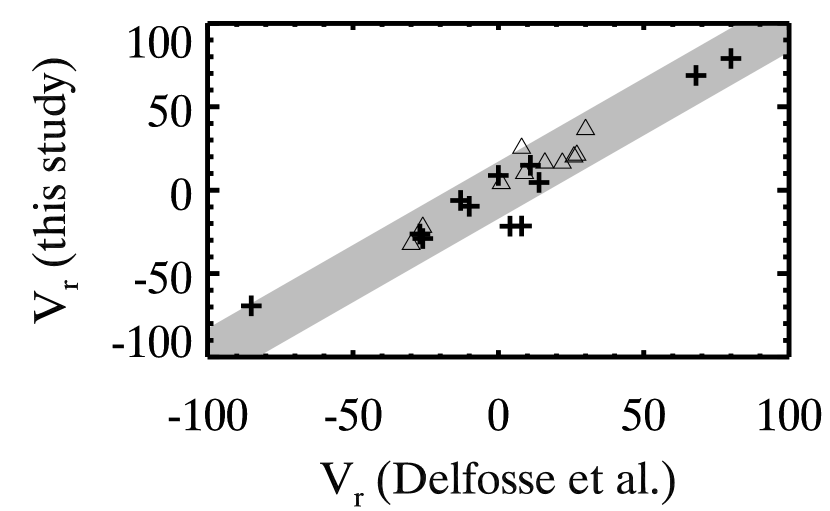
To assess the errors in our radial velocities, we cross-correlated the observed radial velocity standards (Delfosse et al., 1998) with appropriate templates from Bochanski et al. (2007b). Figure 1 shows the comparison between our measured values and the Delfosse et al. (1998) values, which were measured from high-resolution spectra. Apart from three outliers from the 2010 seasons, our values compare well with the Delfosse et al. (1998). The median absolute deviation (m.a.d.) of the difference was 5.7 km s-1; we adopt 6 km s-1 as the typical error in our measurement of .
The spectra were then corrected for the measured radial velocities to be in the heliocentric rest frame and fed back into the HAMMER pipeline to measure the equivalent width of H; the molecular band strengths of CaH2, CaH3, and TiO features; and the S/N of the spectra, which was measured in the region spanning 6500–6550 Å.
3. Results
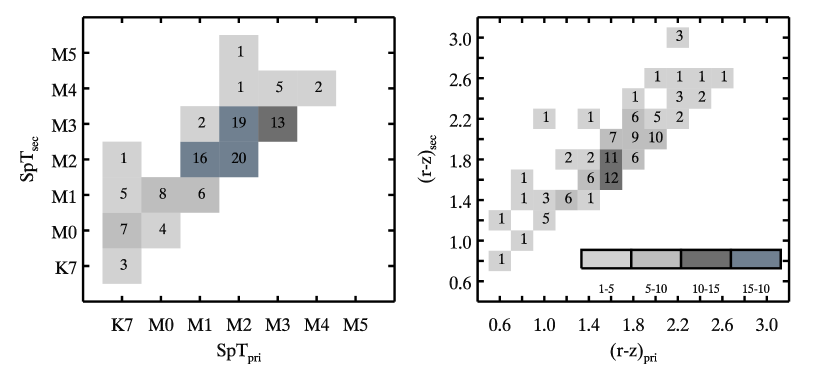
Figure 2 shows the spectral type and color distributions of the primary and the secondary components of the 113 SLoWPoKES pairs that were observed (Table 3); the number of pairs in each bin is also shown. The observed sample, excluding pairs that were rejected for low S/N or other reasons, spans the K7–M4 spectral types ( 0.66–2.52) for the primary and K7–M5 ( 0.77–3.08) for the secondary. Even though our observed sample was limited to 17 and, thus, a dearth of late-type M dwarfs was to be expected, there are nonetheless 11 pairs with at least one component later than M4 and only two pairs with both components later than M4.
| ID | Right Ascension | Declination | distance | ||||||||||||||
|---|---|---|---|---|---|---|---|---|---|---|---|---|---|---|---|---|---|
| A | B | A | B | A | B | A | B | A | B | A | B | ||||||
| SLW J2000 | (hh mm ss.s) | (dd mm ss.ss) | (pc) | (mas yr-1) | (mas yr-1) | (km s-1) | |||||||||||
| 1512+20 | 15 12 22.52 | 15 12 25.41 | +20 28 20.6 | +20 28 12.3 | 63 | 58 | -49 | -48 | 4 | 7 | -84.8 | -77.8 | |||||
| 0831+36 | 08 31 23.12 | 08 31 23.16 | +36 54 41.8 | +36 54 17.2 | 70 | 83 | 49 | 46 | -54 | -57 | -30.8 | -25.9 | |||||
| 0741+19 | 07 41 55.34 | 07 41 57.06 | +19 55 45.8 | +19 55 33.3 | 66 | 78 | -36 | -35 | -27 | -27 | 31.2 | 47.8 | |||||
| 0957+37 | 09 57 57.18 | 09 57 55.63 | +37 56 02.4 | +37 55 52.8 | 87 | 75 | -23 | -23 | -60 | -59 | -23.6 | -31.2 | |||||
| 1120+20 | 11 20 03.38 | 11 20 05.26 | +20 46 53.2 | +20 46 54.9 | 96 | 101 | -37 | -41 | -2 | 0 | -7.6 | -40.6 | |||||
| 0858+09 | 08 58 57.80 | 08 58 54.73 | +09 36 59.1 | +09 37 23.7 | 65 | 63 | -111 | -107 | 6 | 6 | 23.5 | 32.7 | |||||
| 1527+49 | 15 27 52.04 | 15 27 50.57 | +49 08 54.2 | +49 09 47.4 | 70 | 65 | -60 | -63 | 50 | 53 | -89.7 | -90.2 | |||||
| 0734+28 | 07 34 50.75 | 07 34 49.23 | +28 17 39.7 | +28 18 15.8 | 62 | 75 | -27 | -29 | -28 | -29 | -2.3 | -36.7 | |||||
| 1318+47 | 13 18 15.49 | 13 18 15.00 | +47 30 29.4 | +47 31 33.7 | 47 | 47 | -104 | -103 | 33 | 35 | -60.1 | -71.6 | |||||
| 1508+06 | 15 08 44.07 | 15 08 43.72 | +06 46 25.9 | +06 46 35.5 | 110 | 108 | -42 | -44 | 0 | 0 | -80.4 | -51.3 | |||||
| ID | Spectral Type | EW | CaH2 | CaH3 | TiO5 | |||||||||||||||
|---|---|---|---|---|---|---|---|---|---|---|---|---|---|---|---|---|---|---|---|---|
| A | B | A | B | A | B | A | B | A | B | A | B | A | B | |||||||
| SLW J2000 | (mag) | (Å) | ||||||||||||||||||
| 1512+20 | 15.01 | 16.87 | 2.02 | 2.56 | M3 | M4 | -0.18 | 0.00 | 0.45 | 0.36 | 0.72 | 0.63 | 0.44 | 0.34 | ||||||
| 0831+36 | 16.13 | 16.51 | 2.12 | 2.36 | M3 | M4 | 2.36 | 7.93 | 0.42 | 0.38 | 0.69 | 0.62 | 0.43 | 0.37 | ||||||
| 0741+19 | 16.29 | 16.67 | 2.22 | 2.46 | M3 | M4 | 3.06 | 7.18 | 0.43 | 0.41 | 0.69 | 0.67 | 0.42 | 0.38 | ||||||
| 0957+37 | 17.28 | 17.34 | 2.45 | 2.57 | M3 | M4 | 4.11 | 7.16 | 0.39 | 0.39 | 0.65 | 0.64 | 0.38 | 0.34 | ||||||
| 1120+20 | 16.62 | 17.09 | 2.13 | 2.32 | M3 | M3 | 7.16 | 0.99 | 0.46 | 0.44 | 0.72 | 0.70 | 0.45 | 0.45 | ||||||
| 0858+09 | 15.58 | 15.76 | 2.12 | 2.20 | M3 | M3 | 5.12 | 2.57 | 0.42 | 0.42 | 0.65 | 0.67 | 0.39 | 0.43 | ||||||
| 1527+49 | 16.00 | 17.01 | 2.19 | 2.57 | M3 | M4 | 4.83 | 1.08 | 0.32 | 0.41 | 0.59 | 0.68 | 0.31 | 0.41 | ||||||
| 0734+28 | 14.40 | 14.78 | 1.65 | 1.90 | M2 | M2 | 4.64 | 0.00 | 0.46 | 0.53 | 0.69 | 0.76 | 0.49 | 0.55 | ||||||
| 1318+47 | 15.19 | 17.40 | 2.20 | 2.95 | M2 | M5 | 1.95 | 3.94 | 0.41 | 0.33 | 0.68 | 0.62 | 0.42 | 0.27 | ||||||
| 1508+06 | 15.66 | 17.04 | 1.78 | 2.23 | M2 | M2 | 3.53 | 0.64 | 0.42 | 0.49 | 0.67 | 0.75 | 0.43 | 0.52 | ||||||
Note. — The first 10 pairs are listed here; the full version of the table is available online.
3.1. Spectroscopic Binaries
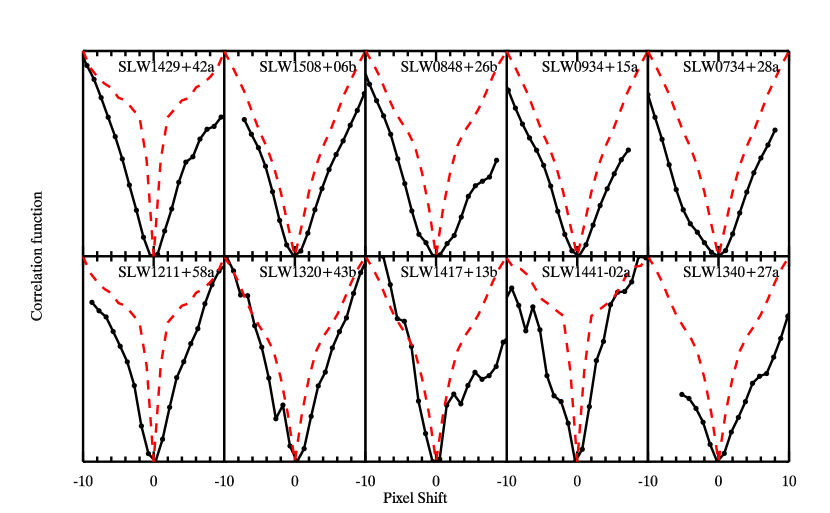
As discussed in Section 2, the radial velocities were measured by cross-correlating the program spectra with the appropriate SDSS template spectra (Bochanski et al., 2007b). The cross-correlation function (CCF) is used to determine the best match between the templates and program spectra. Presence of multiple turning points in the CCF as well as unusual broadening of the spectrum can indicate the presence of a spectroscopic binary (SB; Matijevič et al., 2010). While such a detection is unambiguous only in high-resolution spectra, we found possible evidence of SBs in our low-resolution spectra. Alternatively, the wide CCF could correspond to fast rotators, although our resolution of 35 km s-1 means they would have to be rotating at very high speeds. Figure 3 shows the CCF for the ten SB candidates (Table 4). All ten candidates have a relatively high S/N ratio, so the CCF is not a product of noisy spectral features. For comparison, the CCF for the radial velocity standards, which are presumably single stars, of the corresponding spectral types are shown in red, dashed lines. High-resolution spectra are required to confirm these SBs.
Previous studies have found that components of wide binaries are more likely to have a companion as compared to single field stars. This enhanced binarity has been ascribed to the ease of transfer of angular momentum that facilitates the formation of close pairs (Tokovinin, 1997; Bate et al., 2002; Burgasser et al., 2005; Connelley et al., 2009) and/or the stability of wide pairs in the field (Law et al., 2010). Among very low-mass wide binaries, the frequency of tight companions is (5011)% (Faherty et al., 2010). In a sample of nearby SLoWPoKES pairs, Law et al. (2010) found that the bias-corrected higher-order multiplicity was 45%. While only 10 of 113 pairs (8.8%) in this study have been identified as hierarchical, we were probing a different kind of hierarchical systems than those found by Law et al. 2010. Here we probed the extremely close pairs (spectroscopic binaries) whereas Law et al. 2010 probed systems with separations larger than 8–10 AU. In fact, our results are consistent with the Law et al. 2010 findings but limited to the extremely close pairs.
| Name | Spectral Type | Note |
|---|---|---|
| SLW 1211+58a | M0 | |
| SLW 1320+43b | M1 | wide CCF |
| SLW 1417+13b | M1 | wide CCF |
| SLW 1441-02a | K7 | |
| SLW 1340+27a | M1 | wide lines; wide CCF |
| SLW 1429+42a | M0 | double peak |
| SLW 1508+06b | M2 | wide CCF |
| SLW 0848+26b | M1 | wide CCF |
| SLW 0934+15a | M2 | line splitting; double peak |
| SLW 0734+28a | M | line splitting, wide CCF |
3.2. Fidelity of SLoWPoKES Pairs
The observed pairs were identified in Paper I based on a matching of their position, distance, and proper motions. The third velocity component, , can be used to test the fidelity of the observed pairs and, by extrapolation, of the SLoWPoKES catalog.
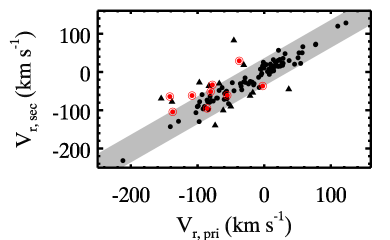
Figure 4 shows the radial velocities of the primary component against that of the secondary in the left panel and the distribution of their differences in the right panel. The identified candidate SBs are shown as concentric circles. Excluding the ten candidate SBs, 90 of the remaining 103 pairs (i.e., 87.4%) have within 3 of the mean; the 3 region is shown in gray in the left panel. Overall, the distribution is well-fit by a Gaussian with km s-1 and km s-1, shown as the dashed line though there are more outliers than expected (see below). As 1.4826 m.a.d for large normally distributed populations, ( 5.7 km s-1 11.95 km s-1) is in excellent agreement with the m.a.d. we measured for our radial velocity standards.
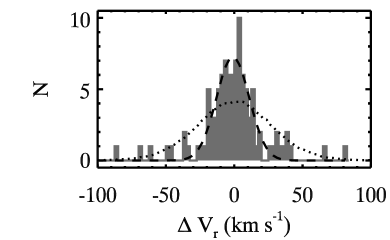
We checked that the distribution of our binaries is indeed distinct from physically unassociated stars. We used the Galactic model from Paper I that gives the expected 3-d velocity distribution for any position in the Galaxy or, if desired, a randomly chosen velocity from that distribution. We compared with a sample that has been selected in a similar manner to the pairs in our observed sample. Hence, at the Galactic positions of each of the observed pairs, we generated pairs of 3-d velocities until a pair with matching proper motions was found. The proper motion matching criteria was the same as that in Paper I. For statistical robustness, we conducted 106 realizations of this simulation; the normalized histogram of the resultant distribution is shown in dotted lines in the right panel of Figure 4. For a quantitative assessment of the difference between the simulated and observed distributions, we performed the Kolmogorov-Smirnov test (Press et al., 1992) and found a 0.93% probability that the two were drawn from the same parent population. We conclude the distribution of our observed binaries is much narrower than the scatter expected of two unassociated stars.
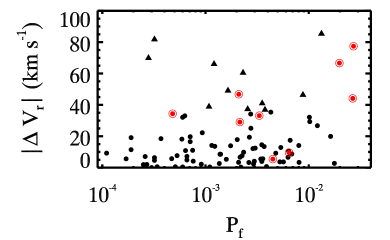
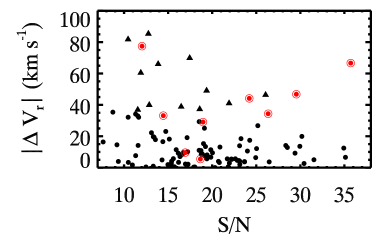
Thirteen (12.6%) of the pairs have that disagree at 3. The SLoWPoKES catalog only contains pairs with probability of chance alignment, Pf, less than 5%, meaning fewer than five of 103 pairs were expected to be false positives. In fact, Pf was tabulated for each pair in Paper I; the cumulative sum of chance alignments was only 0.3%, implying 1 pair was expected to be false positives. As shown in the left panel of Figure 5, there is no trend in as a function of the Pf. There are discrepant pairs at all values of Pf. However, as can be seen in the right panel of Figure 5, there is a significant trend of with the S/N in the spectra. The pairs with the largest values are at low S/N while there are no discrepant pairs at high S/N. This suggests that the cross-correlation process and the measurements of might have been adversely affected by the noise, yielding noisier radial velocities. In addition, given the large higher-order multiplicity fraction seen in SLoWPoKES (45%; Law et al., 2010), the presence of more SBs in our observed sample cannot be ruled out by our low-resolution spectra.
In summary, the vast majority of the sample pairs show agreement in their radial velocities, as expected for physical binaries. Pairs with discrepant s have spectra with low observed S/N or are (candidate) hierarchical systems with a spectroscopic binary.
3.3. Metallicity Index Calibration
Figure 6 shows the observed SLoWPoKES pairs, with the components of each pair connected with a solid line, in the CaH–TiO space with the dotted lines showing the iso- lines from LRS07 for 0.1–1.5 in steps of 0.1. The solid lines delineate the boundary between the dM/sdM/esdM/usdM classes ( 0.825, 0.500, and 0.200, respectively); the single-star spectral standards for the sdM (diamonds), esdM (triangles), and usdM (squares) classes are also shown (Lépine et al., 2007). For clarity, only pairs whose error bars, in both CaH and TiO5 of both pairs, are smaller than the median error are plotted. Most of the observed pairs are dMs, i.e., part of the thin disk with roughly solar metallicity. This is not surprising for a bright sample located within 200–300 pc of the Sun as the local neighborhood is largely dominated by thin disk stars (Bochanski et al., 2010).
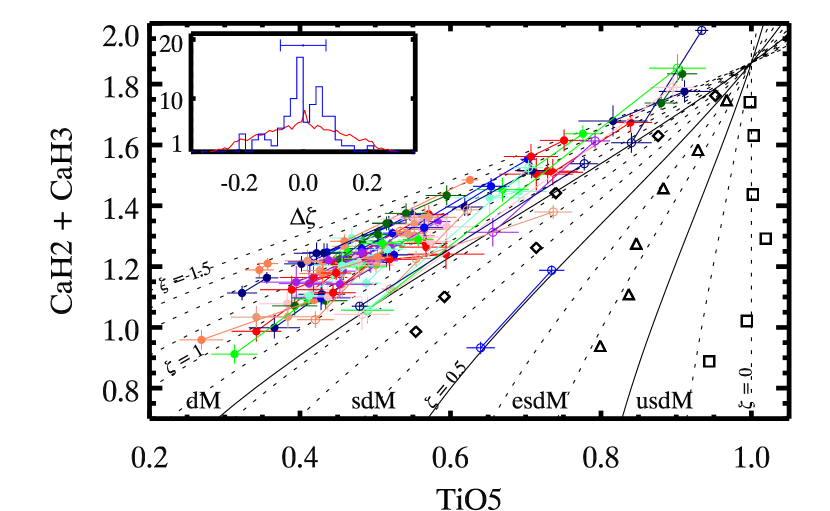
Most of the binary pairs lie parallel to the iso- lines, within the error bars. The inset in Figure 6 shows the distribution of , which is centered around zero but has substantial scatter. Quantitatively, the median and median absolute deviation (m.a.d.) are -0.005 and 0.066, respectively, indicating that for the vast majority of the observed pairs, is a correctly infers a common metallicity for the two stars in each pair.
To test whether the observed distribution was merely the intrinsic scatter in , we randomly selected 113 pairs of disk stars ( 0.825–1.100) in the similar brightness range as the SLoWPoKES sample () and with high proper motions ( mas yr-1) from the SDSS spectroscopic catalog (West et al., 2011) and calculated the distribution. There were 8030 stars in the DR7 spectroscopic sample that met these criteria; 113 pairs were randomly selected from this sample and their distribution calculated. We performed this simulation times; the resultant distribution is plotted in red in the inset of Figure 6. The simulated distribution is less centrally peaked, and much broader, compared to our observed distribution. The Kolmogorov-Smirnov test (Press et al., 1992) finds a probability of 3.3 that the two distributions were drawn from the same parent population. We conclude that the metallicity of components of SLoWPoKES binaries observed in this program are more similar to each other than that of two randomly paired thin disk stars. As components of a binary system are expected to have formed of the same material, this further serves to confirm the physical association of the pairs. Furthermore, it strengthens the argument that is a reliable proxy for relative metallicity.
However, Figure 6 also demonstrates some deficiencies in the definition of . First, is more than three m.a.d. away from zero for 18% of the pairs, versus the 5% expected for a normal distribution. They are discrepant especially at large values of TiO5 and CaH2CaH3, i.e., for higher-mass M dwarfs, perhaps suggesting a break in the relation. Large errors in this regime further complicate the issue, as the discrepant values could result from the difficulty of measuring the shallower TiO5, CaH2, and CaH3 band heads in late-K and early-M dwarfs. It is also evident how the iso- contours converge at the higher masses as pointed out out by LRS07. On the other hand, the discrepancy persists for the higher-mass pairs with smaller error bars, as can be clearly seen in Figure 6. Second, and perhaps more importantly, our measured values increase and become super-solar (i.e., ) for the higher mass stars. This is inconsistent with the expectation: given the apparent magnitude constraints ( 15–17), the higher mass stars in this sample can be expected to be farther away and, hence, at larger Galactic heights given most of the SDSS sight lines are at at high Galactic latitudes (Ivezić et al., 2008). Stars at high latitudes are, on average, older; and consequently, if anything, they might be expected to have lower metallicities (West et al., 2008). Yet, the -index yields the opposite. This result necessitates a redefinition of . With a spectroscopic sample of 113 visually resolved binaries, we are in an unique position to modify the definition of .
Given the lack of subdwarf pairs in our sample, any recalibration of would be systematically biased to high metallicity. Hence, we conducted a search for companions around the subdwarfs () in the SDSS DR7 spectroscopic catalog (West et al., 2011) with extant SDSS spectra. We have identified a sample of ten pairs with low values of ; and they are shown as open circles in Figure 6. The full sample that was identified in the search will be presented in a future paper (Dhital et. al., in prep.). One of the added pairs is at the sdM/esdM boundary while the other nine are at the dM/sdM boundary. While small this sample provides an invaluable constraint in the low-metallicity regime.
| Coefficients | LRS07 | This study |
|---|---|---|
| a0 | 0.050 | 0.047 |
| a1 | 0.118 | 0.127 |
| a2 | 0.670 | 0.694 |
| a3 | 0.164 | 0.183 |
| a4 | 0.005 |
LRS07 defined as:
| (1) |
where [TiO5] is a third-order polynomial of (CaH2+CaH3):
| (2) |
and where the coefficients, aN, are tabulated in Table 5 and were obtained as a single fit to the TiO5 index as a function of CaH2+CaH3 index for kinematically-selected sample of thin disk stars.
We can recalibrate by varying the functional form of [TiO5] in Eq. (2) such that the scatter in the distribution is minimized and distributed around zero. As noted earlier, the LRS07 definition, to first-order, is a robust measure of relative metallicity; and a recalibration need only be a perturbation about that definition. Moreover, as the definition was based on the distribution of (TiO5, CaH2+CaH3) of disk stars, it is a good starting point for the recalibration. So we only chose to explore the coefficient values within 0.03 of the Lépine et al. (2007) values in steps of 0.001. We have introduced a fourth-order term Eq. (2), with an initial guess of zero, based on the observed deviation of higher-mass pairs from the iso- lines. The best fit values for the coefficients were found by minimizing , where was assumed to be the model. All dM/sdM pairs, except for the ones with the large error bars, were considered for the fit.

Figure 7 shows the new iso- contours, with the coefficients tabulated in Table 5. The contours look significantly different despite small changes in the coefficients, reflecting the very sensitive dependence of on its independent variables. The differences can be summarized as:
-
(i)
The scatter in the is smaller, with the m.a.d. decreasing from 0.060 to 0.044. There are fewer outliers as well, with the values converging towards . As the median error in is bigger than the scatter in , decreasing the scatter further is not possible unless higher S/N data are obtained. The distribution is much more centrally peaked compared to randomly paired field stars.
-
(ii)
With only a few pairs at the higher-masses (large TiO5), yields more consistent values between components of the higher-mass dMs than in the original LRS07 definition. This congruence is important if we are to have the same metallicity proxy for all low-mass stars and is likely to improve as more pairs are added to that locus. It is especially reassuring to get the same value of for the components of pairs with large differences in mass, CaH2+CaH3, and TiO5; the previous definition such pairs were especially discrepant as the primary was assigned a artificially super-solar . With the new definition, the higher-mass dMs instead have slightly sub-solar , which is what is expected for stars at larger Galactic heights.
-
(iii)
The new iso- contours are less crowded at the higher-mass regime, allowing for a more robust determination of metallicity. In fact, the iso- do not converge before (TiO5, CaH2+CaH3) (1,2), hence, expanding the regime for sdMs/esdMs/usdMs. The metallicity classes also become more sensitive to TiO5 relative to CaH2+CaH3. However, with the new contours for , the previously defined standards for the metallicity classes are assessed to be more metal-poor and no longer are in the same class. While this argues for a definition of new standards, we advise against such a revision until there are more subdwarf binaries to more robustly calibrate the contours in that regime.
In general, the new definition of better fits the observed sample of visual binaries as well as resolving outstanding issues at the high-mass end. However, due to a paucity of subdwarf pairs, it leaves the low-metallicity regime rather unconstrained. looks to be a good proxy for metallicity, and future observations of subdwarf pairs should calibrate it for all low-mass stars. Studies that are using subdwarf binaries (Dhital et al., in prep.) and F/G–K/M binaries (Bochanski et al. in prep.; Lepine et al. in prep.) are already underway and are part of a larger effort to measure the absolute metallicity of low-mass stars.
3.4. H Activity
As M dwarf photospheres are too cold to excite electrons into the level, any observed H feature, either in absorption or in emission, is chromospheric in origin. The weakest chromospheres will exhibit no H; as the activity levels increase, H will be observed in absorption with the line filling in and eventually going into emission for the most active M dwarfs (Stauffer & Hartmann, 1986; Cram & Giampapa, 1987; Walkowicz & Hawley, 2009). As H is in absorption for both inactive and moderately active M dwarfs, H emission has traditionally been used as the tracer of chromospheric activity and is biased towards the most active M dwarfs (e.g., West et al., 2011).
In our sample, 11 of the 113 pairs showed clear evidence of H emission in both components while three pairs had only one component with H in emission. In addition, 33 pairs showed H absorption in both components and 22 pairs in one component; the remaining 47 were classified as inactive. The large fraction (39%) of stars with H absorption is in accordance with the nearby M dwarfs in the Palomar/MSU Nearby Star Survey Spectroscopic Survey (Gizis et al., 2002). Overall, for 91 of the 113 (81%) pairs in our sample, both components of a pair showed similar levels of activity—in emission, absorption, or the lack or activity. For the pairs with both components having H emission, we converted the equivalent width in H to —the ratio of H luminosity to the bolometric luminosity that is independent of spectral type—following Walkowicz et al. (2004) and West et al. (2004); all pairs had comparable levels of within the error bars except for the two where the active primary was identified as a candidate SB and had an inactive secondary. The tidal forces due to the tight companion has presumably enhanced the activity of the primary (Shkolnik et al., 2010; Silvestri et al., 2006).
As H activity depends strongly on mass (West et al., 2008), one way to compare the intrinsic variability in activity levels is by only looking at pairs with components of similar masses. All sixteen pairs with H in emission or absorption in both components and with similar colors (() 0.2) had H equivalent widths within 130% of each other. Compared to the 200–300% difference in H activity exhibited by M dwarfs over time (Bell et al., 2011), the components of the similar-mass binary pairs in our sample exhibit a much smaller difference in H activity. This is consistent with the expectation that stars of similar ages and masses have comparable activity levels, presumably because they experience similar spin-down rates.
4. Conclusions
We have carried out a spectroscopic follow-up study of 113 ultra-wide, low-mass CPM binary systems from the SLoWPoKES catalog (Paper I) using the GOLDCAM spectrograph on the KPNO 2.1 m telescope. We measured the radial velocities of each component by cross-correlating them with appropriate standards and used them to assess the fidelity of pairs in the SLoWPoKES catalog. 95 of the 113 (84%) of the pairs have the same radial velocity within 3 . At least five of the pairs with discrepant radial velocities are candidate SBs, which would explain the difference. There may be additional spectroscopic companions undetected in our low-resolution spectra. Law et al. (2010) found that 45% of the SLoWPoKES systems are either hierarchical triples or quadruples. Either high-resolution spectroscopy or imaging would be needed to identify the close companions and to further quantify the incidence of higher-order systems in wide binaries.
We examined the H activity in our observed sample. The components of binary pairs exhibited overwhelmingly comparable levels of H activity. Moreover, the H of the pairs with similar colors and two active components, while large, was several times smaller than the variation seen in single M dwarfs. Our results corroborate that low-mass stars of the same mass should spin-down at the similar rates over time. However, larger samples of active are needed to confirm this finding and to constrain the rate of this spin-down.
We tested the LRS07 -index and found that, to first-order, it is a robust measure of relative metallicity. The value of for the two components in each binary system match within the error bars for most pairs, indicating a common metallicity as expected. However, we find a systematic bias for the higher-mass M dwarfs such that overestimates the metallicity. Assuming all of the pairs are physically associated systems and have the same metallicity, we have redefined . While the shift is small, it better represents iso-metallicity lines in the high-metallicity regime and represents an incremental step towards defining an absolute metallicity scale for low-mass dwarfs. Planned further observations should extend the calibration of as well as map it to an absolute metallicity scale in the near future.
References
- Abazajian et al. (2009) Abazajian, K. N., et al. 2009, ApJS, 182, 543
- Barnes (2003) Barnes, S. A. 2003, ApJ, 586, 464
- Barnes (2007) ——. 2007, ApJ, 669, 1167
- Bate et al. (2002) Bate, M. R., Bonnell, I. A., & Bromm, V. 2002, MNRAS, 336, 705
- Bell et al. (2011) Bell, K. J., Hilton, E. J., Davenport, J. R. A., Hawley, S. L., West, A. A., & Rogel, A. B. 2011, ArXiv e-prints
- Bessell (1982) Bessell, M. S. 1982, Proceedings of the Astronomical Society of Australia, 4, 417
- Bochanski et al. (2010) Bochanski, J. J., Hawley, S. L., Covey, K. R., West, A. A., Reid, I. N., Golimowski, D. A., & Ivezić, Ž. 2010, AJ, 139, 2679
- Bochanski et al. (2007a) Bochanski, J. J., Munn, J. A., Hawley, S. L., West, A. A., Covey, K. R., & Schneider, D. P. 2007a, AJ, 134, 2418
- Bochanski et al. (2007b) Bochanski, J. J., West, A. A., Hawley, S. L., & Covey, K. R. 2007b, AJ, 133, 531
- Bonfils et al. (2005) Bonfils, X., Delfosse, X., Udry, S., Santos, N. C., Forveille, T., & Ségransan, D. 2005, A&A, 442, 635
- Burgasser & Kirkpatrick (2006) Burgasser, A. J., & Kirkpatrick, J. D. 2006, ApJ, 645, 1485
- Burgasser et al. (2005) Burgasser, A. J., Kirkpatrick, J. D., & Lowrance, P. J. 2005, AJ, 129, 2849
- Connelley et al. (2009) Connelley, M. S., Reipurth, B., & Tokunaga, A. T. 2009, AJ, 138, 1193
- Covey et al. (2008) Covey, K. R., et al. 2008, AJ, 136, 1778
- Covey et al. (2007) ——. 2007, AJ, 134, 2398
- Cram & Giampapa (1987) Cram, L. E., & Giampapa, M. S. 1987, ApJ, 323, 316
- Delfosse et al. (1998) Delfosse, X., Forveille, T., Perrier, C., & Mayor, M. 1998, A&A, 331, 581
- Delorme et al. (2010) Delorme, P., Collier Cameron, A., Hebb, L., Rostron, J., Lister, T. A., Norton, A. J., Pollacco, D., & West, R. G. 2010, in SF2A-2010: Proceedings of the Annual meeting of the French Society of Astronomy and Astrophysics, ed. S. Boissier, M. Heydari-Malayeri, R. Samadi, & D. Valls-Gabaud , 243
- Dhital et al. (2010) Dhital, S., West, A. A., Stassun, K. G., & Bochanski, J. J. 2010, AJ, 139, 2566
- Faherty et al. (2010) Faherty, J. K., Burgasser, A. J., West, A. A., Bochanski, J. J., Cruz, K. L., Shara, M. M., & Walter, F. M. 2010, AJ, 139, 176
- Fuchs et al. (2009) Fuchs, B., et al. 2009, AJ, 137, 4149
- Gizis (1997) Gizis, J. E. 1997, AJ, 113, 806
- Gizis et al. (2002) Gizis, J. E., Reid, I. N., & Hawley, S. L. 2002, AJ, 123, 3356
- Hauschildt et al. (1999) Hauschildt, P. H., Allard, F., & Baron, E. 1999, ApJ, 512, 377
- Hilton et al. (2010) Hilton, E. J., West, A. A., Hawley, S. L., & Kowalski, A. F. 2010, AJ, 140, 1402
- Ivezić et al. (2008) Ivezić, Ž., et al. 2008, ApJ, 684, 287
- Johnson & Apps (2009) Johnson, J. A., & Apps, K. 2009, ApJ, 699, 933
- Jurić et al. (2008) Jurić, M., et al. 2008, ApJ, 673, 864
- Kirkpatrick et al. (1991) Kirkpatrick, J. D., Henry, T. J., & McCarthy, Jr., D. W. 1991, ApJS, 77, 417
- Kowalski et al. (2009) Kowalski, A. F., Hawley, S. L., Hilton, E. J., Becker, A. C., West, A. A., Bochanski, J. J., & Sesar, B. 2009, AJ, 138, 633
- Kraus & Hillenbrand (2007) Kraus, A. L., & Hillenbrand, L. A. 2007, AJ, 134, 2340
- Kruse et al. (2010) Kruse, E. A., Berger, E., Knapp, G. R., Laskar, T., Gunn, J. E., Loomis, C. P., Lupton, R. H., & Schlegel, D. J. 2010, ApJ, 722, 1352
- Law et al. (2010) Law, N. M., Dhital, S., Kraus, A., Stassun, K. G., & West, A. A. 2010, ApJ, 720, 1727
- Laws et al. (2003) Laws, C., Gonzalez, G., Walker, K. M., Tyagi, S., Dodsworth, J., Snider, K., & Suntzeff, N. B. 2003, AJ, 125, 2664
- Lépine et al. (2003) Lépine, S., Rich, R. M., & Shara, M. M. 2003, AJ, 125, 1598
- Lépine et al. (2007) ——. 2007, ApJ, 669, 1235
- López-Morales (2007) López-Morales, M. 2007, ApJ, 660, 732
- Massey et al. (1992) Massey, P., Valdes, F., & Barnes, J. 1992
- Matijevič et al. (2010) Matijevič, G., et al. 2010, AJ, 140, 184
- Mohanty & Basri (2003) Mohanty, S., & Basri, G. 2003, ApJ, 583, 451
- Press et al. (1992) Press, W. H., Teukolsky, S. A., Vetterling, W. T., & Flannery, B. P. 1992, Numerical Recipes in FORTRAN. The Art of Scientific Computing, 2nd edn. (Cambridge: Cambridge Univ. Press)
- Reid et al. (1995) Reid, I. N., Hawley, S. L., & Gizis, J. E. 1995, AJ, 110, 1838
- Rojas-Ayala et al. (2010) Rojas-Ayala, B., Covey, K. R., Muirhead, P. S., & Lloyd, J. P. 2010, ApJ, 720, L113
- Schlaufman & Laughlin (2010) Schlaufman, K. C., & Laughlin, G. 2010, A&A, 519, A105+
- Shkolnik et al. (2010) Shkolnik, E. L., Hebb, L., Liu, M. C., Reid, I. N., & Cameron, A. C. 2010, ApJ, 716, 1522
- Silvestri et al. (2006) Silvestri, N. M., et al. 2006, AJ, 131, 1674
- Skrutskie et al. (2006) Skrutskie, M. F., et al. 2006, AJ, 131, 1163
- Skumanich (1972) Skumanich, A. 1972, ApJ, 171, 565
- Stauffer & Hartmann (1986) Stauffer, J. R., & Hartmann, L. W. 1986, ApJS, 61, 531
- Tokovinin (1997) Tokovinin, A. A. 1997, Astronomy Letters, 23, 727
- Valenti & Fischer (2008) Valenti, J. A., & Fischer, D. A. 2008, Physica Scripta Volume T, 130, 014003
- Walkowicz & Hawley (2009) Walkowicz, L. M., & Hawley, S. L. 2009, AJ, 137, 3297
- Walkowicz et al. (2004) Walkowicz, L. M., Hawley, S. L., & West, A. A. 2004, PASP, 116, 1105
- West & Basri (2009) West, A. A., & Basri, G. 2009, ApJ, 693, 1283
- West et al. (2006) West, A. A., Bochanski, J. J., Hawley, S. L., Cruz, K. L., Covey, K. R., Silvestri, N. M., Reid, I. N., & Liebert, J. 2006, AJ, 132, 2507
- West et al. (2008) West, A. A., Hawley, S. L., Bochanski, J. J., Covey, K. R., Reid, I. N., Dhital, S., Hilton, E. J., & Masuda, M. 2008, AJ, 135, 785
- West et al. (2004) West, A. A., et al. 2004, AJ, 128, 426
- West et al. (2011) ——. 2011, AJ, 141, 97
- Witte et al. (2011) Witte, S., Helling, C., Barman, T., Heidrich, N., & Hauschildt, P. H. 2011, A&A, 529, A44+
- Woolf et al. (2009) Woolf, V. M., Lépine, S., & Wallerstein, G. 2009, PASP, 121, 117
- York et al. (2000) York, D. G., et al. 2000, AJ, 120, 1579