Effect of glycerol and dimethyl sulfoxide on the phase behavior of lysozyme: Theory and experiments
Abstract
Salt, glycerol and dimethyl sulfoxide (DMSO) are used to modify the properties of protein solutions. We experimentally determined the effect of these additives on the phase behavior of lysozyme solutions. Upon the addition of glycerol and DMSO, the fluid-solid transition and the gas-liquid coexistence curve (binodal) shift to lower temperatures and the gap between them increases. The experimentally observed trends are consistent with our theoretical predictions based on the thermodynamic perturbation theory (TPT) and the Derjaguin-Landau-Verwey-Overbeek (DLVO) model for the lysozyme-lysozyme pair interactions. The values of the parameters describing the interactions, namely the refractive indices, dielectric constants, Hamaker constant and cut-off length, are extracted from literature or are experimentally determined by independent experiments, including static light scattering, to determine the second virial coefficient. We observe that both, glycerol and DMSO, render the potential more repulsive, while sodium chloride reduces the repulsion.
pacs:
87.15.N- Properties of solutions of macromolecules, 87.14.E- Proteins, 82.70.Dd ColloidsI Introduction
Proteins are complex macromolecules which play a crucial role, e.g. as enzymes or structural units, in various processes in living organisms, but also in biotechnology. Many of these natural or industrial processes require further ingredients and additives such as salts or solvents. In biotechnology, these substances are often added to modify the protein interactions and phase behavior, for example to favor crystallization McPherson (1999). There is a great variety of additives; they include ions, such as sodium chloride (NaCl), to regulate the electrostatic repulsion or potential, and liquids, such as glycerol or DMSO, to, e.g., stabilize proteins against denaturation Sousa (1995), protect proteins against freezing Arakawa et al. (2007); Kamiyama et al. (2009) or inhibit protein aggregation McPherson (1990). A thorough understanding of the resulting changes in the interactions and phase behavior is beneficial for the design and control of these processes. For example, experience has shown that high quality crystals are often formed in slightly supersaturated solutions McPherson (1999), while protein crystals with many defects or amorphous protein precipitates (aggregates) are frequently obtained if the sample is quenched deep into the crystal phase, in particular close to the metastable gas-liquid coexistence curve where rapid nucleation occurs ten Wolde and Frenkel (1997); Sedgwick et al. (2005). Thus, understanding the phase behavior can guide the design of processes involving proteins.
Despite the huge complexity of proteins, even of globular proteins such as lysozyme considered here, we will use a very simple spherically symmetric model. Although this will not do full justice to the details of the protein structure and the individual properties of a specific protein, it will allow us to apply concepts developed in soft matter physics to protein solutions. It will also shed light on general properties of proteins which can successfully be described by a coarse-grained model. On the other hand, the model will fail to describe certain aspects and thus indicate what defines the specific properties of a certain protein. To describe the protein-protein interactions, we use the Derjaguin-Landau-Verwey-Overbeek (DLVO) potential, a well-established model potential in colloid physics Israelachvili (1991); Pusey (1991). Based on this interaction model and thermodynamic perturbation theory (TPT) Barker and Henderson (1976), we will calculate the phase behavior of lysozyme in aqueous solution with additives, namely added salt (NaCl), glycerol and dimethyl sulfoxide (DMSO), and compare our theoretical predictions to our experimental observations. For the additive concentrations studied here, lysozyme does not unfold or undergo conformational changes Knubovets et al. (1999); Vagenende et al. (2009); Voets et al. (2010). This allows us to test the validity and limits of the simple model, to investigate the effects of these additives on the interactions and the phase behavior, and to understand at least qualitatively the trends observed in our experiments.
In several previous studies, the properties of lysozyme solutions, namely the protein-protein interactions and the phase behavior, were described using the DLVO potential. Poon et al. Poon et al. (2000) studied the fluid-solid transition, i.e. the crystallization or solubility boundary, as a function of salt and protein concentration as well as the pH of the solution and thus the protein charge. They found a universal crystallization boundary if the salt concentration is normalized by the square of the protein charge and supported this finding by the behavior of the second virial coefficient calculated using the DLVO potential. A more detailed analysis was later provided by Warren Warren (2002). Similarly, computer simulations by Pellicane et al. Pellicane et al. (2003) based on the DLVO model showed that the shape of the gas-liquid coexistence curve can successfully be predicted, with the critical temperature strongly depending on the Hamaker constant. By contrast, Broide et al. Broide et al. (1996) report that the DLVO model cannot fully explain their experimentally-observed phase behavior; the predicted height of the Coulomb barrier is too low to inhibit protein aggregation. This suggests that hydration forces are important to prevent lysozyme from aggregating.
Despite the widespread use of additives such as glycerol and DMSO, for example in crystallization essays, only a few studies were concerned with their effect on the phase behavior of proteins. Farnum and Zukoski Farnum and Zukoski (1999) studied the effect of glycerol on the protein interactions in aqueous solutions of bovine pancreatic trypsin inhibitor (BPTI). Upon increasing the glycerol concentration, the repulsive interaction increases. A description of these data based on the DLVO model requires a Hamaker constant which is much smaller than expected from the optical properties of water-glycerol mixtures and of proteins. They thus attributed their observations to a small increase of the effective protein size which is caused by an enhanced hydration shell (and modeled by an increased cut-off length , see Sec. III.1.2). This is supported by observations of Priev et al. Priev et al. (1996). Their experiments indicate an increase of the hydration shell upon addition of glycerol and, at the same time, a decrease of the core volume of BPTI. Similarly, using small-angle neutron scattering Sinibaldi et al. Sinibaldi et al. (2007) observed, upon increasing the glycerol content, a significant increase of the hydration shell of lysozyme from to , and a small decrease of the core volume of lysozyme of about , such that the total effective protein volume increases by at least about Merzel and Smith (2002); Sinibaldi et al. (2007). In the presence of glycerol, Esposito et al. Esposito et al. (2009) furthermore observed an increase of the hydrodynamic radius with increasing temperature. Using computer simulations, Vagenende et al. Vagenende et al. (2009) found that glycerol preferentially interacts with the hydrophobic patches on the lysozyme surface. Glycerol molecules shield these patches with their hydrocarbon backbone, allowing the lysozyme hydration shell to grow. Moreover, Sedgwick et al. Sedgwick et al. (2007) studied the effect of up to glycerol on the phase behavior of lysozyme. They found that, based on the DLVO model, the phase behavior can be described almost quantitatively if the glycerol-induced changes in the dielectric constant and index of refraction are taken into account. The effect of glycerol and DMSO on the fluid-solid boundary of lysozyme solutions has also been studied by Lu et al. Lu et al. (2003). Both additives increase the lysozyme solubility. Furthermore, consistent with the previously-mentioned study Sedgwick et al. (2007), Lu et al. Lu et al. (2003) found that glycerol and DMSO decrease the protein critical supersaturation, thereby promoting nucleation. In subsequent work, Gosavi et al. Gosavi et al. (2011) studied the formation of lysozyme crystals showing that the crystal growth rate is enhanced upon addition of glycerol. Similar observations were made by Kulkarni and Zukoski Kulkarni and Zukoski (2002). Furthermore, Arakawa et al. Arakawa et al. (2007) and Kamiyama et al. Kamiyama et al. (2009) observed a preferential hydration of lysozyme in water-DMSO mixtures, indicating that DMSO does not bind to the lysozyme surface Kamiyama et al. (2009). This suggests that DMSO mainly affects the dielectric properties of the bulk solution. Nevertheless, DMSO leads to denaturation at volume fractions beyond Voets et al. (2010). It is hence still not clear whether the addition of glycerol and DMSO only changes the solvent dielectric constant and refractive index or whether it also has a significant effect on the protein, in particular on its hydration.
Combining theory and experiment, we investigate the phase behavior of aqueous lysozyme solutions with additives. The samples contain or NaCl, up to glycerol and up to DMSO. By optical inspection, we experimentally determine both the fluid-solid transition and the metastable gas-liquid coexistence curves (binodals). Of particular interest is their relative location in dependence on the amount of added glycerol and DMSO, since protein crystallization is expected to be enhanced in the vicinity of the gas-liquid critical point ten Wolde and Frenkel (1997). As we will show, the experimentally-determined phase diagram of lysozyme is qualitatively consistent with our theoretical predictions. They are based on the DLVO model and thermodynamic perturbation theory (TPT) Barker and Henderson (1976), and are preformed without any free parameters. The values of the parameters describing the DLVO model are either taken from the existing literature or determined by independent measurements, namely refractometry to measure the refractive indices and static light scattering (SLS) to determine the second virial coefficient. These independent measurements also provide detailed information on the effect of the additives on the protein interactions.
The organization of this paper is as follows. In Section II, we describe the experimental procedures. Section III.1 introduces the DLVO model for the protein-protein interactions and presents the values of its parameters. Based on this model and without additional free parameters, in Section III.2 the phase behavior is calculated using thermodynamic perturbation theory. Then the predicted phase behavior is compared to our experimental observations. Finally, our findings are summarized in Section IV.
II Materials and Experimental Methods
II.1 Materials and Sample Preparation
We used three-times crystallized, dialyzed and lyophilized hen egg-white lysozyme powder (Sigma Aldrich L6876). An aqueous sodium acetate buffer was prepared and adjusted with hydrochloric acid to . The protein powder was dissolved in this buffer to result in a concentration of about . This suspension was several times passed through a filter with pore size (Acrodisc syringe filter, low protein binding, Pall 4611) to remove impurities and undissolved protein. This solution subsequently was concentrated by a factor of six using an Amicon stirred ultra-filtration cell (Amicon, Millipore, 5121) with an Omega 10k membrane disc, Pall OM010025. The concentrated solution was used as protein stock solution. Its protein concentration was determined in a quartz cell with a path length of by UV absorption spectroscopy at a wavelength of using a specific absorption coefficient of .
Samples were prepared by mixing appropriate amounts of protein stock solution, buffer, salt solution ( NaCl with buffer), glycerol solution ( glycerol with buffer), and DMSO. Mixing was performed at a temperature above the metastable gas-liquid coexistence to prevent phase separation. The glycerol samples contained and NaCl, the DMSO samples NaCl, and all samples contained buffer and various concentrations of lysozyme.
In order to obtain protein concentrations above that of the stock solution, we exploited the gas-liquid phase separation. A solution was quenched into the metastable gas-liquid coexistence region, centrifuged for 10 min at a temperature below the cloud point temperature, and the protein-rich phase was collected. The resulting protein concentration of the protein-rich phase was calculated from the volume ratio of the two coexisting phases, the initial protein concentration and the protein concentration of the protein-poor phase, which was determined via its refractive index.
II.2 Determination of the Phase Boundaries
The gas-liquid coexistence curves (binodals) were determined by cloud point measurements. The sample was filled into a NMR tube with diameter, sealed, and placed into a water bath at a temperature above the demixing point. The temperature subsequently was lowered stepwise and the cloud point temperature identified by the sample becoming turbid. This measurement was repeated for samples with different lysozyme volume fractions to determine the location of the binodals.
To determine the crystallization boundary, the sample was filled into an x-ray capillary tube and sealed with UV curing glue (Norland). The capillary was then mounted onto a home-built temperature stage that allows for observation by optical microscopy (Nikon Eclipse 80i). For samples with a low protein concentration, it was necessary to lower the temperature to to induce crystallization. Once crystals were formed, the temperature was raised stepwise. The temperature at which the crystals begin to melt was identified with the transition temperature. Again, the experiments were repeated with different lysozyme volume fractions to obtain the fluid-solid coexistence curves.
II.3 Determination of the Refractive Indices
We used a temperature-controlled Abbe refractometer (Model 60L/R, Bellingham & Stanley) operated at a wavelength of to determine the refractive indices of the samples, that is of the protein solutions, , and of the solvent, . The refractive index increments, , were obtained from linear fits to the dependence of on the mass protein concentration, .
II.4 Determination of the Second Virial Coefficient
Static light scattering (SLS) was performed with a 3D light scattering instrument (LS-Instruments). Due to the low scattering intensity of the samples, the instrument was operated with a single beam with wavelength . The samples were filled into cylindrical glass cuvettes with a diameter of , centrifuged for at least 10 min at typically prior to the measurements, and placed into the temperature-controlled vat of the instrument which was filled with decalin. The samples used for the SLS measurements were dilute with lysozyme concentrations between mg/ml and mg/ml.
We did not observe a dependence of the scattered intensity, , on the scattering angle, , consistent with the small protein diameter Muschol and Rosenberger (1995); Kuehner et al. (1997) compared to the inverse of the scattering vector so that Kerker (1969). Therefore, the time-averaged intensity scattered by the protein solution, , was detected at a single scattering angle, , corresponding to a magnitude of the scattering vector . The excess scattering due to the protein is expressed as the Rayleigh ratio,
| (1) |
which relates the difference in the average scattering intensities of the protein solution and the solvent, , to the scattered intensity of the toluene reference, , with known Rayleight ratio, . The ratio of the refractive indices of the protein solution, , and toluene, , accounts for the different sizes of the scattering volumes in the two cases. The temperature dependence of was experimentally determined from the temperature dependence of the intensity scattered by a toluene sample. The absolute value at C was taken from literature Narayanan and Liu (2003) and is consistent with other reports (see Itakura et al. (2006) and references therein).
For dilute solutions, is related to the second virial coefficient, , by
| (2) |
where and both represent the molar mass , but by two different values (see below), is Avogadro’s constant and an optical constant given by
| (3) |
Note that the refractive indices and the refractive index increments in the above equations depend on temperature.
SLS measurements of a series of protein concentrations hence allow to determine from the slope of the dependence, and the molar mass from the intercept at . The measurements were performed at different temperatures to obtain the temperature dependence of , while is expected to be temperature independent. The values of the molar mass, experimentally determined at different temperatures from the intercept at , lie in the range g/mol g/mol, while the expected value is Voet and Voet (1990). The error in is mainly due to the low scattered intensity, uncertainties in and . Dynamic light scattering experiments on the same dilute samples did not indicate the presence of aggregates, which are also neither expected for aqueous solutions Stradner et al. (2004); Sedgwick et al. (2005) nor for glycerol-water Vagenende et al. (2009) or DMSO-water mixtures Voets et al. (2010). To avoid that experimental errors in the molar mass affect , we used the literature value in the term for the slope, , i.e. , when calculating based on Eq. (2) com . This renders independent of the absolute scattered intensity, i.e. , which has a significant uncertainty, and thus makes more reliable.
III Results and Discussion
We first present the simple model used to quantify the protein-protein interactions, namely the DLVO potential model (Sec. III.1.1), as well as the values of its parameters. These are either taken from the literature, or determined by independent measurements (Sec. III.1.2). Based on this interaction potential and these parameter values, we calculate the phase diagram without any free parameter (Sec. III.2.1). Our experimentally determined phase diagrams (Sec. III.2.2) are then compared to the theoretical predictions (Sec. III.2.3).
III.1 Protein-Protein Interaction Potential
III.1.1 DLVO Model
The DLVO pair potential, , includes three parts; hard-sphere , repulsive electrostatic and attractive van der Waals interactions ,
| (4) |
where is the center-to-center distance of two spherical particles.
The hard-sphere contribution is
| (5) |
The electrostatic repulsion is described by a screened Coulomb potential
| (6) |
where with the Boltzmann constant, the diameter, the charge and the solvent-specific Bjerrum length depending on the elementary charge, , dielectric constant in vacuo, , and dielectric constant of the solvent, . The square of the electrostatic (Debye) screening parameter, , is given by
| (7) |
where is the particle volume fraction with the mass density, the molar salt concentration and the molar concentration of dissociated buffer. The factor corrects for the volume occupied by proteins and thus takes into account the free volume accessible to the micro-ions, which cannot penetrate the protein Russel and Benzing (1981); Denton (2000). We ignore here the small free volume corrections arising from the finite size of the microions.
The van der Waals attraction is of the form Israelachvili (1991)
| (8) |
where is the (effective) Hamaker constant and a cut-off length. The cut-off length represents the smallest possible surface-to-surface separation of two proteins, introduced to avoid the unphysical divergence at . Its value can be estimated by the thickness of the Stern layer, i.e., by the mean size of the salt ions.
The Hamaker constant can be approximated by Israelachvili (1991)
| (9) |
where is the zero-frequency and the frequency-dependent part, the Planck constant, and the static dielectric constants of the solvent and protein, and their refractive indices, and the characteristic UV electronic adsorption frequency Israelachvili (1991).
III.1.2 Values of the Model Parameters
To quantitatively determine the potential , we require the values of the refractive indices and static dielectric constants, of the cut-off length , and of the parameters describing the protein. Lysozyme is an approximately spherical protein with an effective diameter Muschol and Rosenberger (1995); Kuehner et al. (1997), molar mass , mass density Voet and Voet (1990) and net positive elementary charges at the present Tanford and Roxby (1972). The acidity constant of sodium acetate is resulting in a dissociated buffer concentration of at .
Refractive indices and static dielectric constants.
The protein index of refraction is obtained by the linear extrapolation, , where is the molar concentration of a ‘bulk’ protein. We find no significant dependence of on composition or temperature in the relevant parameter range, consistent with previous findings Yin et al. (2003). Averaging over all tested temperatures and compositions yields .
It is usually assumed that dry protein has a static dielectric constant in the range of Dwyer et al. (2000); Sedgwick et al. (2007). However, measurements with protein powders often indicate larger values, for example for wet lysozyme powder Harvey and Hoekstra (1972), for hydrated lysozyme crystals Rashkovich et al. (2008) and, based on MD simulations, for lysozyme in aqueous solution Pitera et al. (2001). The larger values are attributed to water or moisture leading to hydration and some water penetration Dwyer et al. (2000). For consistency with previous work Dwyer et al. (2000); Sedgwick et al. (2007), we use a static dielectric constant of lysozyme given by . We might underestimate in this way and thus overestimate the static contribution to the Hamaker constant (Eq. 9) and hence the protein attraction. However, the effects are not significant, because, as will be shown below, the main contribution to the Hamaker constant is due to the non-zero frequency term .
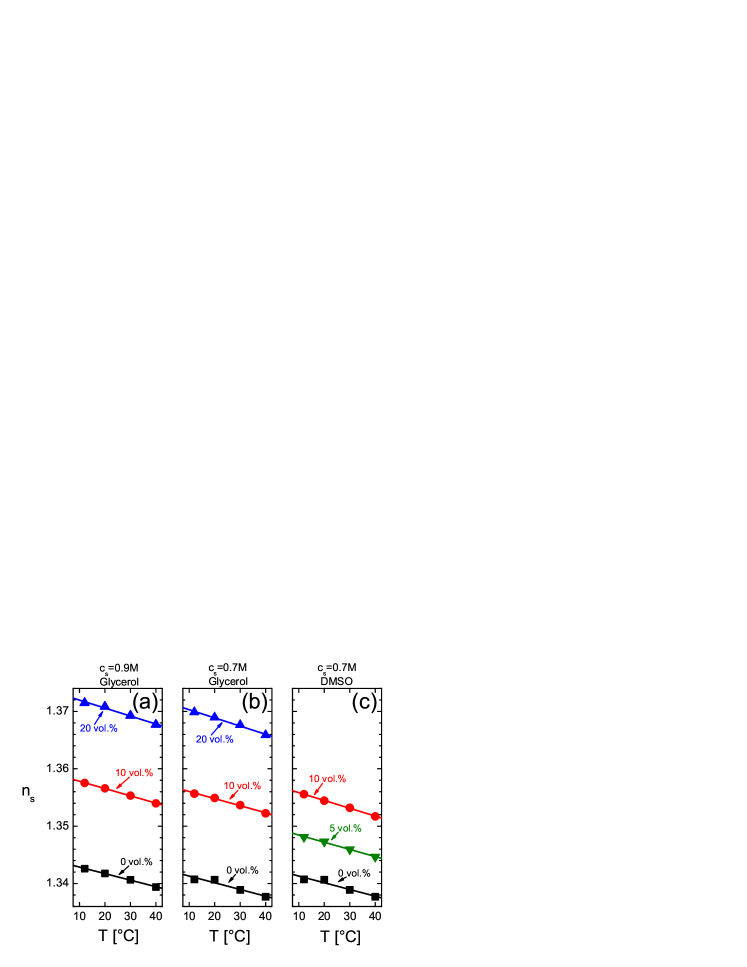
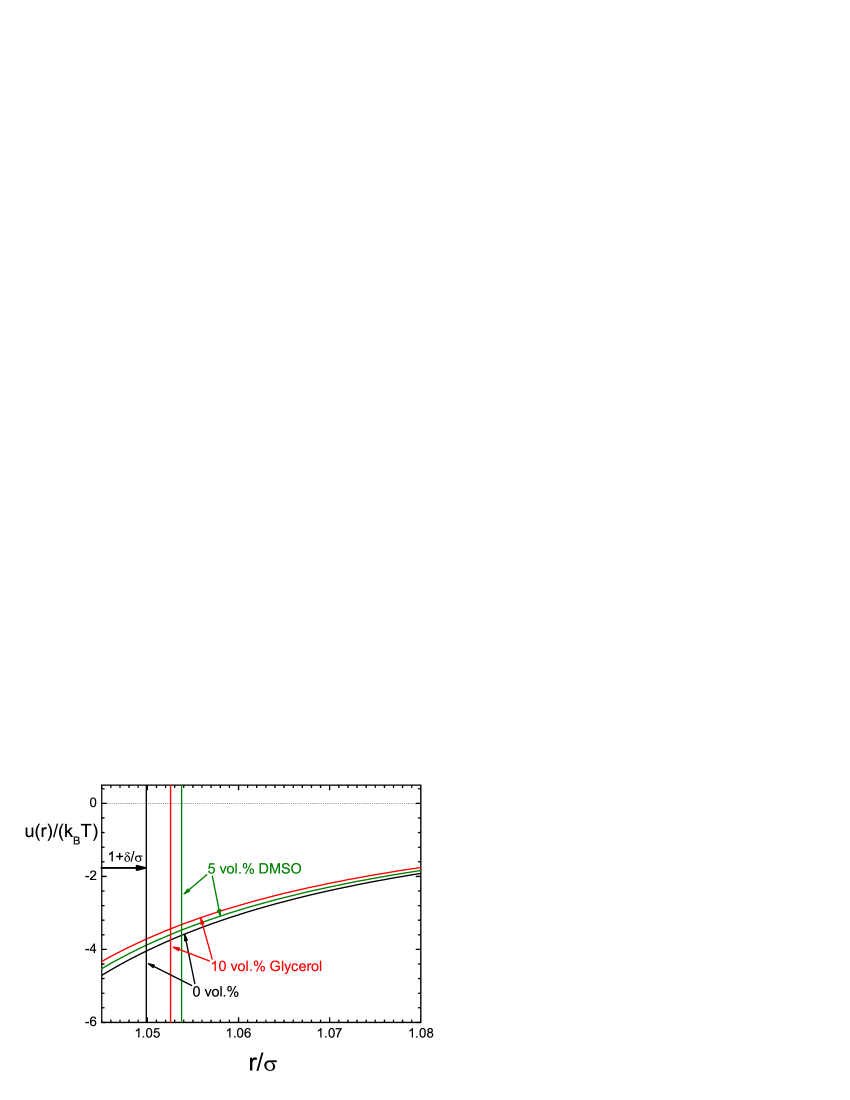
The refractive index of the solvent, , was measured and found to decrease with increasing temperature (Fig. 1). The refractive indices of glycerol, , and DMSO, , are larger than the one of water, . For example, , and at . The addition of glycerol or DMSO thus increases .
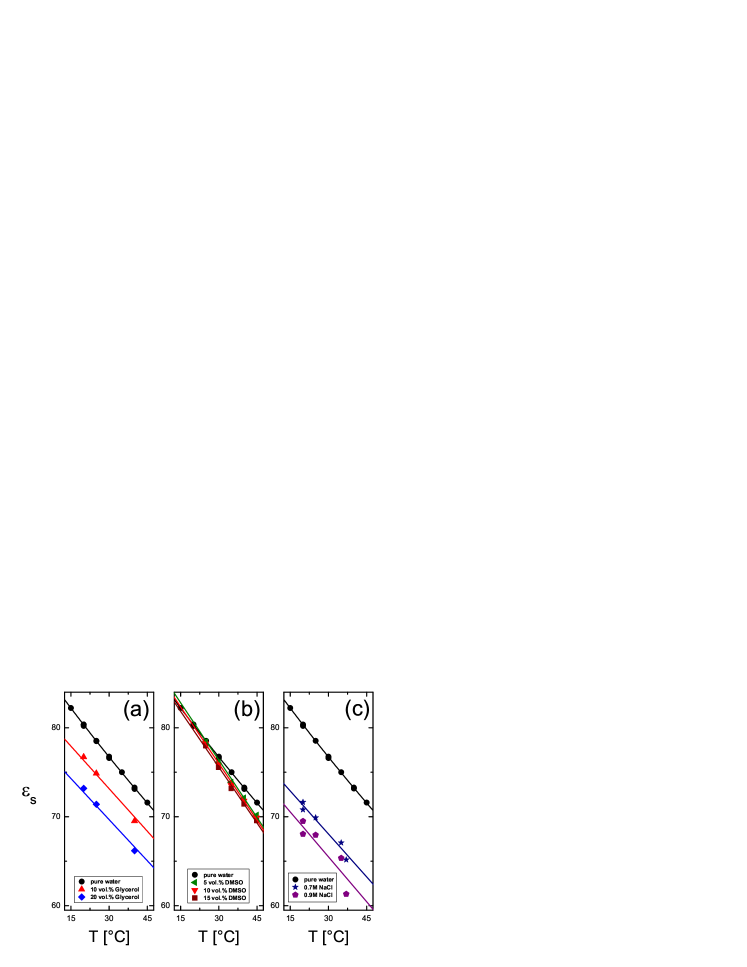
The dielectric constant of the solvent, , was taken from literature Lide (2005); The Dow Chemical Company (2010); Integrated Publishing (2010); Lu et al. (2009); Nortemann et al. (1997); Buchner et al. (1999); Gulich et al. (2009) (Fig. 2). It decreases with increasing temperature, which is due to the increasing thermal motion of the solvent molecules and reduces the alignment of the dipolar molecules by an external electric field. The dielectric constants of glycerol, , and DMSO, , are much smaller than the one of water, , for example , and at . Therefore, the solvent dielectric constant, , decreases with increasing glycerol and DMSO content, with the decrease being more pronounced for glycerol (Figs. 2a and b). There is also a significant decrease of with increasing salt concentration, ; adding NaCl lowers more than adding glycerol (Fig. 2c) Nortemann et al. (1997); Buchner et al. (1999); Gulich et al. (2009). This decrease is related to the decrease in the electric polarizability of the solution caused by the alignment and attraction of the water molecules by the salt ions.
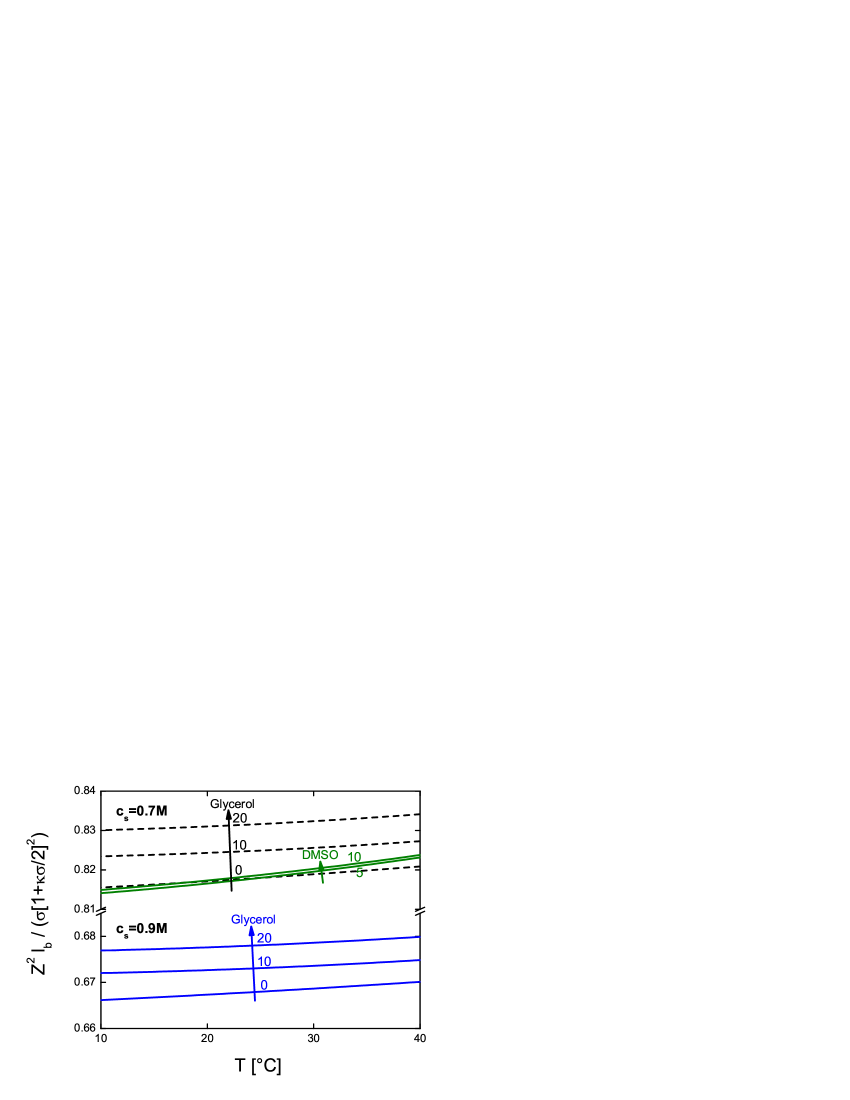
Based on these static dielectric constants, we calculate the repulsive electrostatic interaction part, , (Eqs. (6) and (7)) for the different compositions, i.e. different added salt, glycerol and DMSO content. Upon increasing the salt (NaCl) concentration , the screening parameter, , increases and thus the contact value of the electrostatic potential, , decreases (Fig. 3). In addition, depends on the solution composition since the Bjerrum length depends on . Adding glycerol or DMSO decreases (Figs. 2a and b) and hence increases , with the effect of glycerol being significantly stronger.
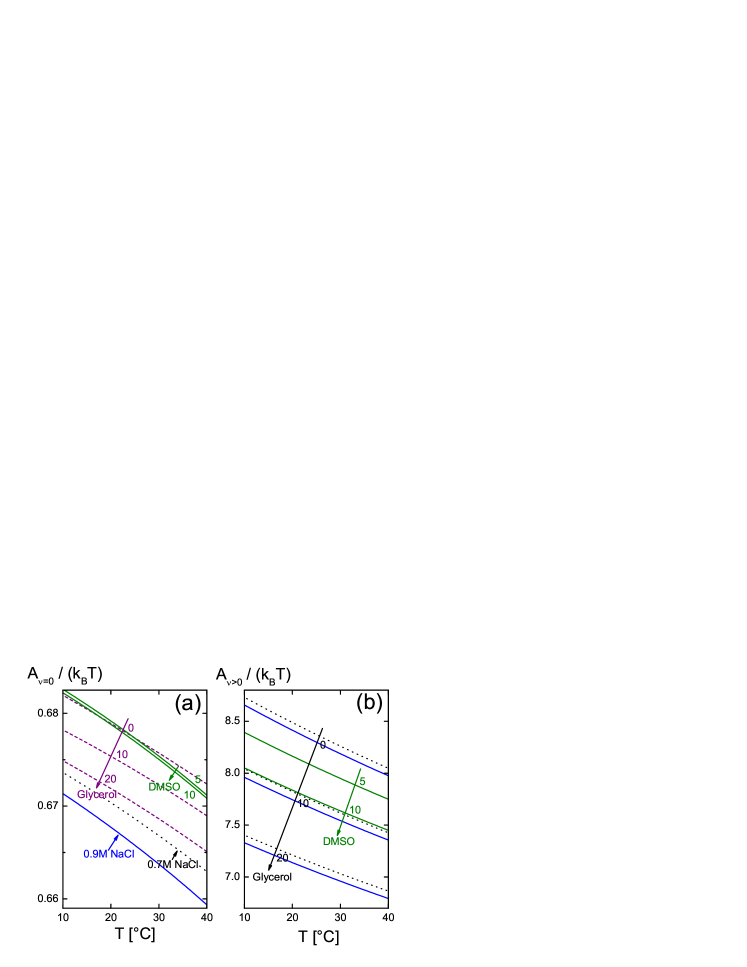
We have determined the zero- and non-zero frequency parts of the Hamaker constant (Eq. (9)) based on the above values of the refractive indices and static dielectric constants. The non-zero frequency part, , is about ten times larger than the zero-frequency part, , and hence dominates (Fig. 4). Both parts decrease with increasing temperature as well as increasing salt, glycerol and DMSO content. Glycerol and DMSO cause about the same decrease of , reflecting a similar effect on (Eq. (9) and Fig. 1). In contrast, we find a less significant decrease of upon addition of DMSO than of glycerol, due to the weak effect of DMSO on (Fig. 2b). Added salt (NaCl) causes a pronounced decrease of since salt significantly lowers (Fig. 2c). For our sample compositions, i.e. solvent mixtures with added salt, the temperature dependence of is not available. However, since is much smaller than , we neglect the effect of added salt and consider only the effect of glycerol and DMSO. Nevertheless, in our calculations we take into account the effect of added salt on and thus (Fig. 4b), which represents the dominating contribution to the Hamaker constant. Glycerol and DMSO not only similarly affect and thus the Hamaker constant , but also the total DLVO pair potential, , (see Fig. 5).
Cut-off length .
There is one potential parameter left to be determined, namely the cut-off length, . We choose it such that it reproduces the second virial coefficient, , which we have experimentally determined by static light scattering.
From a theoretical point of view, the second virial coefficient, , is introduced by expanding the reduced free energy density, , in a power series of the particle volume fraction, , according to
| (10) |
which involves the ideal gas part of the free energy density, , and its leading-order correction, the normalized or reduced second virial coefficient
| (11) |
The latter is equal to the ratio of the second virial coefficient,
| (12) |
to the second virial coefficient of a hard-sphere system, . For the DLVO pair potential, , (in Eq. (4)) the normalized second virial coefficient, , can be written as
| (13) |
The second virial coefficient characterizes the thermodynamic strength of the pair interactions. Positive values of indicate that repulsive interactions dominate, while negative values correspond to dominating attraction.
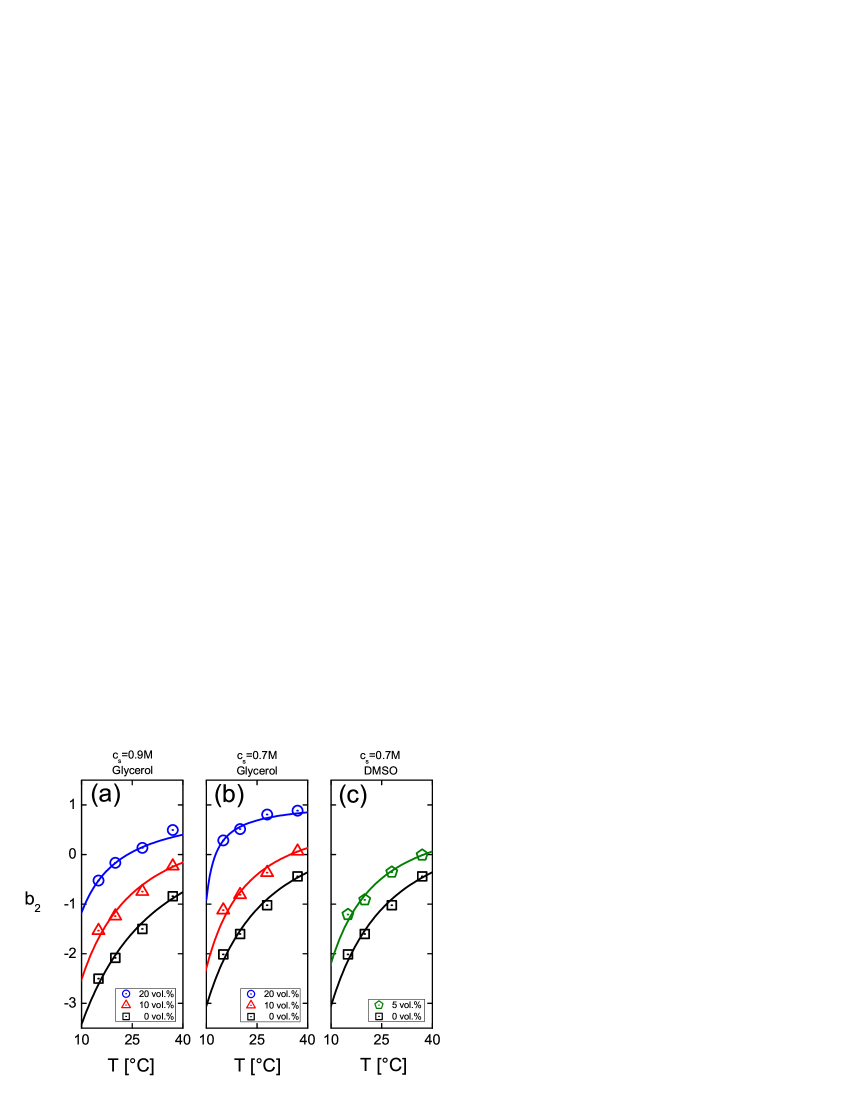
Using SLS, we determined the temperature dependence of in the range for all relevant solution compositions, i.e. salt (NaCl) concentrations, , as well as glycerol and DMSO volume fractions (Fig. 6). Outside this temperature range, reliable SLS experiments cannot be performed. With increasing temperature, as expected and thus the repulsion increases, which reflects the increasing electrostatic (Fig. 3) and decreasing van der Waals interactions (Fig. 4). This leads also to an increase of with increasing glycerol and DMSO concentrations, in agreement with previous observations Kulkarni and Zukoski (2002); Liu et al. (2004); Sedgwick et al. (2007), with DMSO having a significantly more pronounced effect. Furthermore, increases on lowering , due to the increased electrostatic repulsion (Figs. 6a and b). The sample with and glycerol even shows a positive in the investigated temperature range , indicating that the lysozyme pair potential is predominantly repulsive at high glycerol concentrations.
The experimental is fitted by the DLVO potential prediction (Eq. (13)), with the cut-off length being the only adjustable parameter. A constant does not reproduce the experimental data satisfactorily. We thus assume a linear temperature dependence of the cut-off length, , and fit the coefficients and to obtain optimal agreement between experimental and theoretical in the temperature range (Fig. 6). The fitting is done by applying the Levenberg-Marquardt method Press et al. (1992), and the improper integrals appearing in the expression for the second virial coefficient are evaluated using the Chebyshev quadrature. For all considered compositions and the temperature range of the light scattering experiments, increases with increasing (Fig. 7). Its values are in the range , except for the solution with NaCl and glycerol for which unphysically large are obtained. This range of values agrees with previously published values, which are in the range of Muschol and Rosenberger (1995); Kuehner et al. (1997); Velev et al. (1998); Tardieu et al. (1999); Egelhaaf et al. (2004). The large values for obtained for NaCl and glycerol are due to the positive-valued experimental , while the DLVO model predicts a predominantly attractive potential and thus a negative . This forces to rapidly grow with to reduce the attractive van der Waals contribution. The effect of the van der Waals interaction on is controlled by the Hamaker constant and the cut-off length . A change in one of the two hence can be compensated (or enhanced) by a corresponding change in the other parameter.
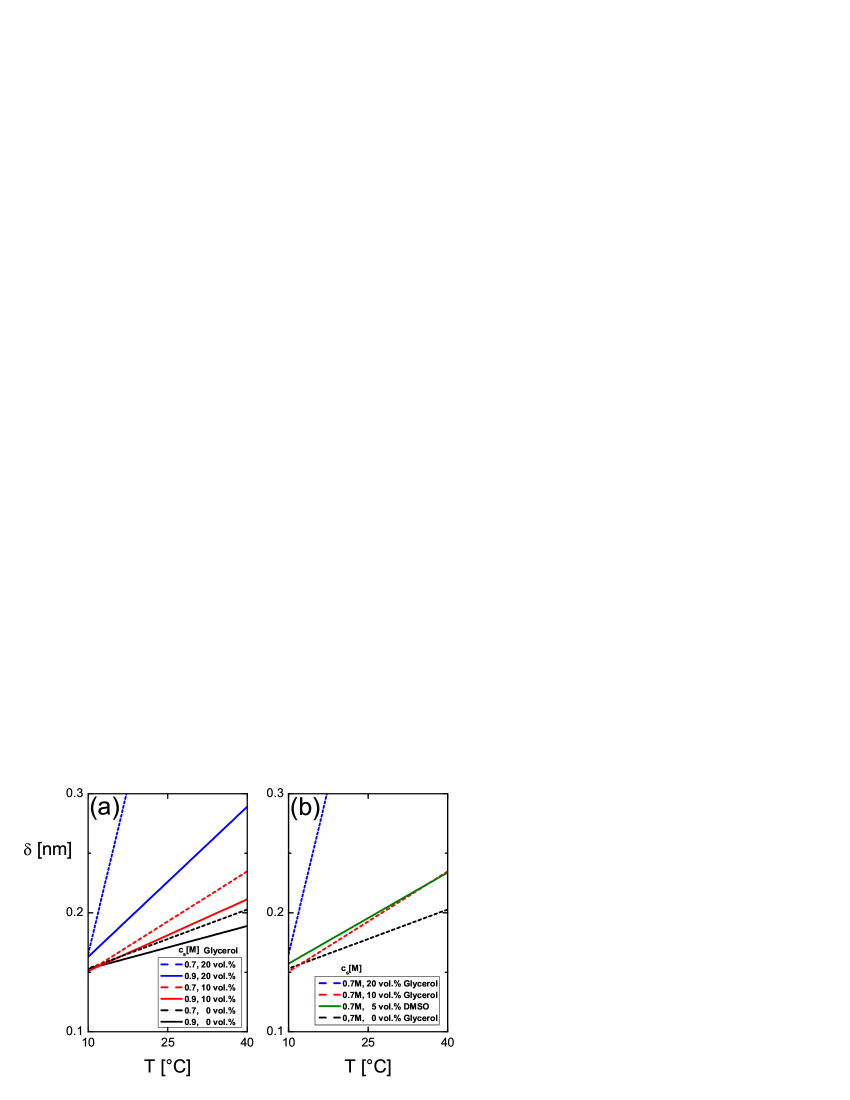
The cut-off length, , accounts for molecular effects on a coarse-grained level, such as the solvation shell, which might contain both water and additive molecules (see Sec. I), or the condensation of counterions on the protein surface, i.e. in the Stern layer. Its increase with increasing temperature and glycerol content is consistent with previous findings Sinibaldi et al. (2007); Esposito et al. (2009); Vagenende et al. (2009). As mentioned above, glycerol affects less than DMSO, i.e. the addition of glycerol has about the same effect as DMSO (Figs. 6b and c), although the optical properties of the two solvents suggest a similar effect on and thus (Fig. 4) and, due to the small effect of glycerol and DMSO on the electrostatic interactions (Fig. 3), also on the DLVO potential (Fig. 5). This results in a larger cut-off length for DMSO for a given concentration of glycerol or DMSO (Fig. 7), and suggests that glycerol and DMSO interact differently with lysozyme. Compared to glycerol, little is known about the DMSO-lysozyme interactions, apart from a preferential hydration of lysozyme in water-DMSO mixtures indicating a weak or no binding of DMSO to lysozyme Arakawa et al. (2007); Kamiyama et al. (2009). This suggests that DMSO mainly influences the dielectric properties of the solution, and is consistent with the observed weaker temperature dependence of the cut-off length in the case of DMSO.
III.2 Phase Behavior
We have now determined all values of the parameters determining the DLVO model. We can thus predict the phase behavior without any free parameters and compare it to our experimental observations.
III.2.1 Phase Behavior and Free Energy by Thermodynamic Perturbation Theory
Our prediction of the phase behavior of lysozyme is based on expressions for the Helmholtz free energy which are obtained by the second-order thermodynamic perturbation theory (TPT) of Barker and Henderson Barker and Henderson (1976). Knowledge of the free energy of the fluid and solid phases allows us to deduce all equilibrium thermodynamic properties, such as the fluid-solid and gas-liquid coexistence curves including the critical point. The Barker-Henderson theory is known to yield quite accurate results Hagen and Frenkel (1994); Cochran and Chiew (2004). It is therefore widely used to calculate the phase diagram of protein solutions Tavares et al. (2004); Boström et al. (2006); Lima et al. (2007); Gögelein et al. (2008); Dorsaz et al. (2009).
Within TPT, the free energy, , is expanded in powers of the perturbation potential , where is the pair potential of a reference system and the total protein-protein pair potential (see Eq. (4)). The reference system is an effective hard-sphere system with diameter , which takes into account the cut-off length in Eq. (8). Instead of the free energy, , of a system with proteins in a volume , we use the dimensionless free energy density , where is the particle volume. Expanding the free energy density, , up to second order in gives
| (14) | |||||
where is the effective sphere volume fraction, and the isothermal compressibility of the reference system with its dimensionless osmotic pressure. Furthermore, is the radial distribution function of hard spheres in the fluid phase, and the orientationally-averaged pair distribution function of hard spheres in the solid phase. For the radial distribution function in the fluid phase, we use the Verlet-Weis corrected Verlet and Weis (1972) Percus-Yevick solution Wertheim (1963); Throop and Bearman (1965), and for the orientationally-averaged pair distribution function the expression by Kincaid Kincaid and Weis (1977) for a face-centered cubic (fcc) crystal phase. The free energy density, , of the effective hard-sphere reference system is separately defined in the fluid and solid branches. In the fluid phase, consists of two parts: First, the ideal gas part,
| (15) |
where is the thermal wavelength, the protein mass and . Second, the interaction part which is approximated by the accurate Carnahan-Starling equation of state Carnahan and Starling (1969)
| (16) |
In the solid phase, is described by Wood’s equation of state Wood (1952) on assuming a fcc crystalline lattice
| (17) |
where is the fcc volume fraction for closed packing. To evaluate the free energy density, , in the solid phase, the integrals in Eq. (14) are divided into intervals centered around the crystal lattice sites, which is necessary to sufficiently resolve the discreteness of that develops with increasing .
The coexistence of gas (g) and liquid (l) phases requires an identical temperature , osmotic pressure and chemical potential in both phases. While the temperatures of two phases in contact are always identical under equilibrium conditions, the latter two conditions determine the two volume fractions, namely that of the coexisting gas, , and liquid phase, :
| with | (18) | ||||
| with | (19) |
Similarly, the coexistence of fluid (f) and solid (s) phases is determined by the two conditions
| (20) | |||
| (21) |
where is the volume fraction of the fluid, and the one of the coexisting solid phase. To compute the phase coexistence curves, the Newton-Raphson method with line search is applied Press et al. (1992).
The critical point terminates the gas-liquid coexistence curve. It is determined by the vanishing second and third derivatives of the free energy density, i.e., by
| (22) |
The higher-order derivatives of the free energy are calculated using Ridder’s implementation of Neville’s algorithm Press et al. (1992).
Before comparing our theoretical and experimental findings, we test the accuracy of our TPT implementation. No simulated phase diagrams are available for the DLVO model with our parameter values. However, Monte Carlo simulations Hagen and Frenkel (1994); Shukla (2000) have been used to determine the phase diagram of hard spheres interacting via an attractive Yukawa potential
| (23) |
where is the (contact) strength, and the range of the attraction.
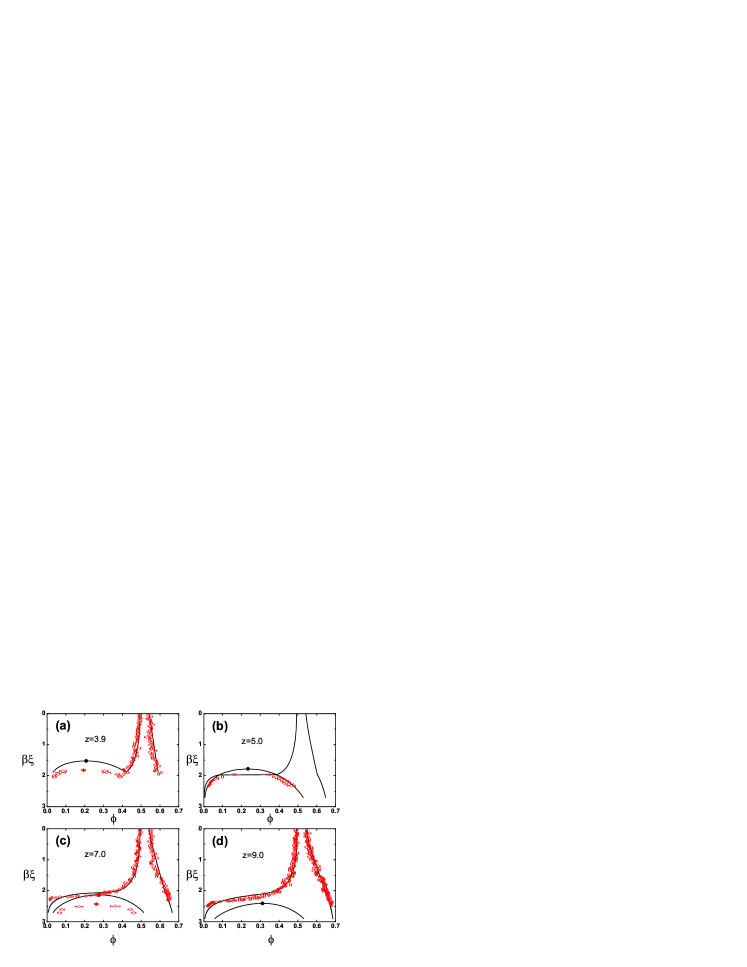
Using TPT, we calculate the phase diagram of this system. The calculated fluid-solid coexistence curves agree with the simulated ones for all investigated values of (see Fig. 8). Also the widths of the gas-liquid coexistence curves are well reproduced. The calculated gas-liquid binodals, however, are located slightly above the simulation data. We suppose that the binodals are shifted because the mean-field type TPT does not account for critical density fluctuations. Critical fluctuations allow a system to probe density inhomogeneities and thus tend to stabilize the homogeneous supercritical fluid phase against phase separation, therefore shifting the critical point to lower temperatures. A renormalization-group correction scheme has been derived Lue and Prausnitz (1998) which, according to previous calculations Fu et al. (2003), is expected to flatten the coexistence curves around the critical point.
III.2.2 Experimentally Determined Phase Behavior
We experimentally determined the fluid-solid and gas-liquid coexistence curves for different contents of added salt (NaCl), glycerol and DMSO (Fig. 9). For all compositions explored, the gas-liquid binodals lie within the fluid-solid coexistence regions and are thus metastable. This is typical for short-ranged attractive pair potentials Broide et al. (1996); Asherie et al. (1996); Rosenbaum et al. (1996); Muschol and Rosenberger (1997). The binodal widens rapidly upon cooling at volume fractions below the critical volume fraction , while the data for suggest almost flat binodals at volume fractions larger than the critical point value. Similar shapes of lysozyme binodals were observed previously Muschol and Rosenberger (1997); Rosenbaum and Zukoski (1996).
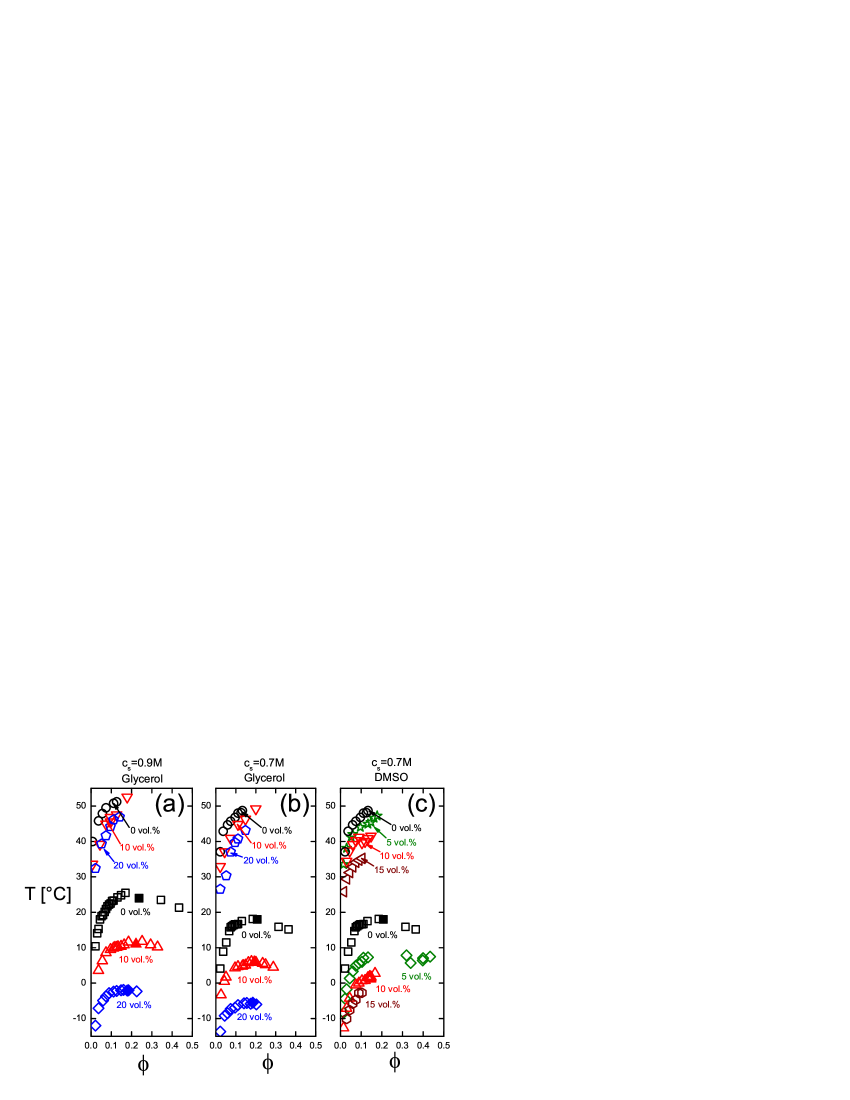
The effect of salt on the phase behavior was studied for and NaCl (Figs. 9a and b, respectively). With increasing salt concentration, , the fluid-solid and gas-liquid coexistence curves move to higher temperatures, and the width of the gas-liquid binodal increases. These findings are consistent with the electrostatic screening by added salt. Upon increasing , the screening length, , decreases. Thus the electrostatic repulsion decreases and attraction becomes more important. This favors crystals compared to the fluid phase and also the (metastable) gas-liquid phase separation compared to a homogeneous fluid. The fluid-solid as well as the gas-liquid coexistence curves hence shift to higher temperatures, and the gas-liquid coexistence curve becomes broader, as experimentally observed.
Upon addition of glycerol and DMSO, both coexistence curves shift to lower temperatures (see Fig. 9). The shift of the binodals is more pronounced, which widens the gap between the two coexistence curves. This trend has been observed before in other systems and is characteristic for a decreasing range of attraction Broide et al. (1996); Hagen and Frenkel (1994); Liu et al. (2005) (Fig. 5). The critical point is not only shifting to lower temperatures, but also to slightly lower volume fractions. Considering the quantitative effect on both curves, we find that the addition of glycerol and DMSO induce a similar shift. The higher efficiency of DMSO is consistent with its more pronounced effect on (Fig. 6).
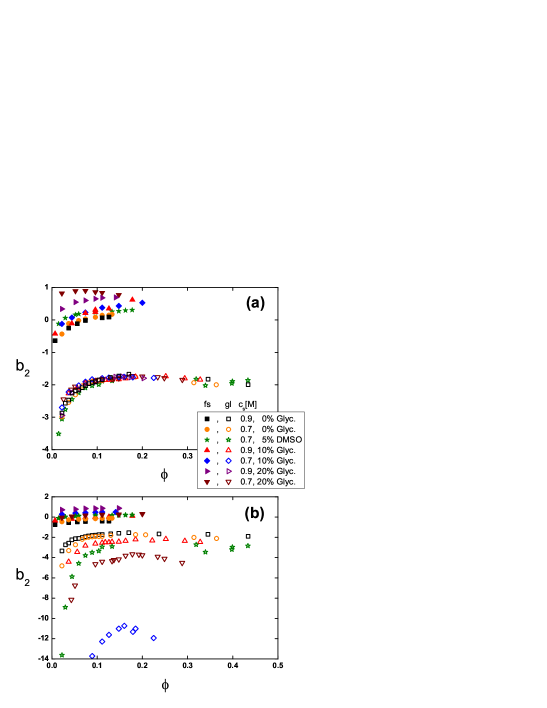
We have investigated the relation between the second virial coefficient, , and the location of the fluid-solid and especially the gas-liquid coexistence curves. For this purpose, we parameterized the temperature dependencies of the experimentally-determined second virial coefficients (Fig. 6) by the phenomenological relation , where and depend on the composition of the solution. Using this relation, the binodals are plotted in dependence of and in Fig. 10a. This representation leads to a collapse of all binodals onto a single curve, as it has been observed previously George and Wilson (1994); Rosenbaum and Zukoski (1996); Poon et al. (2000); Farnum and Zukoski (1999). This indicates that in our system the binodals are controlled by , i.e. by a single integral parameter characterizing the potential, and not by the details of the potential, such as its depth and range. By contrast, this scaling of is not observed for the fluid-solid transition. Nevertheless, this transition occurs for values consistent with previous reports Poon (1997).
If instead the values calculated based on the DLVO model are used, the fluid-solid and gas-liquid coexistence curves do not scale (see Fig. 10b) and the critical points are different. This indicates that the scaling very sensitively depends on the temperature dependence of and thus on the model. Small errors might be introduced by the simplifications implicit in the DLVO model. However, the main effect is due to the extrapolation of beyond the available temperature range (see Fig. 6), which indicates the need for a very reliable and robust parameterization of the temperature dependence of the cut-off length . To avoid spurious effects, in the following we scale the temperature and concentration axes by the critical temperatures and concentrations. This axis scaling also reduces artifacts due to the slight shift in the binodals caused by the mean-field nature of TPT (Fig. 8).
III.2.3 Comparison of Calculated and Experimentally Determined Phase Behavior
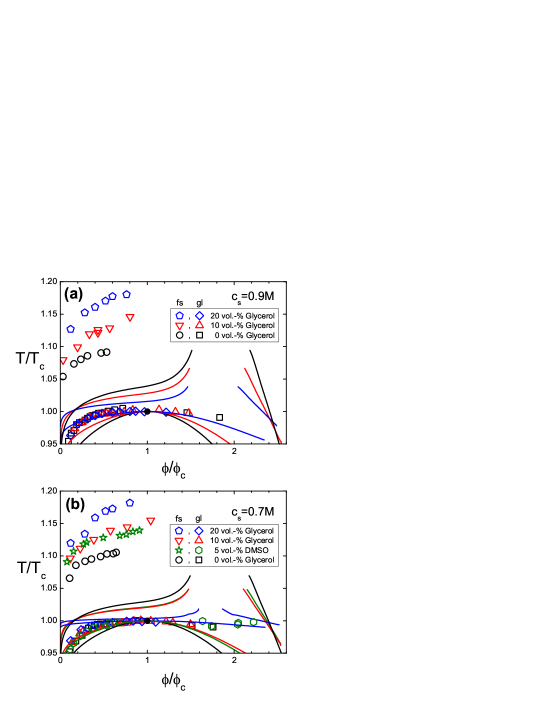
The experimental phase diagrams are now compared to our TPT predictions based on the DLVO model. The axes are scaled by the critical temperature, , and volume fraction, , which matches all theoretical and experimental critical points (see Fig. 11). (Note that in this representation the fluid-solid transition shifts to higher , in contrast to the representation using the absolute temperature scale (Fig. 9). This representation reveals an increase of the gap between the fluid-solid and the gas-liquid coexistence curves upon addition of glycerol and DMSO for the experimental data and, less pronounced, in the range for the theoretical predictions. Note that in the main part of the phase diagram the theoretically predicted gap actually decreases. In view of the successful test of the TPT approach (Fig. 8), we attribute this discrepancy to the inherent approximations of the DLVO potential and in particular to the model for the cut-off length .
The width of the gas-liquid coexistence curve is experimentally found to remain practically unchanged in this representation when glycerol or DMSO is added, while theory predicts a slight increase of the width. The theoretically and experimentally observed widths quantitatively agree at the largest glycerol content of (Fig. 11). In particular, our calculations do not reproduce the flat binodal region around the critical point, which we observe experimentally. As discussed above (see Fig. 8), this is attributed to the mean-field character of the theory. This is furthermore consistent with previous experiments Muschol and Rosenberger (1997) and simulations Pellicane et al. (2003). In particular, similar gas-liquid coexistence curves have been theoretically observed for colloidal dispersions with competing repulsive and attractive interactions, and have been attributed to critical fluctuations which become significant in an enlarged region of the phase diagram Archer et al. (2007).
IV Conclusions
In a combined theoretical and experimental effort, we investigated the phase behavior of aqueous lysozyme solutions in the presence of additives, namely glycerol and DMSO. We in particular investigated the fluid-solid and gas-liquid coexistence curves. Upon the addition of glycerol or DMSO, both curves shift to lower temperatures and, in addition, the gap between these two curves increases, consistent with a decreasing range of attraction upon increasing the content of additives.
Our theoretical calculations are based on a DLVO interaction potential. This models the proteins as hard spheres with an isotropic electrostatic repulsion, which is caused, e.g., by uniformly-distributed charges, and an isotropic van der Waals attraction characterized by the (effective) Hamaker constant and a cut-off length. The Hamaker constant is calculated based on the experimentally determined, or in the literature available, macroscopic optical and dielectric properties of the solvent mixtures and the protein, namely their indices of refraction and static dielectric constants. The cut-off length was adjusted to reproduce the second virial coefficient, which was experimentally determined by static light scattering. We find cut-off lengths in the range , with the value increasing with increasing temperature and glycerol content and, even more pronounced, with increasing DMSO content, consistent with previous studies Muschol and Rosenberger (1995); Kuehner et al. (1997); Velev et al. (1998); Tardieu et al. (1999); Egelhaaf et al. (2004). The cut-off length subsumes molecular effects, such as a hydration shell or condensed counterions on the protein surface. Our experiments thus indicate that glycerol and DMSO interact differently with lysozyme. DMSO seems to affect the lysozyme interactions by mainly lowering the solvent dielectric constant, while glycerol likely changes the hydrophobicity of the lysozyme surface. This is in accordance with recent computer simulation results Vagenende et al. (2009).
Having determined the values of all parameters, we calculated the interaction potential for different temperatures and compositions, added salt (NaCl) concentrations as well as different glycerol and DMSO contents. We found that glycerol and DMSO increase the repulsive interaction, as quantified by the second virial coefficient . For a sufficiently high content of additives, a predominantly repulsive protein interaction is observed. The increase of the repulsion is significantly stronger for DMSO, although the optical and dielectric properties of glycerol and DMSO are very similar. We hence attribute this difference to the specific molecular interactions of the additives with lysozyme, characterized by the cut-off length .
Based on the DLVO model and its parameters, we predict the phase behavior without any free parameters. Our calculations are based on the thermodynamic perturbation theory (TPT), which was successfully tested and found to be numerically fast. The theoretical predictions were then compared to our experimental observations, for the fluid-solid and the gas-fluid coexistence curves. Particular attention was paid to the effect of additives on these curves, and the size of the gap between them. We find that the general trends in the phase behavior, and especially the effects of the additives, are also reproduced by the DLVO model, although not on a quantitative level.
The strength of the DLVO model lies in its simplicity, for it allows to incorporate the effect of solvent mixtures by taking into account their macroscopic optical and dielectric properties. More complex models are available, but might need to be adapted to proteins and solvent mixtures or additives. For example, theoretical calculations based on anisotropic attractive interactions successfully describe both the width of the binodal and the gap between the binodal, and the fluid-solid transition for aqueous protein solutions without additives Lomakin et al. (1999); Gögelein et al. (2008, ). Anisotropic attractive interactions are indeed induced by hydrophobic patches on the lysozyme surface, and have been taken into account in a patchy sphere model by Curtis et al. Curtis et al. (2002). Anisotropic attractions as well as repulsions, as due e.g. to an anisotropic charge distribution or van der Waals interaction, are not taken into account in our DLVO model. Our model furthermore neglects non-electrostatic contributions to the lysozyme pair potential that originate from dispersion forces between the micro-ions and proteins Boström et al. (2006); Lima et al. (2007). The range and strength of such non-electrostatic and hydrophobic interactions has not been determined experimentally, and hence cannot be taken into account unambiguously, e.g., through an effective potential of mean force. Furthermore, hydrophobic interactions, as well as non-rigid and non-spherical shapes, specific surface properties, ion-specific interactions, hydration, and other effects need to be explored in future studies.
V Acknowledgements
We thank the International Helmholtz Research School of Biophysics and Soft Matter (IHRS BioSoft) and the Deutsche Forschungsgemeinschaft (DFG) for financial support.
References
- McPherson (1999) A. McPherson, Crystallization of Biological Macromolecules (Cold Spring Harbor, New York, 1999), 1st ed.
- Sousa (1995) R. Sousa, Acta Crystallogr., Sect. D: Biol. Crystallogr. D51, 271 (1995).
- Arakawa et al. (2007) T. Arakawa, Y. Kita, and S. N. Timasheff, Biophys. Chem. 131, 62 (2007).
- Kamiyama et al. (2009) T. Kamiyama, H. L. Liu, and T. Kimura, J. Therm. Anal. Cal. 95, 353 (2009).
- McPherson (1990) A. McPherson, Eur. J. Biochem. 189, 1 (1990).
- ten Wolde and Frenkel (1997) P. R. ten Wolde and D. Frenkel, Science 277, 1975 (1997).
- Sedgwick et al. (2005) H. Sedgwick, K. Kroy, A. Salonen, M. B. Robertson, S. U. Egelhaaf, and W. C. K. Poon, Eur. Phys. J. E 16, 77 (2005).
- Israelachvili (1991) J. N. Israelachvili, Intermolecular and Surface Forces (Academic Press, London, 1991).
- Pusey (1991) P. N. Pusey, in Liquids, Freezing and Glass Transition, edited by J. Hansen, D. Levesque, and J. Zinn-Justin (Elsevier Science Publishers B.V., Les Houches, 1991).
- Barker and Henderson (1976) J. A. Barker and D. Henderson, Rev. Mod. Phys. 1976, 587 (1976).
- Knubovets et al. (1999) T. Knubovets, J. J. Osterhout, P. J. Connolly, and A. M. Klibanov, Proc. Natl. Acad. Sci. USA 96, 1262 (1999).
- Vagenende et al. (2009) V. Vagenende, M. G. S. Yap, and B. L. Trout, Biochemistry 48, 11084 (2009).
- Voets et al. (2010) I. K. Voets, W. A. Cruz, C. Moitzi, P. Lindner, E. P. G. Areas, and P. Schurtenberger, J. Phys. Chem. B 114, 11875 (2010).
- Poon et al. (2000) W. C. K. Poon, S. U. Egelhaaf, P. A. Beales, A. Salonen, and L. Sawyer, J. Phys.: Condens. Matter 12, L569 (2000).
- Warren (2002) P. Warren, J. Phys.: Condens. Matter 14, 7617 (2002).
- Pellicane et al. (2003) G. Pellicane, D. Costa, and C. Caccamo, J. Phys.: Condens. Matter 15, 375 (2003).
- Broide et al. (1996) M. L. Broide, T. M. Tominc, and M. D. Saxowsky, Phys. Rev. E 53, 6325 (1996).
- Farnum and Zukoski (1999) M. Farnum and C. Zukoski, Biophys. J. 76, 2716 (1999).
- Priev et al. (1996) A. Priev, A. Almagor, S. Yedgar, and B. Gavish, Biochemistry 35, 2061 (1996).
- Sinibaldi et al. (2007) R. Sinibaldi, M. G. Ortore, F. Spinozzi, F. Carsughi, H. Frielinghaus, S. Cinelli, G. Onori, and P. Mariani, J. Chem. Phys. 126, 235101 (2007).
- Merzel and Smith (2002) F. Merzel and J. C. Smith, Proc. Natl. Acad. Sci. USA 99, 5378 (2002).
- Esposito et al. (2009) A. Esposito, L. Comez, S. Cinelli, F. Scarponi, and G. Onori, J. Phys. Chem. B 113, 16420 (2009).
- Sedgwick et al. (2007) H. Sedgwick, J. E. Cameron, W. C. K. Poon, and S. U. Egelhaaf, J. Chem. Phys. 127, 125102 (2007).
- Lu et al. (2003) J. Lu, X.-J. Wang, and C.-B. Ching, Cryst. Growth Des. 3, 83 (2003).
- Gosavi et al. (2011) R. A. Gosavi, V. Bhamidi, S. Varanasi, and C. A. Schall, Langmuir 25, 4579 (2011).
- Kulkarni and Zukoski (2002) A. M. Kulkarni and C. F. Zukoski, Langmuir 18, 3090 (2002).
- Muschol and Rosenberger (1995) M. Muschol and F. Rosenberger, J. Chem. Phys. 103, 10424 (1995).
- Kuehner et al. (1997) D. E. Kuehner, C. Heyer, C. Ramsch, U. M. Fornfeld, H. W. Blanch, and J. M. Prausnitz, Biophys. J. 73, 3211 (1997).
- Kerker (1969) M. Kerker, The scattering of light and other electromagnetic radiation (Acad. Press, 1969).
- Narayanan and Liu (2003) J. Narayanan and X. Y. Liu, Biophys. J. 84, 523 (2003).
- Itakura et al. (2006) M. Itakura, K. Shimada, S. Matsuyama, T. Saito, and S. Kinugasa, J. Appl. Polym. Sci. 99, 1953 (2006).
- Voet and Voet (1990) D. Voet and J. Voet, Biochemistry (Wiley, New York, 1990).
- Stradner et al. (2004) A. Stradner, H. Sedgwick, F. Cardinaux, W. C. K. Poon, S. U. Egelhaaf, and P. Schurtenberger, Nature 432, 492 (2004).
- (34) Similarly, Farnum and Zukoski Farnum and Zukoski (1999) adjusted their values of to ensure that when using Eq.(2) the extrapolation provides the expected molar mass .
- Russel and Benzing (1981) W. B. Russel and D. W. Benzing, J. Colloid Interface Sci. 83, 163 (1981).
- Denton (2000) A. R. Denton, Phys. Rev. E 62, 3855 (2000).
- Tanford and Roxby (1972) C. Tanford and R. Roxby, Biochemistry 11, 2192 (1972).
- Yin et al. (2003) D. C. Yin, Y. Inatomi, N. I. Wakayama, and W. D. Huang, Cryst. Res. Technol. 38, 785 (2003).
- Dwyer et al. (2000) J. J. Dwyer, A. G. Gittis, D. A. Karp, E. E. Lattman, D. S. Spencer, W. E. Stites, and B. Garcia-Moreno, Biophys. J. 79, 1610 (2000).
- Harvey and Hoekstra (1972) S. C. Harvey and P. Hoekstra, J. Phys. Chem. 76, 2987 (1972).
- Rashkovich et al. (2008) L. Rashkovich, V. Smirnov, and E. Petrova, Phys. Solid State 50, 631 (2008).
- Pitera et al. (2001) J. W. Pitera, M. Falta, and W. F. van Gunsteren, Biophys. J. 80, 2546 (2001).
- Lide (2005) C. R. Lide, CRC Handbook of Chemistry and Physics (CRC, New York, 2005), 86th ed.
- The Dow Chemical Company (2010) The Dow Chemical Company (2010), URL http://www.dow.com/glycerine/resources/.
- Integrated Publishing (2010) Integrated Publishing (2010), URL http://www.tpub.com/content/ArmyCRREL/SR98_02/SR98_020009.htm%.
- Lu et al. (2009) Z. Lu, E. Manias, D. D. MacDonald, and M. Lanagan, J. Phys. Chem. A 113, 12207 (2009).
- Nortemann et al. (1997) K. Nortemann, J. Hilland, and U. Kaatze, J. Phys. Chem. A 101, 6864 (1997).
- Buchner et al. (1999) R. Buchner, G. T. Hefter, and P. M. May, J. Phys. Chem. A 103, 1 (1999).
- Gulich et al. (2009) R. Gulich, M. Kohler, P. Lunkenheimer, and A. Loidl, Radiat. Environ. Biophys. 48, 107 (2009).
- Liu et al. (2004) W. Liu, D. Bratko, J. M. Prausnitz, and H. W. Blanch, Biophys. Chem. 107, 289 (2004).
- Press et al. (1992) W. H. Press, S. A. Teukolsky, W. T. Vetterling, and B. P. Flannery, Numerical Recipes in C (Cambridge University Press, New York, 1992), 2nd ed.
- Velev et al. (1998) O. D. Velev, E. W. Kaler, and A. M. Lenhoff, Biophys. J. 75, 2682 (1998).
- Tardieu et al. (1999) A. Tardieu, A. Le Verge, M. Malfois, F. Bonneté, S. Finet, M. Riès-Kautt, and L. Belloni, J. Cryst. Growth 196, 193 (1999).
- Egelhaaf et al. (2004) S. U. Egelhaaf, V. Lobaskin, H. H. Bauer, H. P. Merkle, and P. Schurtenberger, Eur. Phys. J. E 13, 153 (2004).
- Hagen and Frenkel (1994) M. H. J. Hagen and D. Frenkel, J. Chem,. Phys. 101, 4093 (1994).
- Cochran and Chiew (2004) T. W. Cochran and Y. C. Chiew, J. Chem. Phys. 121, 1480 (2004).
- Tavares et al. (2004) F. W. Tavares, D. Bratko, A. Striolo, H. W. Blanch, and J. M. Prausnitz, J. Chem. Phys. 120, 9859 (2004).
- Boström et al. (2006) M. Boström, F. W. Tavares, B. W. Ninham, and J. M. Prausnitz, J. Phys. Chem. B 110, 24757 (2006).
- Lima et al. (2007) E. R. A. Lima, E. C. Biscaia Jr., M. Boström, F. W. Tavares, and J. M. Prausnitz, J. Phys. Chem. C 111, 16055 (2007).
- Gögelein et al. (2008) C. Gögelein, G. Nägele, R. Tuinier, T. Gibaud, A. Stradner, and P. Schurtenberger, J. Chem. Phys. 129, 085102 (2008).
- Dorsaz et al. (2009) N. Dorsaz, G. M. Thurston, A. Stradner, P. Schurtenberger, and G. Foffi, J. Phys. Chem. B 113, 1693 (2009).
- Verlet and Weis (1972) L. Verlet and J. J. Weis, Phys. Rev. A 5, 939 (1972).
- Wertheim (1963) M. S. Wertheim, Phys. Rev. Lett. 10, 321 (1963).
- Throop and Bearman (1965) G. J. Throop and R. J. Bearman, J. Chem. Phys. 42, 2408 (1965).
- Kincaid and Weis (1977) J. M. Kincaid and J. J. Weis, Mol. Phys. 34, 931 (1977).
- Carnahan and Starling (1969) N. F. Carnahan and K. E. Starling, J. Chem. Phys. 51, 635 (1969).
- Wood (1952) W. W. Wood, J. Chem. Phys. 20, 1334 (1952).
- Shukla (2000) K. P. Shukla, J. Chem. Phys. 112, 10358 (2000).
- Lue and Prausnitz (1998) L. Lue and J. M. Prausnitz, J. Chem. Phys. 108, 5529 (1998).
- Fu et al. (2003) D. Fu, Y. Li, and J. Wu, Phys. Rev. E 68, 011403 (2003).
- Asherie et al. (1996) N. Asherie, A. Lomakin, and G. B. Benedek, Phys. Rev. Lett. 77, 4832 (1996).
- Rosenbaum et al. (1996) D. Rosenbaum, P. C. Zamora, and C. F. Zukoski, Phys. Rev. Lett. 76, 150 (1996).
- Muschol and Rosenberger (1997) M. Muschol and F. Rosenberger, J. Chem. Phys. 107, 1953 (1997).
- Rosenbaum and Zukoski (1996) D. F. Rosenbaum and C. F. Zukoski, J. Crystal Growth 169, 752 (1996).
- Liu et al. (2005) H. Liu, S. Garde, and S. Kumar, J. Chem. Phys. 123, 174505 (2005).
- George and Wilson (1994) A. George and W. Wilson, Acta Crystallogr. D, Sect. D: Biol. Crystallogr. 50, 361 (1994).
- Poon (1997) W. C. K. Poon, Phys. Rev. E 55, 3762 (1997).
- Archer et al. (2007) A. J. Archer, D. Pini, R. Evans, and L. Reatto, J. Chem. Phys. 126, 014104 (2007).
- Lomakin et al. (1999) A. Lomakin, N. Asherie, and G. B. Benedek, Proc. Natl. Acad. Sci. USA 96, 9465 (1999).
- (80) C. Gögelein, F. Romano, F. Sciortino, and A. Giacometti, Fluid-fluid and fluid-solid transitions in the Kern-Frenkel model from Barker-Henderson thermodynamic perturbation theory, submitted to The Journal of Chemical Physics.
- Curtis et al. (2002) R. A. Curtis, C. Steinbrecher, M. Heinemann, H. W. Blanch, and J. M. Prausnitz, Biophys. Chem. 98, 249 (2002).