Electron Spin Excited States Spectroscopy in a Quantum Dot Probed by QPC Back-action
Abstract
The quantum point contact (QPC) back-action has been found to cause non-thermal-equilibrium excitations to the electron spin states in a quantum dot (QD). Here we use back-action as an excitation source to probe the spin excited states spectroscopy for both the odd and even electron numbers under a varying parallel magnetic field. For a single electron, we observed the Zeeman splitting. For two electrons, we observed the splitting of the spin triplet states and and found that back-action drives the singlet state overwhelmingly to other than . All these information were revealed through the real-time charge counting statistics.
The spin states of few electrons in quantum dots (QD) have been demonstrated as potential candidates for qubits Spin-Qubits-Kouwenhoven ; Spin-Qubits-Petta . The Zeeman states for odd number of electrons and the spin singlet-triplet states for even number of electrons form the basis of qubit operation and detection. Also we know that any detection to the qubit states would necessarily have back-action Backaction-Kouwenhoven ; Backaction-Dephase . Recently we found that the back-action from a quantum point contact (QPC) would excite the spin singlet to triplet states and degrade the fidelity of qubit operation Ming-RTS-ST . However, this study was limited to the non-degenerate spin states at zero magnetic field.
To know the influence of back-action on all relevant spin states would be very helpful for spin based qubits. In this work we applied a parallel magnetic field to lift the spin states degeneracy and explored their spectroscopy. By studying the non-equilibrium part of the real-time charge counting statistics under strong back-action condition, we observed the excitation from an up to a down spin state for one single electron, and the excitation from the spin singlet state to triplet states and for two electrons. We revealed the linear dependence of the exchange energy on the magnetic field. More importantly, we found that back-action overwhelmingly excites to state. This implies that spin qubits based on are more immune of back-action than .
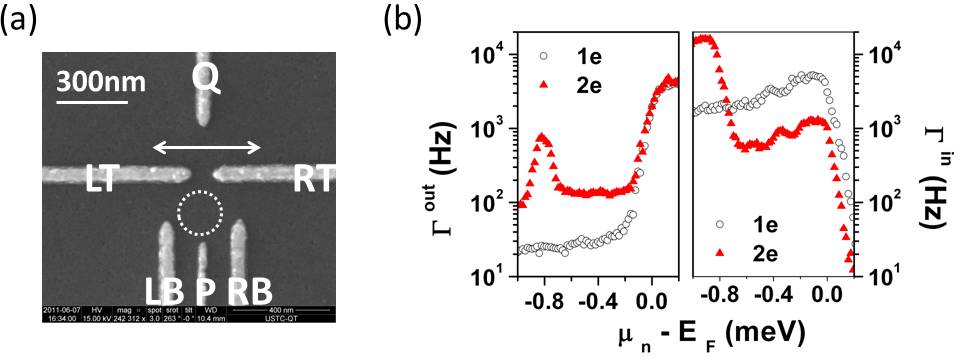
The GaAs sample is the same as in earlier experiments Ming-RTS-ST ; Ming-RTS-Backaction . Fig. 1 is a scanning electron microscopy (SEM) image of the QD-QPC structure. The QD is configured to be in thermal equilibrium with the electron reservoir on the right side. Random telegraph signal (RTS), the single electron tunneling back and forth between the QD and the right side reservoir due to thermal fluctuations, has been recorded and analyzed. Fig. 1 (b) shows the RTS statistics and for the last two electrons. As we found earlier, the QPC back-action caused severe non-thermal-equilibrium effect. For the tunneling, the back-action drives the electron out of the QD even when the electron addition energy the reservoir Fermi level Ming-RTS-Backaction . As a result, shows a strong saturation tail for both and when . What’s more, those slowly relaxing excited states provide additional tunneling channels and give rise to extra features Ming-RTS-ST . For , we see a strong side peak in and an extra elevated plateau in at about , arising from the spin singlet-triplet excitation. For , no extra feature is seen since the spin up and down states are degenerate and indistinguishable.
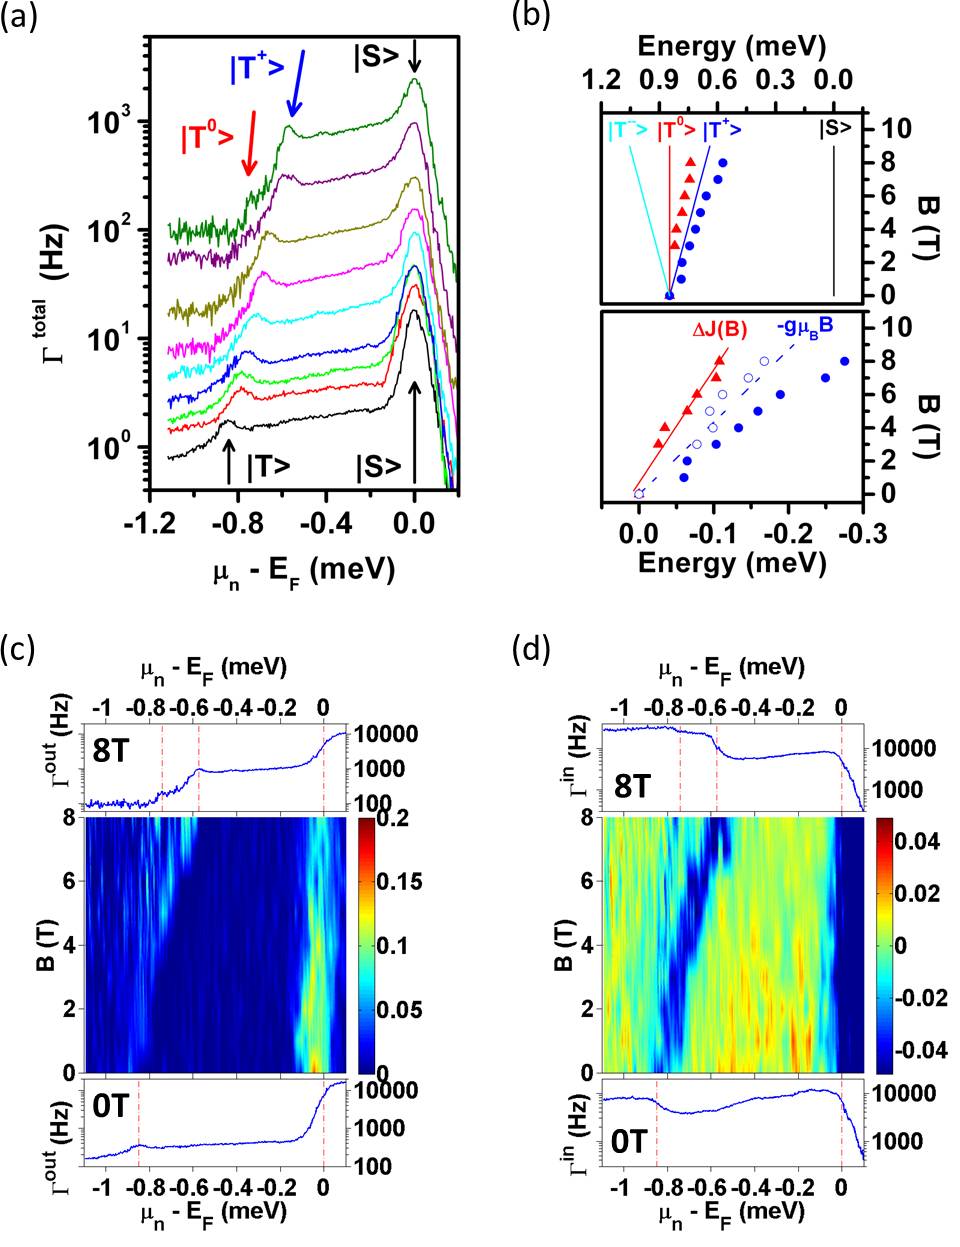
Now we apply a parallel magnetic field to lift the energy degeneracy between the two Zeeman states for the odd number of electrons, and between the three triplet states for the even electron numbers. This will enable us to probe the detailed spin excited states spectroscopy and study the effect of back-action on each individual spin states. Fig. 2 (a) shows the total tunneling rate for with varying magnetic field strength . The black line at the bottom is at . Due to the strong back-action, we see both the ground state and the excited states , located at and , respectively. At this point, we don’t know refers to which one of the three energy degenerate configurations , or . As we increase the magnetic field, the peak at shifts closer to the singlet state , at a speed comparable to that of the Zeeman splitting. This suggests that the state plays the major role. The state, which stays more constant, is also visible at large magnetic field (). But its peak amplitude is much smaller than that of . The third state is not visible in this experiment. This phenomena is also presented in Fig. 2 (c) and (d), which are the 3D diagrams for the numerical derivative of and . The triplet state splits into two with increasing magnetic field. The one obviously shifting towards the singlet state is , and the other one staying more constant is .
In Fig. 2 (b) we explicitly extracted the energy of each states with respect to the singlet energy, as functions of the magnetic field. On the upper part of the figure the blue circles are the energy of and the red triangles are that of . Only at we are able to collect data for . The solid lines show the standard picture of the spin singlet-triplet energy spectrum. At , the three triplet states are degenerate with a certain separation from , called exchange energy . With increasing , is assumed invariant while and shift by the amount of respectively. Experimentally, we found that the separation between and fits very well with the predicted Zeeman splitting using a g-factor in GaAs, as indicted by the blue open circles and blue dashed line in the lower part of Fig. 2 (b). This quantitatively proves that the two states we have seen are the two different spin excited states.
What’s more, we noticed that the energy of is not exactly invariant under magnetic field. It slightly decreases with field, which means that the exchange energy is actually a function of magnetic field. In the lower part of Fig. 2 (b) we presented , defined as . The linear fitting gives a slope . If we don’t consider the decrease of exchange energy with field, then the extracted energy shift of itself is too large to be explained as the Zeeman splitting, shown as the blue closed circles in the lower part of Fig. 2 (b). Thus the field dependence of must be taken into account. The decrease of exchange energy could be due to the confinement of the electron wavefunctions by magnetic field, which isolates the two electrons and decreases their interaction.
One striking finding in the above experiment is that the state is much more prominent than . No matter for , or , the state is always the major structure while is barely visible until it is separated from by a large enough magnetic field. Using the phenomenological model that we developed to analyze the back-action driven tunneling rates Ming-RTS-ST , we could quantitatively compare the excitation rate from to and . Simulation on the data taken at first reveals that the back-action driven rate for the electrons to tunnel out of the QD is of the maximum RTS tunneling rate for the ground state ( and ). for the two singlet states and varies a little ( and ), and their relaxation time also shows small change ( and ). However, the back-action driven excitation rate from to is times large as that from to : and . It is this big difference that makes the state dominate the excited states spectroscopy.
Thus, we made the conclusion that QPC back-action prefers driving the spin singlet up to other than state. It is uaually assumed that due to the spin-phonon selection rules, the interaction is suppressed in the lowest order, which makes the relaxation from to longer than the other two triplet states Spin-Relaxation-Selection -Rules . On the other hand, this also means that the phonon mediated back-action between and is weaker. This could possibly explain our observation. Either or has been chosen as the basis for qubit operation. For instance, the spin swap operation has been demonstrated with the states Spin-Qubits-Petta , and has been utilized to implement a spin beam-splitter Spin-Beam-Splitter-Petta . Our finding implies that the back-action should have less impact on spin qubits based on the former mechanism.
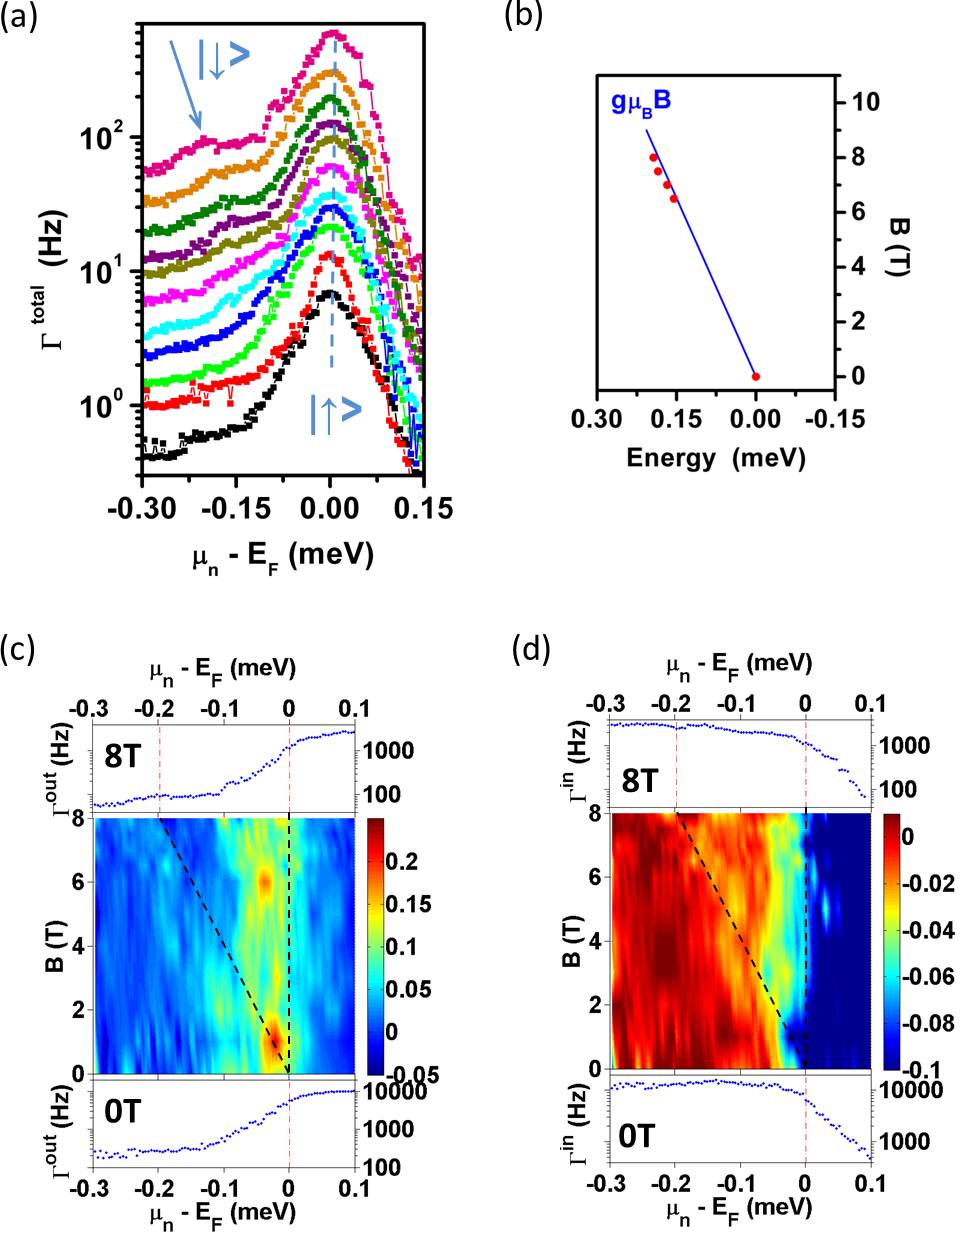
For the odd number of electrons, at zero magnetic field the two spin states are energy degenerate and are not distinguishable. Now with a parallel magnetic field we can study them separately. Fig. 3 (a) shows for as a function of magnetic field. The splitting of the spin down state is overall weak, and only visible at . Nonetheless, in Fig. 3 (b) we extracted the energy separation between and states at large field, which agrees well with the predicted Zeeman splitting. This verified the spin nature of these two states. Fig. 3 (c) and (d) show the 3D pictures for the numerical derivative of and . Although noisy, the linear splitting of the two spin states with magnetic field is not missed, even at small field. The weak signal for the spin down states is possibly due to the large thermal energy (). Unlike the separation of from by a large exchange energy, the two spin states for a single electron are too close to each other, unless at extremely large magnetic field. Thus it is not easy to distinguish the two spin states for odd electron numbers.
In conclusion, the detailed spin states spectroscopy for one and two electrons in a single QD was studied under strong back-action condition. The real-time charge counting statistics could detect the excitation from a spin up to down state for a single electron, and the excitation from spin singlet to different triplet states. We revealed that the spin exchange interaction linearly decreases with magnetic field, and found that the QPC back-action mainly drives to the state.
This work was supported by the NFRP 2011CBA00200 and 2011CB921200, NNSF 10934006, 11074243, 10874163, 10804104, 60921091.
References
- (1) J. M. Elzerman, R. Hanson, L. H. Willems van Beveren, B. Witkamp, L. M. K. Vandersypen, and L. P. Kouwenhoven, Nature 430, 432 (2004).
- (2) J. R. Petta, A. C. Johnson, J. M. Taylor, E. A. Laird, A. Yacoby, M. D. Lukin, C. M. Marcus, M. P. Hanson, and A. C. Gossard, Science 309, 2180 (2005).
- (3) Ramón Aguado and Leo P. Kouwenhoven, Phys. Rev. Lett. 84, 1986 (2000).
- (4) E. Buks, R. Schuster, M. Heiblum, D. Mahalu, and V. Umansky, Nature 391, 871 (1998).
- (5) G. Cao, M. Xiao, H. O. Li, C. Zhou, R. N. Shang, T. Tu, G. C. Guo, G. P. Guo, and H. W. Jiang, arXiv:1109.5734v2 (2011).
- (6) HaiOu Li, Ming Xiao, Gang Cao, Cheng Zhou, RuNan Shang, Tao Tu, GuangCan Guo, GuoPing Guo, and HongWen Jiang, arXiv:1108.4302v3 (2011).
- (7) J. I. Cliente, A. Bertoni, G. GOldoni, M. Rontani, and E. Molinari, Phy. Rev. B 75, 081303(R) (2007).
- (8) J. R. Petta, H. Lu, A. C. Gossard, Science 327, 669 (2010).