THE ROLE OF GALAXY INTERACTION IN ENVIRONMENTAL DEPENDENCE OF THE STAR FORMATION ACTIVITY AT
Abstract
In order to understand environmental effects on star formation in high-redshift galaxies, we investigate the physical relationships between the star formation activity, stellar mass, and environment for galaxies in the 2 deg2 COSMOS field∗. We estimate star formation using the [O ii] emission line and environment from the local galaxy density. Our analysis shows that for massive galaxies (), the fraction of [O ii] emitters in high-density environments () is times higher than in low-density environments (), while the [O ii] emitter fraction does not depend on environment for low-mass galaxies. In order to understand what drives these trends, we investigate the role of companion galaxies in our sample. We find that the fraction of [O ii] emitters in galaxies with companions is times as high as that in galaxies without companions at . In addition, massive galaxies are more likely to have companions in high-density environments. However, although the number of star forming galaxies increases for massive galaxies with close companions and in dense environments, the average star formation rate of star forming galaxies at a given mass is independent of environment and the presence/absence of a close companion. These results suggest that interactions and/or mergers in high-density environment could induce star formation in massive galaxies at , increasing the fraction of star-forming galaxies with .
Subject headings:
galaxies: evolution – galaxies: formation – galaxies: high-redshift – galaxies: interactions1. INTRODUCTION
A key question in understanding the formation and evolution of galaxies is to find what physical parameters are most sensitive to the star formation process in galaxies; e.g., how the star formation activity depends on the environment, and how the relation between star formation and environment changes during the course of galaxy evolution over 10 Gyrs. Observational properties of galaxies in the local universe have been extensively studied in the past. Typically, actively star-forming galaxies in the local universe have lower masses than passive galaxies and the most massive galaxies tend to be inactive for star formation (so-called mass-downsizing; Cowie et al. 1996). In addition, the star formation activity strongly depends on environment: star formation rate (SFR) decreases with increasing galaxy density (e.g., Lewis et al. 2002; Gomez et al.2003; Kauffmann et al. 2004; Mahajan et al. 2010) and the fraction of star-forming galaxies also decreases with increasing galaxy density (e.g., Carter et al. 2001; Balogh et al. 2004; Mateus & Sodré 2004). The fraction of early-type (passive) galaxies is higher in higher-density regions while the fraction of late-type (star-forming) ones is lower in such environment, called the “morphology-density relation” and consistent with the above results (e.g., Dressler 1980; Dressler et al. 1997; Goto et al. 2003; Capak et al. 2007). These findings indicate that the star formation activity in galaxies is strongly related to both the stellar mass and their environment.
On the other hand, it is well known that the star formation rate density (SFRD) steeply increases in the first Gyrs, peaks at , and then decreases by an order of magnitude toward the present day (e.g., Madau et al.1996; Lilly et al. 1996; Shioya et al. 2008; Bouwens et al. 2009). These results suggest that the redshift range of is the key epoch for the most active cosmic star formation in the history of universe. Therefore, studies of galaxies at are important for understanding galaxy evolution. In recent years, wide and deep surveys have allowed us to study star formation activity in galaxies. For example, Elbaz et al. (2007) and Cooper et al. (2008) studied the relation between the star formation rate (SFR) in galaxies and the environment at , in the Great Observatories Origins Deep Survey (GOODS; Giavalisco et al. 2004) and the DEEP2 Galaxy Redshift Survey (DEEP2; Davis et al. 2003). These studies showed that the average star formation rate increases with increasing galaxy density (Elbaz et al. 2007; Cooper et al. 2008). We also investigated the relation between the fraction of star-forming galaxies with [O ii] emission (hereafter “[O ii] emitters”) and the local galaxy density at in the Cosmic Evolution Survey (COSMOS; Scoville et al. 2007a; Koekemoer et al. 2007) and found that the fraction of star-forming galaxies in high-density regions is as high as that in low-density regions (Ideue et al. 2009; hereafter “Paper i”). Similar trends were also reported by other observational studies in groups of galaxies (Iovino et al. 2010; Li et al. 2011; Sobral et al. 2011) and cluster environments (Hayashi et al. 2010; Hilton et al. 2010) at . Since the fraction of star-forming galaxies decreases with increasing galaxy density in the local universe as mentioned above, these results suggest that the relationship between the star formation activity in galaxies and their environment dramatically changed from to the present day. On the other hand, many studies suggest that the star formation activity or the fraction of star-forming galaxies also strongly depends on stellar mass even at (e.g., Noeske et al. 2007; Elbaz et al. 2007; Ilbert et al. 2010). Therefore, it is important to investigate the relationships between the star formation activity, the stellar mass of galaxies, and the environment at , in order to reveal the origin of the observed difference in the environmental dependence of the star formation activity between and .
In this paper, we focus on the relationships between the star formation, stellar mass, and environment of galaxies at in the COSMOS field. We have already carried out Subaru imaging observations of the COSMOS field (Taniguchi et al. 2007). We can obtain the sample of [O ii] emitters in the COSMOS field by using a narrowband filter NB816 ( Å and Å, see Takahashi et al. 2007) and estimate their SFR by using the [O ii] luminosity. The [O ii] emission line provides a good estimator of the star formation in galaxies at intermediate redshift (e.g., Kennicutt 1998; Jansen et al. 2001). The stellar mass in galaxies in the COSMOS field was obtained from the fitting of their spectral energy distributions (SEDs; Ilbert et al. 2010). Thanks to the very large survey area ( 2 deg2) of the COSMOS field, we are able to obtain an unbiased picture of the star formation activity in galaxies, avoiding the cosmic variance effect. Indeed, the COSMOS field includes various regions with a wide range of galaxy density (e.g., Scoville et al. 2007a, 2007b; Takahashi et al. 2007), which enables us to investigate systematically the environmental effects on galaxy properties.
This paper is organized as follows. In section 2, we describe the sample selection and possible contamination of the [O ii] emitter sample. Descriptions of the measurements of local galaxy density, stellar mass, and SFR are presented in section 3. We investigate the dependence of star formation on environment and stellar mass, and the effect of close companions on the star formation activity, for our sample at in section 4. In section 5, we summarize our findings and discuss implications of our results on the evolution of galaxies from to . Throughout this paper, magnitudes are given in the AB system. We adopt a flat universe with the following cosmological parameters; , , and .
2. THE SAMPLE
2.1. Catalog
The COSMOS field has multi-wavelength photometric data over an area of 2 deg2 from X-ray to radio. We use the COSMOS intermediate- and broad-band photometry catalog which includes 16 broad, 12 intermediate, and 2 narrow bands (Capak et al. 2011, in preparation: hereafter “the COSMOS photometric catalog”). We also use the photometric redshift catalog (Ilbert et al. 2009: hereafter “the COSMOS photo- catalog”) which includes 937013 objects whose total magnitudes (Subaru or CFHT ) are brighter than 26 mag. Photometric redshifts in COSMOS are computed using the 25 optical bands, plus 2 GALEX and 4 Spitzer/IRAC bands (Ilbert et al. 2009, see also Section 3.2).
2.2. Sample Selection
In order to select [O ii] emitters at , we use the photometric data of , , and bands taken on the Subaru Telescope and those of -band taken on the Canada France Hawaii Telescope in the COSMOS photometric catalog (Capak et al. 2011, in preparation). We also use the photometric redshifts from the COSMOS photo- catalog (Ilbert et al. 2009).
Using the -band photometric data, Takahashi et al. (2007) extracted a sample of [O ii] emitters at . Here we additionally extract a sample of non-[O ii]-detected galaxies in the same redshift range. Since fainter galaxies have larger photo- errors, we select only galaxies with , for which the photo- error is at . Consequently, we obtain 1654 -selected galaxies with .
Among the 1654 galaxies, we select galaxies satisfying the following criteria as [O ii] emitters:
| (1) |
where
| (2) |
and
| (3) |
Note that corresponds to Å in the rest frame, where is the matched continuum for the central wavelength of NB816 filter (see Takahashi et al. 2007).
We obtain 932 [O ii] emitters among the photo- selected galaxies with . The remaining 722 objects are galaxies without a significant narrow-band excess by the [O ii] emission line; their rest-frame [O ii] emission equivalent width is Å and we designate them “non-[O ii] emitters” in this paper.
2.3. Contamination and Incompleteness due to Photometric Redshift Errors
As mentioned in the previous section, we selected our photo- sample and [O ii] emitters at using the photometric redshift and eq (1). Although the contamination is thought to be small due to the fairly accurate photo- (Ilbert et al. 2009), we examine how our photo- samples are contaminated by foreground or background objects, using spectroscopic redshifts (spec-) from the zCOSMOS redshift catalog (Lilly et al. 2007; Lilly et al. in prep). The spec- is available for 48 [O ii] emitters and 37 non-[O ii] emitters in our photo- sample. Among these objects, 44 [O ii] emitters and 24 non-[O ii] emitters have spec- within our target redshift range, , while the remaining objects have or . This means that the contamination rates for the [O ii] emitter and non-[O ii] emitter samples are (4/48) and (13/37), respectively. Thus, the contamination rate for our photo- sample (932 [O ii] emitters 722 non-[O ii] emitters) is expected to be .
We also estimate the incompleteness of our photo- sample, using 90 objects with and . Only 69 objects among them have , and so the incompleteness is (21/90). In order to investigate how incomplete our [O ii] emitter and non-[O ii] emitter samples are, we divided the 90 objects with and into the narrow-band excess objects and the others, using eq. (1). As a result, 47 objects are narrow-band excess objects, and the other 43 objects do not show a significant narrow-band excess. All of the 47 narrow-band excess objects with have and are selected as [O ii] emitters, suggesting that photometric redshifts are nearly complete for the [O ii] emitters. On the other hand, 22 out of 43 objects without a significant narrow-band excess have . Thus the incompleteness rates for the [O ii] emitter and non-[O ii] emitter samples are estimated to be (0/47) and (21/43), respectively.
In summary, the contamination and incompleteness rates for our photo- sample are . To keep the uniformity of photo- selected sample, we neither exclude the contamination nor add the missed objects into our sample, using the spectroscopic information. We will discuss how the contamination and incompleteness due to the photometric redshift errors for our photo- and [O ii] emitter samples affect our results in Section 4.
2.4. AGN Contamination in [O ii] Emitter Sample
Since active galactic nuclei (AGNs) also show emission lines including [O ii] in general, we have to consider the contribution of such AGNs in our analysis. Here we try to estimate possible AGN contamination in our [O ii] emitter sample by taking account of the difference of SEDs between AGNs and star-forming galaxies.
Stern et al. (2005) found that AGNs can be distinguished from star-forming galaxies using a vs. color-color diagram. While the ultraviolet to mid-infrared (m) continuum of star-forming galaxies is the composite stellar black body, an AGN continuum is well fit by a power law. Accordingly the infrared SED of AGNs tends to be systematically redder than star-forming galaxies. Although Stern et al. (2005) defined the AGN selection criteria for objects at , some star-forming galaxies at could be misidentified as AGNs by their criteria. In order to avoid this situation, we have newly defined our own AGN criteria for objects at examining Figures 2 and 3 in Stern et al. (2005). Our criteria are and , which are derived from the four IRAC bands (3.6, 4.5, 5.8, and 8.0 m) in the COSMOS photometric catalog.
We apply these criteria for the 587 [O ii] emitters detected in all the IRAC bands, and then find that 21 objects are identified as AGN candidates. Of the 345 objects without detection in all four IRAC bands, 244 are detected in both 3.6 and 4.5 m. For these we are able to examine AGN candidates only by using the color and ; see Figure 1 in Stern et al. (2005). We find find that 18 of the 244 galaxies are identified as AGNs by this criterion. Thus, the total number of the AGN candidates in our [O ii] emitter sample is 39, giving the possible AGN contamination rate of 4.7%.
It is noted, however, that our mid-infrared color criteria described above may not be useful in identification of LINERs that are also popular [O ii] emitters in the local universe. For such cases, we are able to use optical colors to estimate the contamination from LINERs since host galaxies of LINERs tend to show red optical colors. For example, Yan et al. (2006) found that most [O ii] emitters with red optical colors tend to have the LINER activity rather than star formation. Lemaux et al. (2010) also found that most of [O ii] emitters on the so-called red sequence at are identified as either LINERs or Seyferts. In order to examine the contamination from LINERs in our [O ii] emitter sample, we investigate the SED of the [O ii] emitters and found that almost all galaxies show blue colors, being comparable to those of starburst or local Sd – Sdm-type galaxies. Therefore, we conclude that the contamination from LINERs is negligibly small in our sample.
Thus the possible fraction of AGN in our [O ii] emitters is %. This is roughly consistent with the result of Garn et al. (2010) who studied the star formation activity in galaxies at using a sample of emitters and found that the AGN fraction is 5-11%.
Because the AGN contamination is negligibly small, we do not exclude the AGN candidates from the [O ii] emitter sample in the following analysis. However we additionally performed the same analysis given in Section 4 for the sample without the AGN candidates and found the same results, confirming that the contamination from AGNs is negligibly small.
3. MEASUREMENT OF LOCAL DENSITY, STELLAR MASS, SFR
3.1. Local Galaxy Density
In order to investigate the relation between the star formation activity in galaxies and their environment, we quantify the environment from the observational data. We adopt the projected th-nearest-neighbor surface density since this density has been often used as an indicator of the galaxy environment in a number of previous investigators (e.g., Dressler 1980; Postman et al. 2005). It is also noted that such projected density measurements based on photo- are useful in detecting the so-called large-scale structures and reconstructing the overdensity (Scoville et al. 2007b).
To be consistent with previous studies (e.g., Dressler 1980; Capak et al. 2007; Feruglio et al. 2010), we use the 10th nearest neighbor in our analysis. The local galaxy density is calculated by using the projected proper distance to the 10th nearest neighbor ( in Mpc) as
| (4) |
We compute the projected densities for our sample galaxies using the COSMOS photo- catalog. We use a redshift slice centered on each sample galaxy with a width of ( for ; Ilbert et al. 2009). Note that we use only galaxies with in a given redshift slice to secure the photo- accuracy in the estimate of the projected densities. For 204 galaxies near the edge of our survey field, the is greater than the distance from the object to the field edge. We do not use them in the later analysis, since we cannot estimate their local galaxy densities accurately.
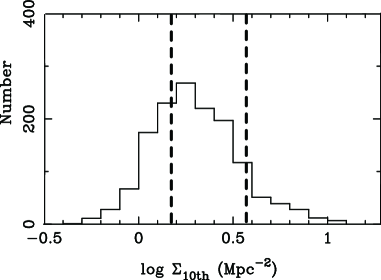
In Figure 1, we show the distribution of the local galaxy density for our photo- selected sample. The local galaxy density for our sample galaxies ranges over . In order to investigate environmental effects on star formation in section 4, we define three environment bins: low-density (), intermediate (), and high-density (). The number of galaxies in each environment bin is 464, 820, and 162 for the low-, intermediate-, and high-density environment, respectively. We note that the intermediate-density environment includes the mean local galaxy density in our sample ().
3.2. Stellar Mass and Star Formation Rate
In this study, we use stellar mass estimates which come from SED fitting by Ilbert et al. (2010). The COSMOS 31 photometric-band data (including the IRAC mid-infrared data) are fit with stellar population synthesis models (Bruzual and Charlot 2003), assuming a Chabrier (2003) IMF and exponentially declining star formation histories (see Ilbert et al. 2010 for details).
To estimate the SFR, we use the [O ii] emission-line luminosity. We measure the [O ii] luminosity from the line flux which is estimated by using the flux densities in , , and as adopted in Takahashi et al. (2007), given by
| (5) |
where and are the effective bandwidth of the NB816 and filters, respectively. The [O ii] luminosity is estimated from the line flux by . In this procedure, we assume that all the [O ii] emitters are located at , the redshift corresponding to the central wavelength of NB816 filter, setting the luminosity distance as Mpc.
We then apply an extinction correction to the [O ii] luminosity of each object. Previous studies have generally assumed , which is estimated from observations of local star-forming galaxies (Kennicutt 1983; Kennicutt 1998; Hopkins 2004). However, Gilbank et al (2010; hereafter G10) found that there is a stellar-mass dependence of the dust extinction of nebula emission lines, with overestimating the line luminosity for low-mass galaxies and underestimating it for high-mass galaxies. This effect should be taken into account in the estimate of SFR, since we investigate the dependence of SFR on stellar mass in this study. We calculate for each [O ii] emitter using the relation between and stellar mass obtained by G10:
| (6) |
| (7) |
Note, however, that we adopt
| (8) |
because estimated from eq. (9) in G10 seems to overestimate at (see Figure 4 in G10). We derive from using the Galactic extinction curve (Cardelli et al. 1989). The extinction-corrected [O ii] luminosity is given by
| (9) |
We estimate the SFR from the [O ii] luminosity using the Kennicutt (1998) relation:
| (10) |
In the following analysis, we use 1446 galaxies (824 [O ii] emitters and 622 non-[O ii] emitters) with for which the local galaxy density is available. A summary of all galaxy samples used in our analysis is given in Table 1.
| All samples | [O ii] emitters | non-[O ii] emitters | |||||||||
|---|---|---|---|---|---|---|---|---|---|---|---|
| Low | Intermediate | High | Low | Intermediate | High | Low | Intermediate | High | |||
| 8 – 8.5 | 0 | 4 | 0 | 0 | 3 | 0 | 0 | 1 | 0 | ||
| 8.5 – 9 | 19 | 30 | 9 | 13 | 20 | 8 | 6 | 10 | 1 | ||
| 9 – 9.5 | 103 | 172 | 24 | 97 | 155 | 23 | 6 | 17 | 1 | ||
| 9.5 – 10 | 147 | 281 | 50 | 110 | 228 | 39 | 37 | 53 | 11 | ||
| 10 – 10.5 | 82 | 139 | 48 | 33 | 55 | 23 | 49 | 84 | 25 | ||
| 10.5 – 11 | 80 | 141 | 24 | 5 | 5 | 4 | 75 | 136 | 20 | ||
| 11 – 11.5 | 32 | 51 | 7 | 1 | 2 | 0 | 31 | 49 | 7 | ||
| 11.5 – 12 | 1 | 2 | 0 | 0 | 0 | 0 | 1 | 2 | 0 | ||
| Total | 464 | 820 | 162 | 259 | 468 | 97 | 205 | 352 | 65 | ||
4. RESULTS
4.1. The relations between star formation, stellar mass, and environment
In this section, we study the relations between star formation, stellar mass, and environment. In Figure 2, we show the fraction of the [O ii] emitters in the photo- selected sample (hereafter, “[O ii] fraction”) as a function of stellar mass for the three different environments. In all environments, the [O ii] fraction decreases with increasing stellar mass, indicating that most low-mass galaxies are star-forming while non-star-forming galaxies dominate at high mass. This suggests that mass-downsizing is already in place at . Several studies have reported similar results for galaxies at (Iovino et al. 2010; Sobral et al. 2011).
Next we focus on the environmental dependence of the [O ii] fraction. While there is no environmental dependence of the [O ii] fraction in low-mass bins (), the [O ii] fraction in the high-density environment is a little higher than that in the intermediate- and low-density environments in high-mass bins (), although the uncertainty for the high-density environment is relatively large due to the small number statistics. We estimate the [O ii] fraction in the high- and low-density environment for massive galaxies (). We then find the [O ii] fraction in the high-density environment is times higher than that in the low-density environment. This may indicate that the star formation activity in relatively massive galaxies is enhanced in high-density regions.
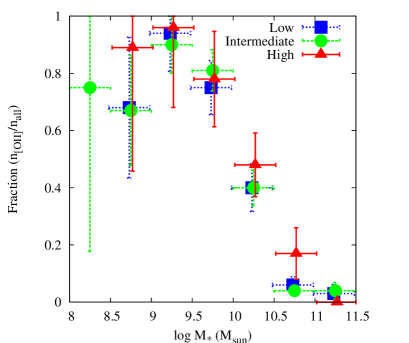
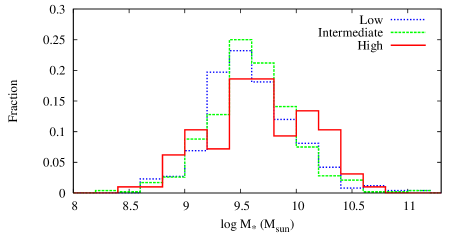
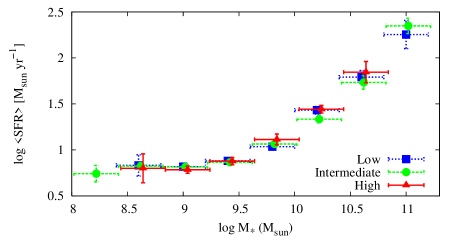
Figure 3 shows the distribution of stellar mass for the [O ii] emitters in the three different environments. The distribution for [O ii] emitters in the high-density environment appears to be slightly skewed toward high mass, compared with those for the lower-density environments. We estimate the fraction of high-mass galaxies () in the [O ii] emitter sample for the low-, intermediate-, and high-density environments are 15%, 13%, and 28%, respectively. Indeed, the fraction of high-mass [O ii] emitters in the high-density environment is more than twice as high as the low-, and intermediate-density environments. We apply the Kolmogorov-Smirnov (K-S) test to the distribution of stellar mass for the low- and high-density environments. The K-S test gives a probability of the two distributions being drawn from the same parent distribution. This seems to be consistent with the above result: the fraction of [O ii] emitters with is highest in the high-density environment because the shape of the stellar mass function for all of our photo- selected galaxies is similar among the different environments over .
We investigate the average SFR as a function of stellar mass for [O ii] emitters in the three environments (Figure 4). The linear fit gives the following relations: for the low-density environment, for the intermediate-density environment, and for the high-density environment. These results show the average SFR strongly correlates with the stellar mass, consistent with the results in previous studies (e.g., Elbaz et al. 2007; Daddi et al. 2007). We also find that the relation between SFR and stellar mass in our star-forming galaxies does not depend on environment. These results imply that there is no environmental effect on the strength of star formation activity in star-forming galaxies, although environment does affect the fraction of star-forming galaxies among the total population (perhaps switching and quenching star formation).
4.2. Role of interactions and/or mergers
In Paper i, we found that the fraction of galaxies with a close companion increases with increasing local galaxy density. Since galaxy interactions and mergers can trigger starbursts in galaxies (e.g., Mihos & Hernquist 1996; Taniguchi & Wada 1996), we suggested that the high fraction of [O ii] emitters in high-density regions may be driven by interactions and/or mergers. On the other hand, in the previous section, we found that the [O ii] fraction in the high-density environment is higher only for high mass () galaxies, while there is no evidence for environmental dependence at . Here we study the effects of the interactions and/or mergers on the star formation activity and its environmental dependence as a function of stellar mass.
Following Paper i, we define a galaxy with a close companion as a system with a nearest neighbor within an projected separation of less than 10 arcsec, corresponding to kpc in proper distance at . We use galaxies with within a redshift slice of to search for nearest neighbors, as in the estimate of the local galaxy density (Section 3.1). This redshift slice corresponds to a maximal velocity difference of km s-1. Using this definition, we identify 222 galaxies with a close companion from the 1446 photo- selected galaxies. The other galaxies do not have a close companion. We call hereafter these galaxies “non-companion galaxies”.
The 71% of the galaxies with a close companion are [O ii] emitters. The numbers of companion galaxies for each environment and stellar mass are summarized in Table 2. Note that these galaxies may not always be interacting, since the maximum velocity difference of km s-1 is large for interactions or/and mergers. We calculate the probability of chance alignment from the average number density of galaxies and the search area with a radius of 80kpc. The probability of chance alignment is 0.05 in the full sample and 0.02, 0.05, and 0.12 for the low-, intermediate-, high-density environments, respectively. Although the probability of chance alignment is relatively small, we take this effect into account in the following analysis.
| All samples | [O ii] emitters | non-[O ii] emitters | |||||||||
|---|---|---|---|---|---|---|---|---|---|---|---|
| Low | Intermediate | High | Low | Intermediate | High | Low | Intermediate | High | |||
| 8 – 8.5 | 0 | 0 | 0 | 0 | 0 | 0 | 0 | 0 | 0 | ||
| 8.5 – 9 | 2 | 1 | 3 | 1 | 1 | 3 | 1 | 0 | 0 | ||
| 9 – 9.5 | 19 | 24 | 4 | 17 | 23 | 4 | 2 | 1 | 0 | ||
| 9.5 – 10 | 21 | 56 | 13 | 17 | 47 | 11 | 4 | 9 | 2 | ||
| 10 – 10.5 | 8 | 28 | 14 | 6 | 13 | 8 | 2 | 15 | 6 | ||
| 10.5 – 11 | 5 | 15 | 3 | 1 | 2 | 2 | 4 | 13 | 1 | ||
| 11 – 11.5 | 2 | 4 | 0 | 0 | 2 | 0 | 2 | 2 | 0 | ||
| 11.5 – 12 | 0 | 0 | 0 | 0 | 0 | 0 | 0 | 0 | 0 | ||
| Total | 57 | 128 | 37 | 42 | 88 | 28 | 15 | 40 | 9 | ||
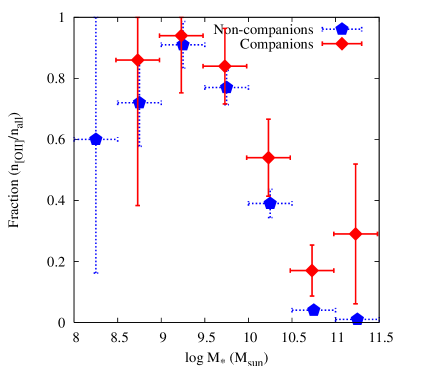
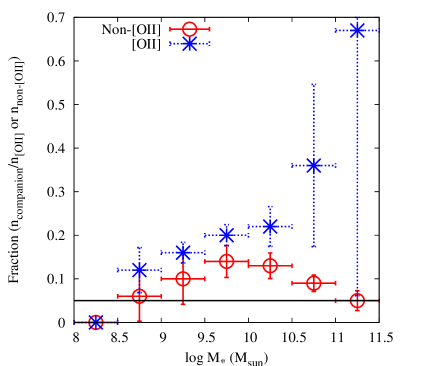
In Figure 5, we show the [O ii] fraction as a function of stellar mass for the galaxies with and without a companion. While the [O ii] fractions for these two samples are similar within the error bars at low mass (), the [O ii] fraction for the “with companion” sample is times higher than that for the “without companion” sample at . The difference in [O ii] emitter fractions between the two samples appears to increase with increasing stellar mass. Figure 6 shows the relation between the fraction of galaxies with a companion (hereafter “companion fraction”) and stellar mass for [O ii] and non-[O ii] emitters in all the environments. The horizontal line represents the expected contribution of the chance alignment. The companion fraction for [O ii] emitters is higher than that for non-[O ii] emitters and the probability of the chance alignment. It is also seen that the companion fraction for [O ii] emitters increases with increasing stellar mass, while the fraction for non-[O ii] emitters does not. Indeed, it is estimated that the companion fraction for [O ii] emitters at high mass () is times higher than that at low mass () and that for non-[O ii] emitters at high mass is only times that at low mass. Moreover, at high mass, the companion fraction for [O ii] emitters is times higher than that for non-[O ii] emitters, while that for [O ii] emitters is only times that for non-[O ii] emitters at low mass. These results suggest that the star formation activity may be induced by interactions and/or mergers more preferentially in high-mass galaxies.
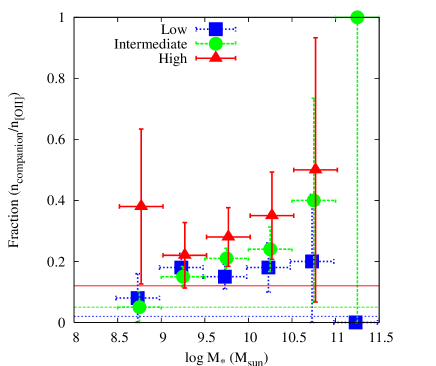
In order to understand the relation between this result and the environmental dependence of the star formation activity, we also investigate the companion fraction in [O ii] emitters as a function of stellar mass in the three different environments (Figure 7). The horizontal lines in the figure represent the probability of the chance alignment for the three environments. It is seen that the companion fraction tends to be higher in the higher-density environment, especially at high stellar mass, although there is the large uncertainty due to the small number statistics. The companion fractions at in the low-, intermediate-, and high-density environment are estimated to be , , and , respectively. Although the probability of the chance alignment also tends to be higher in the higher-density environment, the environmental dependence of the companion fraction at high mass () appears to remain even if we subtract the contribution of chance alignment. We also find that the companion fraction for [O ii] emitters in the high- and intermediate environments increases with increasing stellar mass. The plots of Figure 7 are fit with the following relations: for the low-density environment, for the intermediate-density environment, and for the high-density environment. Although the uncertainty for the high-density environment is relatively large due to the small number statistics, the correlation between the companion fraction and the stellar mass for the intermediate-density environment is evident. Thus the star formation in massive [O ii] emitters in higher-density environment may be preferentially triggered by interactions and/or mergers.
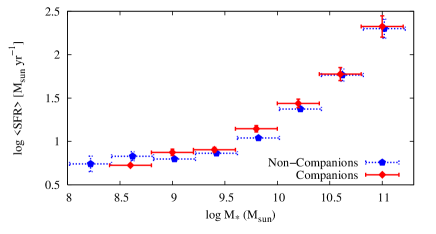
Figure 8 shows the average SFR of [O ii] emitters with and without a companion as a function of stellar mass. We then apply a linear fit to obtain the relation for the [O ii] emitters with and without a companion: and , respectively. We find that there is no significant difference between the companion and non-companion samples. Since the [O ii] fraction for high-mass galaxies depends on the presence of a close companion as seen above, these results imply that galaxy interaction does not affect SFR in star-forming galaxies but can trigger a larger number of high-mass galaxies to become star forming at all.
4.3. Effects of the Contamination and Incompleteness in the Sample
Here we consider the effects of sample contamination and incompleteness on the results shown in the previous two sections. As mentioned in Section 2.3, the estimated photo- contamination and incompleteness is . Since it is unlikely that the fraction of contamination or incompleteness depends strongly on the local number density of galaxies, it is expected that the contamination and incompleteness could not significantly change the estimation of local galaxy density (although contamination could slightly smear out the density contrast).
The contamination and incompleteness rates are different between the [O ii] emitter and non-[O ii] emitter samples; the contamination rates for the [O ii] emitter sample and for the non-[O ii] emitter sample are estimated as and , and the incompleteness rates for the [O ii] emitter sample and for the non-[O ii] emitter sample are and , respectively. Since these difference may affect our results, in the following we discuss their possible effects in detail.
First, we consider possible effects on the [O ii] fraction due to contamination and incompleteness. From the contamination and incompleteness rates for the [O ii] emitter and non-[O ii] emitter samples, we naively expect that the number of [O ii] emitters is overestimated by ; i.e., . The number of all photo- selected galaxies (824 [O ii] emitters 622 non-[O ii] emitters) is underestimated by ; i.e., . Thus we may overestimate the overall [O ii] fraction by ; i.e., . In order to investigate effects on the mass and environmental dependence of the [O ii] fraction, we check the stellar mass and environment of the contaminant and missed objects with spectroscopic identification. We find that those galaxies for the [O ii] emitter sample and for the non-[O ii] emitter sample have stellar mass ranges of and , respectively, and exist in various environments (although they are rarer in high-density environments). Thus contamination and incompleteness affect all masses and environments evenly, and so they do not significantly affect the mass and environmental dependence of the [O ii] fraction seen in Figure 2. Since the contamination and incompleteness for [O ii] emitters are small and do not depend on environment, the stellar mass distribution and the average SFR at a given mass for these galaxies in the different environments (Figures 3 and 4) are also not significantly affected.
Next, we consider effects on the results regarding companions. Since the incompleteness is expected to be independent of the presence or absence of a close companion, the missed objects do not affect the companion fraction. Similarly the contamination from different redshifts is not correlated with the spatial distribution of galaxies at . Therefore the probability of the contamination form chance alignment is expected to be roughly the probability of the chance alignment calculated in Section 4.2 (). When the companion fraction is much higher than the probability of the chance alignment, the large contamination could lower the companion fraction. However, high companion fractions are seen for [O ii] emitters at high mass in Figure 6. Since the contamination for [O ii] emitters is small (), it does not significantly affect the companion fraction. On the other hand, the contamination rate is for the non-[O ii] emitters, but the companion fraction for those galaxies is not much higher than the probability of the chance alignment (Figure 6). Then the effect of the contamination on the companion fraction in the non-[O ii] emitter sample also seems to be insignificant, although the companion fraction could be slightly underestimated.
We thus conclude that the contamination and incompleteness of the photo- sample do not affect significantly our results.
5. DISCUSSION
In this paper, we have investigated the relations between the star formation, stellar mass, and environment at in the COSMOS field. As shown in section 4, our results are different from the observational properties of galaxies in the local universe. Based on our observational results, we discuss possible origins of the difference between and from a viewpoint of the evolution of galaxies.
5.1. The Observational Properties of Galaxies at in the COSMOS Field
The findings of this study are summarized by the following:
-
1.
At , the fraction of [O ii] emitters in high-density environments is times as high as in low- and intermediate-density environments. The fraction of [O ii] emitters does not depend on environment at (Figure 2).
-
2.
The fraction of [O ii] emitters in galaxies with a companion (likely interacting galaxies) is times higher than that in those without a companion (likely isolated galaxies) over (Figure 5).
-
3.
The fraction of galaxies with a companion for the [O ii] emitters at high mass () is times higher than that at low mass (), while that for the non-[O ii] emitters at high mass is times that at low mass (Figure 6).
-
4.
The fraction of [O ii] emitters with a companion is higher in the higher-density environments (Figure 7). The fractions in the low-, intermediate-, and high-density environment at high mass () are , , and , respectively.
- 5.
From the first item described above, it is expected that high-mass [O ii] emitters contribute significantly to the active star formation in high-density regions at . Moreover, items 2, 3, and 4 suggest that interactions and/or mergers could trigger star formation in massive galaxies preferentially in high-density environments, while the star formation in low-mass galaxies appears to be independent of environment and does not seem to be affected by the interactions and/or mergers. In other words, ([O ii]) of some inactive high-mass galaxies may become higher due to the active star formation induced by galaxy interactions, and thus we observe such high-mass galaxies as [O ii] emitters. On the other hand, considering item 5, it appears that the strength of star formation activity in the star-forming galaxies is not influenced by environmental effects, although the environment and interactions affect the fraction of star-forming galaxies.
The environmental dependence of the [O ii] fraction is seen only at high mass. It is interesting to note that the influence of interactions and/or mergers on star formation depends both on environment and stellar mass. This can be interpreted such that massive galaxies need external triggers (i.e., interactions and/or mergers) for active star formation, while the less massive galaxies are form stars regardless of the presence of a close companion. One possible triggering mechanism for less massive galaxies is minor merger events (e.g., Taniguchi & Wada 1996). However, such satellite galaxies would be too faint to be detected in our imaging survey. As an another possible interpretation, it is expected that less massive galaxies contain much gas and can naturally form stars since evolution of those galaxies is slow compared to massive galaxies, which is expected from mass-downsizing (e.g., Cowie et al. 1996).
Therefore, we conclude that the environmental dependence of the [O ii] fraction (i.e., the fraction of star-forming galaxies) is seen only at high mass, because 1) interactions and/or mergers induce the star formation only in massive galaxies and 2) the probability of interactions and/or mergers depends on local galaxy density.
Peng et al. (2010, 2011) recently found that the environment quenching (or the satellite quenching) depends on the local galaxy density but not on the stellar mass of galaxies. We observe a different environmental effect from that found by Peng et al. (2010, 2011), since our results suggest that the influence of interaction and/or mergers depend on both environment and stellar mass.
5.2. Implications to the evolution of galaxies from to
In the local universe, it is observed that the fraction of red galaxies in high-density environments is higher than that in low-density environments, and this difference becomes larger at lower mass (e.g., Baldry et al. 2006). Namely, the fraction of blue galaxies in high-density environments is lower than that in low-density environments, especially at low mass. Iovino et al (2010) also found a similar trend at . Furthermore, they found that the fraction of blue galaxies at does not depend on the environment in . These are in contrast to the environmental dependence of the [O ii] fraction in massive galaxies at mentioned above.
Now a question arises: what is the origin of the difference between and ? Our results suggest that interactions and mergers are likely to induce star formation in massive galaxies in high-density environments at , resulting in the observed high [O ii] fraction of massive galaxies in high-density environments. These inactive massive galaxies where star formation would be induced by interactions are likely to have some cold gas for star formation. We have also found that the average SFR at a given mass is similar among the different environments and is independent of the presence of a close companion (Figures 4 and 8), the strength of the star formation induced by interactions in massive galaxies does not seem to be significantly different from other massive star-forming galaxies on average. Therefore we expect that there are already some inactive high-mass galaxies with sufficient cold gas for SFR at a given mass at . On the other hand, the fraction of gas-poor galaxies is higher in higher density regions at low- (e.g., Giovanelli & Haynes 1985; Bertram et al. 2006). Therefore it is unlikely that a significant starburst occurs in interactions or mergers between gas-poor galaxies (i.e., dry mergers; e.g., Tran et al. 2005; Cattaneo et al. 2008), even though interactions and/or mergers still occur in high-density regions at low- (e.g., Patton et al. 2011).
In this context, one important difference in galaxies between and low is the cold gaseous content. Since galaxies at are in early stages of their evolution, it is likely that their cold gaseous content is, on average, larger than that in galaxies at low even if such galaxies are located in relatively high-density regions. It is thus expected that interactions and mergers at could cause intense star formation more frequently since it is known that interactions and mergers between two gas-rich galaxies (wet mergers) can induce active star formation and rapidly consume the cold gas (e.g., Barton et al. 2000; Woods et al. 2006). In fact, Lin et al. (2008, 2010) suggest that the fraction of dry mergers gradually increases from to , while the fraction of wet mergers decreases at the redshift range.
If there are many inactive high-mass galaxies with sufficient cold gas for star formation at as mentioned above, there may be some mechanisms responsible for quenching star formation in galaxies while retaining their gas. For example, it might be expected that high-mass galaxies have experienced starbursts in the past, and then their gas becomes hot and their star formation stops in spite of the existence of the (hot) gas. Later the hot gas cools down into cold gas, and then high-mass galaxies actively form stars when interactions and/or mergers occur. As another scenario, high-mass galaxies might have consumed most of gas in the past, which is expected from the mass-downsizing of galaxy formation (e.g., Cowie et al. 1996), and the gas density was already too low to cause intense star formation (Kennicutt 1989). However, if interactions can sufficiently perturb the remaining gas, the star formation can be triggered and they can be observed as high-mass star-forming galaxies in high-density environment. In this case, such galaxies immediately consume their gas in the star formation and these massive galaxies in high-density environment are observed to be passive at .
From these considerations, we suggest the following scenario; The high-mass star-forming galaxies for which star formation are induced by interactions and/or mergers contribute significantly to the active star formation in high-density regions at . These massive star-forming galaxies in high-density regions at could quickly consume most of the accreted cold gas. If this is the case, the star formation activity may not be enhanced when interactions and/or mergers occurred in high-density environments at lower redshift. In this context, the quenching of star formation in massive galaxies in high density environments is expected to lead to the shift of major star formation in the universe from high-density regions to low-density ones at .
We would like to thank the anonymous referee for her/his very useful comments and suggestions. We also thank all members of the COSMOS team. This work was financially supported in part by the Japan Society for the Promotion of Science (Nos. 17253001, 19340046, 23244031, and 23654068). Y. I. is financially supported by the Japan Society for the Promotion of science (JSPS) through JSPS Research Fellowship for Young Scientists.
References
- (1) Baldry, I. K., et al. 2006, MNRAS, 373, 469
- (2) Balogh, M., et al. 2004, MNRAS, 348, 1355
- (3) Barton, E. J., Geller, M. J., & Kenyon, S. J. 2000, ApJ, 530, 660
- (4) Bertram, T., Eckart, A., Krips, M., Staguhn, J. G., & Jackenberg, W. 2006, A&A, 448, 29
- (5) Bouwens, R. J., et al. 2009, ApJ, 705, 936
- (6) Capak, P. L., Abraham, R. G., Ellis, R. S., Mobasher, B., Scoville, N. Z., Sheth, K., & Koekemoer, A. 2007, ApJS, 172, 284
- (7) Capak, P. L., et al. 2011, in preparation
- (8) Cardelli, J. A., Clayton, G. C., & Mathis, J. S. 1989, ApJ, 345, 245
- (9) Carter, B. J., Fabiricant, D. G., Geller, M. J., Kurtz, M. J., McLearn, B. 2001, ApJ, 559, 606
- (10) Cattaneo, A., Dekel, A., Faber, S. M., & Guiderdoni, B. 2008, MNRAS, 389, 567
- (11) Cooper, M. C., et al. 2008, MNRAS, 383, 1058
- (12) Cowie, L. L., Songaila A., Hu, E. M., & Cohen, J. G. 1996, AJ, 112, 839
- (13) Daddi, E., et al. 2007, ApJ, 670, 156
- (14) Davis, M., et al. 2003, Proc. SPIE, 4834, 161
- (15) Dressler, A. 1980, ApJ, 236, 351
- (16) Dressler, A., et al. 1997, ApJ, 490, 477
- (17) Elbaz, D., et al. 2007, A&A, 468, 33
- (18) Feruglio, C., et al. 2010, ApJ, 721, 607
- (19) Garn, T., et al. 2010, MNRAS, 402, 2017
- (20) Gilbank D. G., et al. 2010, MNRAS, 405, 2594
- (21) Giavalisco, M., et al. 2004, ApJ, 600, L93
- (22) Giovanelli & Haynes 1985, ApJ, 292, 404
- (23) Gomez, P. L., et al. 2003, ApJ, 584, 210
- (24) Goto, T., Yamauchi, C., Fujita, Y., Okamura, S., Sekiguchi, M., Smail, I., Bernardi, M., & Gomez, P. L. 2003, MNRAS, 346, 601
- (25) Gunn, J. E., & Gott, J. R. 1972, ApJ, 176, 1
- (26) Hayashi, M., et al. 2010, MNRAS, 402, 1980
- (27) Hilton, M., et al. 2010, ApJ, 718, 133
- (28) Hogg, D. W., Blanton, M. R., Eisenstein, D. J., et al. 2003, ApJ, 585, 5
- (29) Hopkins, A. M. 2004, ApJ, 615, 209
- (30) Ideue, Y., et al. 2009, ApJ, 700, 971
- (31) Ilbert, O., et al. 2009, ApJ, 690, 1236
- (32) Ilbert, O., et al. 2010, ApJ, 709, 644
- (33) Iovino, A., et al. 2010, A&A, 509, 40
- (34) Jansen, R. A., Franx, M., & Fabiricant, D. 2001, ApJ, 551, 825
- (35) Kauffmann, G., White, S. D. M., Heckman, T. M., Menard, B., Brinchmann, J., Charlot, S., Tremonti, C., & Brinkmann, J. 2004, MNRAS, 353, 713
- (36) Kennicutt, R. C. 1983, ApJ, 272, 54
- (37) Kennicutt, R. C. 1989, ApJ, 344, 685
- (38) Kennicutt, R. C. 1998, ARA&A, 36, 189
- (39) Koekemoer, A. M., et al. 2007, ApJS, 172, 196
- (40) Lemaux, B. C., Lubin, L. M., Sharpley A., Kocevski, D., Gal, R. R., & Squires, G. K. 2010, ApJ, 716, 970
- (41) Lewis, I., et al. 2002, MNRAS, 334, 673
- (42) Lilly, S., et al. 2007, ApJS, 172, 70
- (43) Lilly, S., et al. 2011, in preparation
- (44) Li, I. H., et al. 2011, MNRAS, MNRAS, 411, 1869
- (45) Lin, L., et al. 2008, ApJ, 681, 232
- (46) Lin, L., et al. 2010, ApJ, 718, 1158
- (47) Madau, P., Ferguson, H. C., Dickinson, M. E., Giavalisco, M., Steidel, C. C., & Fruchter, A. 1996, MNRAS, 283, 1388
- (48) Mahajan, S., Haines, C. P., & Raycaudhury, S. 2010, MNRAS, 404, 1745
- (49) Mateus, A., & Sodré, L. 2004, MNRAS, 349, 1251
- (50) Mihos, J. C., & Hernquist, L. 1996, ApJ, 464, 641
- (51) Patton, D. R., Ellison, S. L., Simard, L., McConnachie, A. W., & Mendel, T. J. 2011, MNRAS, 412, 591
- (52) Peng, Y.-J., et al. 2010, ApJ, 721, 193
- (53) Peng, Y.-J., Lilly, S. J., Renzini, A., & Marcella, C. 2011, ApJ, submitted [arXiv:1106.2546]
- (54) Scoville, N. Z., et al. 2007a, ApJS, 172, 1
- (55) Scoville, N. Z., et al. 2007b, ApJS, 172, 150
- (56) Shioya, Y., et al. 2008, ApJS, 175, 128
- (57) Sobral, D., Best, P. N., Smail, I., Geach, J. E., Cirasuolo, M., Garn, T., & Dalton, G. B. 2011, MNRAS, 411, 675
- (58) Stern, D., et al. 2005, ApJ, 631, 163
- (59) Takahashi, M. I., et al. 2007, ApJS, 172, 456
- (60) Taniguchi, Y., et al. 2007, ApJS, 172, 9
- (61) Taniguchi, Y., & Wada, K. 1996, ApJ, 469, 58
- (62) Thomas, D., Maraston, C., Schiawinski, K., Sarzi, M., & Silk, J. 2010, MNRAS, 404, 1775
- (63) Tran, K.-V. H., et al. 2005, ApJ, 627, L25
- (64) Woods, D. F., Geller, M. J., & Barton, E. J. 2006, AJ, 132, 197
- (65) Yan, R., Newman J. A., Faber S. M., Konidaris., Koo D., & Davis M. 2006, ApJ, 648, 281