Evidence for inhomogeneous reionization in the local Universe from metal-poor globular cluster systems
Abstract
Exploiting a fundamental characteristic of galaxy assembly in the CDM paradigm, the observed spatial biasing and kinematics of metal-poor globular star clusters are used to constrain the local reionization epoch around individual galaxies. Selecting three galaxies located in different environments, the first attempt at constraining the environmental propagation of reionization in the local Universe is carried out. The joint constraint from the three galaxies () agrees remarkably well with the latest WMAP constraint on for a simple instantaneous reionization model. More importantly, the range of values found here are consistent with the global range of estimates from other observations. We furthermore find a indication that reionization completed in low-density environments before the intergalactic medium in high-density environments was reionized. This is consistent with certain theoretical models that predict that reionization was globally prolonged in duration, with neutral hydrogen pockets surviving in high-density environments, even after the surrounding regions were reionized. More generally, this work provides a useful constraint on the formation history of galaxy stellar halos.
keywords:
dark ages, reionization, first stars — galaxies: star clusters: general — galaxies: haloes — galaxies: kinematics and dynamics — galaxies: individual NGC 1407, Messier 87, Milky Way.1 Introduction
Reionization marks the phase change of the Universe’s intergalactic hydrogen gas from a neutral to an ionized state. Though the general reionization picture follows from the fundamentals of Big Bang cosmology (Barkana & Loeb, 2001), a detailed timeline of how it propagated throughout the Universe is difficult to constrain because most of the direct observational signatures of this event are billion light years distant from Earth.
Despite this challenge, observations show that the intergalactic medium was reionized no later than a redshift of , not before and completed on a timescale of at least (Fan et al., 2006; Ouchi et al., 2010; Robertson et al., 2010; Bolton et al., 2010; Bowman & Rogers, 2010; Larson et al., 2011). Though the dominant ionizing source contributing to reionization is still an open question, there is general agreement that the ionizing sources first appeared in high-density environments (Dijkstra et al., 2004; Fan et al., 2006; Lidz et al., 2007; Wise & Abel, 2008; Power et al., 2009; Baek et al., 2010; Bunker et al., 2010; Robertson et al., 2010; Srbinovsky & Wyithe, 2010; Willott et al., 2010; Yan et al., 2010; Bouwens et al., 2011; Dopita et al., 2011; Lorenzoni et al., 2011; Mitra et al., 2011, 2012).
A key piece of information that is not yet constrained is the environmental propagation of reionization: did reionization complete in dense environments first or were low-density voids the first locations to ionize? While high-density environments of the Universe probably had a “head-start” and thus contained more ionizing sources, the same locations were also more likely to be shielded by dense clouds of dust and neutral hydrogen (HI) gas. Furthermore, if the sources were predominately small galaxies, the UV background would have been more uniformly distributed than if the ionizing sources were typically active galaxy nuclei of rare, massive proto-galaxies. Also, unlike ultraviolet radiation, X-rays produced by gas accretion onto black holes can escape local gas and dust absorption and “pre-heat” gas in lower-density regions (e.g. Baek et al., 2010). Indeed, large-scale radiative transfer models show that the ionizing front can travel vast distances, from massive galaxies in dense regions to low-density locales (e.g. Weinmann et al., 2007; Finlator et al., 2009; Iliev et al., 2011). Understanding how reionization propagated through various environments will help constrain the properties of the ionizing sources and the state of the intergalactic medium during the reionization epoch.
One possible surviving relic of the reionization epoch may be the bimodal distribution of globular star clusters within large galaxies (Forbes et al., 1997; van den Bergh, 2001; Beasley et al., 2002; Santos, 2003; Rhode et al., 2005, 2007, 2010; Moore et al., 2006; Bekki, 2005; Bekki et al., 2008; Griffen et al., 2010): systems of globular clusters show two distinct metallicity subpopulations (Zinn, 1985; Gebhardt & Kissler-Patig, 1999; Neilsen & Tsvetanov, 1999; Larsen et al., 2001; Kundu & Whitmore, 2001; Peng et al., 2006; Strader et al., 2006, 2007; Kundu & Zepf, 2007; Spitler et al., 2008a). The subpopulations include the “metal-poor” globular clusters (MPGCs) with typical metallicities a few percent of Solar metallicity and the “metal-rich” globular clusters (MRGCs) with metallicities Solar.
Various theoretical works have invoked reionization as a way to produce the bimodal metallicity distribution in GC systems (e.g. Beasley et al., 2002; Santos, 2003; Bekki, 2005; Moore et al., 2006; Bekki et al., 2008; Griffen et al., 2010). More specifically, these studies explored models where MPGCs form within small () dark matter halos at (Bromm & Clarke, 2002; Boley et al., 2009). In this model, the MPGCs formed until cold molecular clouds within these halos was heated up during the reionization epoch. This suppressed globular cluster formation for a period of time and allowed gases within the host galaxy to enrich in metals. After some time had passed, a second generation of globular clusters, the metal-rich GCs, started to form during galaxy merger events (e.g. Ashman & Zepf, 1992; Beasley et al., 2002; Griffen et al., 2010) and/or the growth of galaxy disks (Shapiro et al., 2010) at redshifts (Shapiro et al., 2010; Spitler, 2010). Although the global nature of the reionization epoch may provide a convenient way to explain the ubiquitous GC metallicity bimodality observed in nearby galaxies, a number of interesting alternative models have been proposed to explain GC metallicity distributions without reionization (e.g. Côté et al., 1998; Scannapieco et al., 2004; Pipino et al., 2007; Hasegawa et al., 2009; Shapiro et al., 2010; Muratov & Gnedin, 2010; Gray & Scannapieco, 2010).
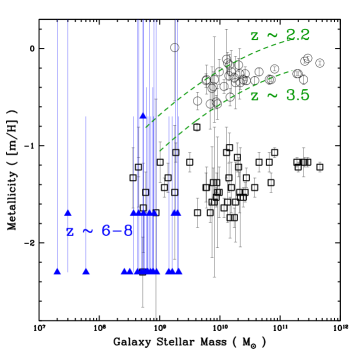
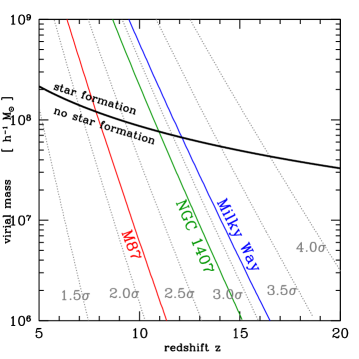
If reionization truncated globular cluster formation, the typical ages of metal-poor globular clusters should correlate with the local reionization epoch. This means metal-poor globular clusters can be used to measure for individual galaxies. Current MPGC age estimates overlap with the expected reionization epoch. Galactic MPGCs are constrained to be older than Gyrs or (Krauss & Chaboyer, 2003), with more stringent constraints on individual MPGCs suggestive of a pre-reionization epoch formation (e.g. Hansen et al., 2004, though exceptions do exist: Hansen et al. 2007). Constraints on the ages of individual extragalactic MPGCs are poorer ( Gyrs, see refs. in Brodie & Strader, 2006), but are consistent with a pre-reionization formation. Also, within the 1-sigma uncertainties the mean MPGC metallicities of various early-type galaxies are statistically consistent with preliminary measurements for galaxies at redshifts (Finkelstein et al., 2010; Bouwens et al., 2010; Labbé et al., 2010). This is shown in Fig. 1 and is consistent with a scenario where MPGCs were in place at redshifts greater than , well into the expected reionization epoch.
Unfortunately, the limited observational information about extragalactic globular clusters and large modeling uncertainties mean that direct methods to age-date extragalactic globular clusters do not provide a useful constraint on the local reionization epoch around individual galaxies.
A novel way to determine when the metal-poor GC formation epoch finished was recently proposed by Diemand et al. (2005) and Moore et al. (2006). The technique is based upon a fundamental property of a CDM universe, where the most massive or rarest dark matter halos (and anything that formed within them) will tend to be centrally concentrated within their final host halos and show unique kinematic signatures at the present epoch. Thus by constraining the spatial and kinematic properties of metal-poor globular clusters today, information about their progenitor halos can be recovered. Since the rarity of a halo for a given virial mass depends on redshift, this information can be used to age-date metal-poor GCs with enough accuracy to constrain the reionization epoch around the galaxy hosting the GCs (Diemand et al., 2005; Moore et al., 2006, see also Bekki 2005).
This technique was demonstrated in Moore et al. (2006) using the Milky Way’s globular cluster system. They found evidence for a reionization redshift of (updated for a WMAP7 cosmology, Komatsu et al., 2011). In the present work, this technique is applied to two additional galaxies located in denser environments than the Milky Way to help constrain the temporal propagation of reionization through the local Universe.
Section 2 provides a detailed background, describing in detail both the theoretical framework of the “Diemand-Moore” methodology and relevant globular cluster observations. In Section 3, the observational data are presented. The main mass modeling and measurements are presented in Section 4. It is followed by a discussion in Section 5.
2 Method and Assumptions
It has been shown that the growth of structure in the Universe can be thought of as a Gaussian mass-density field where mass-density fluctuations form and assemble hierarchically (Press & Schechter, 1974; Lacey & Cole, 1993). The rare mass-density fluctuations in the Universe are biased towards high-density regions of the Universe (Cole & Kaiser, 1989; Sheth & Tormen, 1999). As a consequence, the rarest fluctuations will tend to be the most centrally-concentrated material in a galaxy (Moore et al., 1998; White & Springel, 2000). By convention, the height of the fluctuations are represented by , the number of standard deviations above the mean mass-density level at that epoch.
Diemand et al. (2005) used N-body simulations to explicitly show that the location and kinematic properties of mass structures within a galaxy today depend on the rarity of the mass structure or “halo” when it reached its Jeans mass and gravitationally collapsed. They found that the rarest halos are more likely to accrete onto a galaxy at earlier times, when the gravitational potential of the galaxy was relatively small. Thus any object that formed within a rare halo is more likely to have a smaller infall velocity and will occupy the central regions of the galaxy until the present epoch. This means that an object’s location and orbit or kinematics within a halo today can be used to recover the properties of the halo it formed within (Diemand et al., 2005; Moore et al., 2006). Examples of “tracer” objects include a galaxy’s satellites, its stellar halo, remnants of population III stars, and metal-poor globular clusters.
The “Diemand-Moore” method is a way use the spatial concentration of MPGCs relative to the hosting galaxy’s halo mass profile to constrain the rarity, , of the halos that the MPGCs formed within. Results from computer simulations are used to translate the spatial bias of the MPGCs into a constraint. The value alone does not constrain the redshift when MPGCs stopped forming, so an additional assumption is made to break the degeneracy between redshift and the typical halo mass for a given . By invoking the argument that star formation only occurs efficiently in halos with virial temperature more than T K, the degeneracy can be broken and the redshift when MPGCs were suppressed by reionization is found. More details are provided in the following Sections.
The Diemand-Moore method requires at least three ingredients to constrain the value of MPGC progenitor halos: MPGC surface density profile from observations, a halo mass model for the galaxy hosting the MPGCs and a theoretical framework (here Diemand et al., 2005, is used) to interpret the spatial bias of the MPGCs, relative to the host galaxy’s mass profile. MPGC kinematic information from line-of-sight velocity measurements are an optional 4th ingredient that can be used for an additional, albeit weaker, constraint on . The kinematics also prove to be a useful tool to constrain the galaxy mass model in a self-consistent manner to the theoretical framework.
The main physical model that the following analysis depends upon is outlined here:
-
•
Each MPGC formed at high redshift in a small, rare dark matter halo (likely together with other MPGCs and a small proto-galaxy).
-
•
The bath of UV radiation associated with the reionization epoch was such that MPGC formation was “instantaneously” suppressed111If a locally-instantaneous reionization model is incorrect and an extended reionization is preferred, the MPGC constraints still provide a lower-limit on . This is because the MPGCs will tend to be associated with the most abundant class of halo at the end of the extended reionization epoch: the least-massive or lowest halo that has only just exceeded T K and can form MPGCs. The final spatial distribution of MPGCs will therefore reflect this low class of halos and hence the epoch when reionization completed can still be recovered. in the GC formation sites. This allows one make a simple link between the MPGCs and a single class of halos, thereby constraining exactly.
-
•
The halo containing MPGCs was later accreted by the host galaxy halo, i.e. it became a subhalo.
-
•
This accretion process effectively disrupts the early accreted, biased, rare dark matter subhalos, but the globular cluster tracers remain intact and will maintain the spatial and kinematic properties of the subhalos even to the present day (Diemand et al., 2005).
Should the second assumption prove to be incorrect, the analysis still provides an interesting characterisation of the progenitor subhalos of MPGCs and perhaps the other mechanism(s) that truncated their formation. Also, the tracers need not be MPGCs and can include e.g. the Milky Way stellar halo (Diemand et al., 2005) and its satellite galaxies (Moore et al., 2006, see also Ocvirk & Aubert 2011). Indeed, a useful feature of the Diemand-Moore technique is that it does not care about the detailed baryon physics of e.g. star formation, but only requires an observable tracer of subhalos that accreted relatively early in a galaxy’s formation history.
3 Target Galaxies and the Observations
In this Section, the observational data are described. To constrain for MPGC progenitors in a galaxy, the MPGC surface density profile must be measured out to large radii (typically tens of arcminutes), where contamination starts to contribute significantly to the profile. To reduce contamination levels, high-quality imaging is needed. To statistically subtract the remaining contamination, spectroscopic information can be used (e.g. Strader et al., 2011) or the profile must extend to large enough radii to characterise contamination levels. Furthermore, the galaxy must have relatively “well-behaved” kinematics so that an estimate of the mass model can be derived.
The extragalactic targets described here are the only galaxies that currently meet these demanding requirements. The galaxies also conveniently reside within different galaxy environments, including the “high-density” environment of a cluster galaxy, a “medium-density” group and a “low-density” field galaxy.
3.1 Messier 87
Messier 87 (M87) is the central galaxy associated with the Virgo cluster of galaxies. It is located 16.5 Mpc away and the cluster contains hundreds of member galaxies. Though M87 and the Virgo cluster are frequently treated as the same thing (at least in terms of their “common” dark matter halo), recent analysis supports early suggestions that the Virgo cluster is not a single massive galaxy cluster halo, but is instead made up of a set of subhalos in an unrelaxed state (Binggeli et al., 1987; Strader et al., 2011). The M87 galaxy-sized halo is thought to be virialized, but is a distinct subhalo from the rest of the Virgo structure (see discussion in Doherty et al., 2009; Strader et al., 2011; Romanowsky et al., 2011).
From kinematic tracers within kpc, the extrapolated virial mass ( ) of the M87 halo is (Strader et al., 2011). The surrounding Virgo cluster halo is (e.g. McLaughlin, 1999b; Strader et al., 2011), which means M87 resides in high-density environment and was therefore one of the first locations in the local Universe to host star formation. It has even been proposed that ionizing radiation from sources in Virgo had enough of a head-start to travel to the Local Group and reionize the Milky Way galaxy (e.g. Weinmann et al., 2007). For these reasons, M87 and the Virgo cluster are a particularly interesting location to measure the local reionization epoch.
The M87 GC catalogue is presented in Strader et al. (2011) and was constructed from archival CFHT/Megacam (Boulade et al., 2003) images. Kinematic information for the GCs come from Strader et al. (2011), who present new Keck/DEIMOS (Faber et al., 2003), Keck/LRIS (Oke et al., 1995) and MMT/Hectospec (Fabricant et al., 2005) line-of-sight velocities. Out of an estimated MPGC population of MPGCs (Strader et al., 2011), 289 have useful velocity information.
The M87 MPGC surface density was derived in Strader et al. (2011) using standard reduction techniques and methodologies. Briefly, GCs were photometrically selected down to mag. over a region extending to radii kpc from M87. Hubble Space Telescope imaging and the velocity information were used to accurately constrain the amount of contamination present in the GC catalogue, which was subtracted off the MPGC surface density profile before analysis.
3.2 NGC 1407
The second target of this study is an elliptical galaxy named NGC 1407, whose galaxy group contains members (Brough et al., 2006). It is 21 Mpc distant and has a sizable GC system (Forbes et al., 2006; Harris et al., 2006). Romanowsky et al. (2009) found the galaxy group, which is centred on NGC 1407, to have a relatively high mass-to-light ratio for its total virial mass . This target provides a probe of reionization in a “medium-density” environment.
Two Subaru/Suprime-Cam (Miyazaki et al., 2002) image datasets of NGC 1407 were analysed. Each covers a area on the sky. The first is centered on NGC 1407 and is made up nearly 5 hours of imaging under conditions. The resulting GC catalogue has been used for an extensive spectroscopic campaign with Keck/DEIMOS (Romanowsky et al., 2009; Foster et al., 2010; Pota et al., 2011) and a photometric study (Forbes et al., 2011). The second Suprime-Cam dataset is an archival dataset in bands with seeing and totaling hours in exposure time. In this imageset, NGC 1407 was positioned toward one end of the mosaic so the radial coverage extends from NGC 1407 or kpc. The GC catalogues are available upon request from the first author.
MPGC surface density profiles were constructed in each dataset from a catalogue of GC candidates found in the images (MPGCs were taken to have ). A literature Hubble Space Telescope, Advanced Camera for Surveys catalogue (Forbes et al., 2006) was incorporated into the analysis to improve the surface density profile in the central of the galaxy center. Standard procedures were followed to derive the GC surface density profile (e.g. Spitler et al., 2008b). The surface density data extend to kpc and a constant surface density is not reached at large radii, suggesting a small number of MPGCs should be found beyond the region covered by the Suprime-Cam imaging. Since contamination was not subtracted from the MPGC surface density profile, the fits to the NGC 1407 MPGCs described in subsequent sections include a constant background level to model the contamination.
An expanded GC line-of-sight velocity catalogue from Romanowsky et al. (2009) and Foster et al. (2010) is used, which incorporates new Keck/DEIMOS observations (Pota et al., 2011). The total number of NGC 1407 MPGCs with spectroscopic velocities is 167 GCs (excluding suspected ultra compact dwarf candidates; see details below), out of an estimated total of .
3.3 Milky Way
The Milky Way (MW) MPGC spatial and kinematic information come from the new Harris (2010) catalogue. The MPGC sample contains 110 GCs with and has a mean metallicity of . The Milky Way GC analysis is carried out in three-dimensions rather than in projection as for the preceding galaxies. In order to model the halo mass profile of the Milky Way with the MPGC velocity information, heliocentric distances and velocities must be corrected to the Galactic reference frame. The distance correction is straightforward and included in the Harris (2010) catalog itself, but the velocities in principle require proper motion measurements, and these are in many cases not available with sufficient precision. Instead, after correcting the line-of-sight velocities for the heliocentric motion (e.g., eq. 5 of Xue et al. 2008), the data are corrected to the true radial velocities on a statistical basis: given the anisotropy profile from the best-fit model (discussed in the next Section), the correction from line-of-sight to radial velocity dispersion (eq. 1 of Battaglia et al. 2006) is applied to the observed velocities, and the dispersion profile is calculated. This processes is repeated iteratively and ultimately yields a very small correction that affects the final values at only the 3% level (after excluding from the analysis the GC kinematics inside 8 kpc, which are more difficult to correct).
4 Analysis
The Diemand-Moore technique uses the spatial bias of MPGCs relative to the hosting galaxy’s dark matter distribution to constrain the properties of the MPGC progenitor subhalos. This is accomplished by fitting a modified Navarro et al. (1996, NFW) function from Diemand et al. (2005) to the MPGC spatial distribution. The fit also requires as input the scale radius () of the host galaxy halo, and thus an accurate mass model of each galaxy is an important component of this work. Although models for these galaxies exist in the literature, they are derived using different techniques and various mass tracers. To remove possible systematic errors resulting from these inhomogeneities, new mass models are derived for each galaxy. Also, to ensure the fits to the surface density profile are derived in a self-consistent manner with the galaxy mass models, MPGC observations are used to derive the mass model.
The mass modelling methodology is outlined in the first subsection below. In subsequent subsections, the individual galaxy mass models are derived. Though some necessary assumptions and compromises are made to yield the final mass models, the halo mass properties and their uncertainties are robust. In the final subsection, §4.6, the measurements for each are converted into constraints.
In the following, the MPGC spatial profile is denoted and , for three-dimensional and the projected cases, respectively. Also, when constraints from the Diemand-Moore technique are discussed, actually refers to all subhalos above the subhalo virial mass corresponding to that . For example, the constraint for the Milky Way, actually includes all subhalos equal to and more massive than a halo at the redshift of interest.
4.1 Derivation of the Galaxy Mass Models
Here we outline our modeling methods that will be used for specific galaxies in the following subsections. We begin with the three-dimensional number density profile of the dynamical tracer population (MPGCs in this paper). This profile is modeled as a modified NFW profile, as derived in Diemand et al. (2005):
| (1) |
where is the rarity value, and are the inner and outer power-law slopes, respectively, and describes the intermediate behavior. Following Diemand et al. (2005), we set , , and . Thus a higher value implies a steeper outer slope. The value of is related to a characteristic radius by:
| (2) |
which means the surface density is more compact for higher values of .
Ideally, we would compare this model to an observed surface density profile, and fit for . However, in practice there are not good prior constraints on available, i.e., we do not know the DM distribution of the halo which we need to estimate the relative compactness of the MPGC subpopulation.222One might think that with massive ellipticals like NGC 1407 and M87, an X-ray based mass profile would provided the much-needed independent information on the DM profile. However, as discussed in Romanowsky et al. (2009), for these particular galaxies, there are inconsistencies between the X-ray results and GC system dynamics. In fact, there is an emerging, wider pattern of disagreement between X-ray and optical mass determinations in elliptical galaxies (e.g., Shen & Gebhardt 2010). For this paper, it is assumed that the MPGC dynamics results are reliable. To solve this problem, we will make use of the fact that there are kinematical predictions of the model, so we can use the observed spatial and kinematical distributions to fit simultaneously for and .
Our basic approach for the kinematics is to take model distributions for mass, MPGC density, and anisotropy, solve a spherical Jeans equation (e.g., Mamon & Łokas 2005) and derive a velocity dispersion profile for the MPGCs, . In the Milky Way, the prediction can be directly compared to observational data, while in external galaxies, an additional step is needed to project to line-of-sight dispersions, .
Each mass model consists of a stellar component (with a reasonable value for the stellar mass-to-light ratio ) and a CDM-based model for the DM distribution. This DM profile has a similar parametric form to Equation 1, but with density and scale parameters ( and ) that are highly correlated. To derive these correlations (or modeling priors), we begin with the relation between virial mass and concentration predicted for relaxed halos at by the Bolshoi and BigBolshoi simulations using WMAP5 cosmological parameters (Prada et al., 2011, eq. 25). After converting the mass and concentration into scale radius and density, and subtracting off a cosmological baryon fraction of to find the DM density alone, the following power-law provides an approximation to the average results of the numerical simulations:
| (3) |
which is good to 8% or better over the virial mass range of –. A 1 cosmological scatter in halo concentration of dex (Duffy et al., 2008; Macciò et al., 2008) translates to a scatter in at fixed of dex. This scatter ultimately provides the largest systematic uncertainty on the measurements of and hence .
These results involve fits of standard NFW density profiles to the simulations (i.e., Equation 1 with , , ). However, the Diemand et al. (2005) analyses used a slightly different DM density model, where the central cusp has a power-law slope of rather than :
| (4) |
Here it is assumed if such a model had been fitted to the recent simulations, the and values would be the same as with the NFW fits. Eq. 3 then becomes:
| (5) |
In practice, the increased fractional mass inside means that lower values will be fitted to the data, relative to an NFW model. The model for a mass-sequence of average DM circular velocity profiles is then:
| (6) |
where is a hypergeometric function.
The final ingredient in the models is the velocity dispersion anisotropy profile, which is normally a major source of uncertainty in modeling observations of pressure-supported galaxies, but in the context of the Diemand-Moore models, is uniquely constrained. This anisotropy profile is:
| (7) |
where:
| (8) |
This anisotropy profile is isotropic in the center ( for ) and becomes radially biased in the outer regions ( for ). Higher values of imply stronger radial anisotropy.
A complication for modeling both NGC 1407 and M87 is that there are some correlations between GC luminosities and kinematics that are probably driven by populations of ultra-compact dwarfs (UCDs) at the bright end, with distinct dynamics from the “normal” GCs (see Romanowsky et al., 2009; Strader et al., 2011; Brodie et al., 2011, for more details). Although the UCDs comprise only a tiny part of the overall “GC” systems, they represent a substantial fraction of the luminosity-based spectroscopic samples. Such objects were therefore eliminated from the kinematic samples by excluding anything that has a large measured size (half-light radius pc), or that has no size measurement but is bright ( and for NGC 1407 and M87, respectively). These objects have no impact on the measured surface density profiles.
The following subsections present the details of the modeling for each galaxy, and the resulting constraints.
4.2 Rarity of M87 MPGC progenitor subhalos
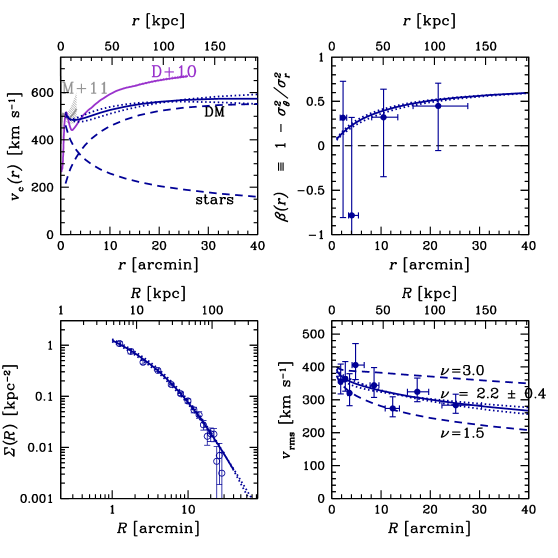
For M87, the mass models are tuned not only to fit the MPGC subpopulation velocity dispersion but also to have a total 500 km s-1 at 5 kpc for consistency with the stellar dynamics results of Murphy et al. (2011); this means adjusting accordingly. As discussed in Strader et al. (2011), the NFW models have some difficulty in reproducing the stellar dynamics inferences at 15 kpc; the cuspier Diemand et al. (2005) models fare better, but there may still be some tension with the stellar data. These mass models are also completely unable to reproduce the X-ray based mass-model of Das et al. (2010) while maintaining strongly radial anisotropy and reproducing the observed velocity dispersions (an additional example of the problem is footnoted in §4.1).
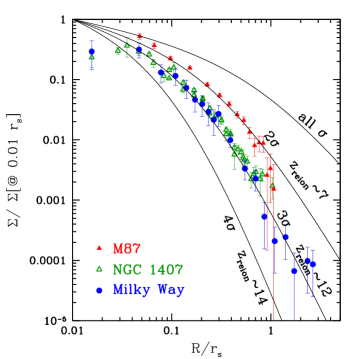
Figure 2 shows the elements of the modeling procedure, along with comparisons to data as applicable. The model consists of profiles of , , and (the latter is not shown), which are then input to the Jeans equation to solve for and , and projected to (lower left panel in Fig. 2) and (lower right panel). As a consistency check, the model expectations for are compared with an empirical estimate from the line-of-sight velocity distribution of the data in the upper right panel of Fig. 2. This estimate makes use of a restricted class of spherical constant- models which predict the line-of-sight velocity kurtosis if the velocity dispersion profile is approximately constant with radius (Napolitano et al., 2009). The kurtosis measurements from the MPGC data can thus be converted to rough estimates of the anisotropy profile.
For M87, a typical-concentration CDM halo with kpc () is found, along with the Diemand et al. (2005) anisotropy prediction, to fit the M87 MPGC dispersion data remarkably well. The implied is also nicely consistent with the empirical estimates. This model corresponds to . The predicted velocity dispersions are fairly sensitive to the value of , increasing for larger (and ). Using a fit to the dispersion data, is determined at the kpc level, and at the level.
These results hold for the strong theoretical CDM prior adopted on the halo parameters. Relaxing this prior allows for a much larger range of solutions, as various combinations of halo density and scale radius can all provide similar mass profiles in the region with MPGC observations. Allowing for the predicted 1 scatter in the halo properties (i.e., varying the normalization of Eq. 6 by 0.12 dex), is constrained at the 50% level, yielding (see Figure 2).
4.3 Rarity of NGC 1407 MPGC progenitor subhalos
For NGC 1407, several priors are invoked: the mass-concentration relation from CDM; an estimate of the mass at 100 arcmin from satellite galaxy dynamics ( km s-1; see Romanowsky et al. 2009); and a measurement of the central stellar velocity dispersion around 1 of km s-1 (Proctor et al., 2009). It is beyond the scope of this paper to carry out the detailed dynamical modeling required to convert this measurement into an estimate of , and instead the empirical results from dynamical modeling of various other pressure-supported galaxies that 1.4–1.7 (Wolf et al., 2010; Trujillo-Gomez et al., 2011; Murphy et al., 2011; Dutton et al., 2011) are used.
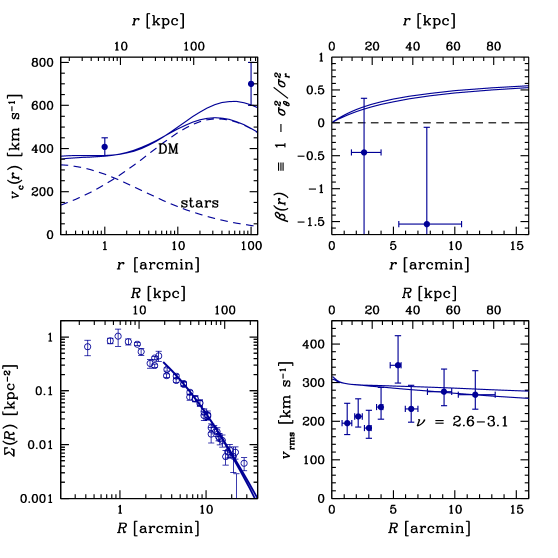
Unlike M87, for NGC 1407 there is no model solution that straightforwardly fits all of the above constraints (see Figure 3). In particular, it appears to be very difficult to match the inner MPGC velocity dispersion profile, where the 200 km s-1 inside 4 arcmin ( 25 kpc) is lower than the stellar velocity dispersion. Normally, the MPGC dispersion should be higher because the spatial distribution is more extended. Lowering the dispersion would require tangential orbital anisotropy, which contradicts expectations in the Diemand et al. (2005) model for mild radial anisotropy. It is speculated instead that GC disruption processes near the galactic center have preferentially depleted the more radial orbits (e.g. Fall & Zhang, 2001; Vesperini et al., 2003). MPGCs inside 3.5 arcmin ( kpc) are therefore excluded from the analysis (it is not clear why this should be necessary for NGC 1407 but not for M87).
Considering now the outer MPGC velocity dispersion data, it also turns out to be difficult to fit the joint constraints from CDM halo concentration expectations and the satellite galaxies dynamics. The mass required by the latter predicts MPGC dispersions higher than observed, which can be alleviated by a low-concentration halo. The range of plausible solutions is bracketed by adopting a halo that has a low concentration at the 1 level while fitting the satellites constraint, or one with a normal concentration that does not agree with the satellites (whose constraint is then assumed to be unreliable). Alternative modifications to lower the MPGC dispersions would be to use a less cuspy NFW model (which is within the cosmological scatter for halo profiles), or to decrease the adopted distance since the kinematics data will then effectively be probing less far into the halo (although this galaxy is likely to be more distant, not less, based on estimates summarized in NED).
The resulting range in fit parameters is 2.6–3.1; again, the systematic uncertainties outweigh the statistical ones ( 0.15) from fitting the dispersion and density profiles. An additional issue from these solutions is that the low observed kurtosis for the outer MPGCs suggests tangential anisotropy in these regions too, again at odds with the radial model expectations.
4.4 Rarity of Milky Way MPGC progenitor subhalos
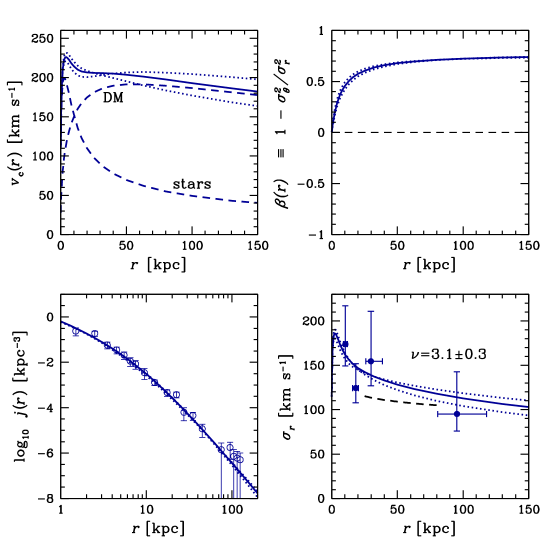
The Milky Way modeling differs slightly from the previous two galaxies by treating 3-D rather than projected profiles (of density and velocity dispersion). For the mass model, a CDM motivated halo is included as before, along with stellar disk and bulge components based on models “I” and “II” from Binney & Tremaine (2008), which bracket a plausible range of parameters for these components. We also tried the disk and bulge model of Widrow et al. (2008), which is roughly halfway between the I and II models of Binney & Tremaine (2008). As shown in the upper left panel of Fig. 4, since these components influence the central regions only, all choices give the same results for . The model I of Binney & Tremaine (2008) was adopted.
The modeling results are illustrated in Figure 4. After excluding the region inside 2 kpc from the density profile fit because of the presence of a core (Parmentier & Grebel, 2005; Bica et al., 2006), a good fit to both the density and radial velocity dispersion profiles is found. The best-fit value for the MPGC subhalo rarity is , where the uncertainty is again driven by the scatter in the assumed halo mass-concentration relation. The parameters for the DM halos in these models are listed in the Figure caption. The different DM model derived here is the main reason why a higher is found compared to the earlier work by Moore et al. (2006).
Note that there is a gap in the MPGC velocity data around 50 kpc. If the MPGC velocity dispersion in this region were assumed to be as low as for the halo stars (as indicated by the dashed curve in the Figure, from Gnedin et al. 2010) then the virial mass and value would need to be lower. The default halo mass profile is actually similar to that of Gnedin et al. (2010) despite the higher velocity dispersion found here. This is because the high typical anisotropy in the current model elevates the radial dispersion relative to the that the former authors assumed, and which would be appropriate for the dark matter particles on average, not for the “biased” subset of halo particles that should correspond to the stars and MPGCs.
4.5 Mass modelling summary
In the Milky Way and M87, the MPGC kinematics comfortably fit within the Diemand et al. (2005) theoretical framework and are consistent with other mass tracers. Though the mass models unfortunately suffer from rather large systematic uncertainties from the CDM prior, the quality of the models mean the measurements described below are on firm ground. The situation for NGC 1407, from a mass-modelling perspective, is less clear. There appears to be lingering tension between the models and observations, which merit further study.
4.6 Constraining the reionization epoch
| environmental | min. virial | |||
|---|---|---|---|---|
| density | mass | |||
| [ ] | ||||
| Messier 87 | high/cluster | |||
| NGC 1407 | medium/group | |||
| Milky Way | low/field | |||
| mean |
To convert the constraints from the preceding sections into estimates for the truncation redshift of MPGC formation (e.g. ), a degeneracy must be broken between subhalo virial mass and redshift for a given . The evolving properties of a given subhalo can be analytically computed using the (Press & Schechter, 1974) Gaussian field formalism. The value is explicitly defined as: , where the constant is the criterion for spherical collapse, is the linear growth factor and is the typical mass-density fluctuation “height” for a subhalo of a given virial mass (see e.g. Mo & White, 2002). For the present work, a top hat filter is used to select the characteristic spatial scale. The CAMB (Lewis et al., 2000) online interface333http://lambda.gsfc.nasa.gov/toolbox/tb_camb_form.cfm was used to generate the linear power spectrum for a WMAP7 cosmology (Komatsu et al., 2011). Figure 5 shows the relationship between the rarity, , of a mass-density fluctuation for a given redshift pair.
Figure 5 also shows how a measurement alone will not constrain the redshift when MPGC formation is suppressed. Further information is required to break this degeneracy. Following Moore et al. (2006), it is assumed that star and MPGC formation can only occur in subhalos that have virial temperatures greater than TK, where gas is able to rapidly cool and form stars (e.g. Ostriker & Gnedin, 1996). The region in Fig. 5 below the TK curve can therefore be excluded. The region above the TK curve can be excluded as well, since MPGC formation would have taken place in subhalos that would ultimately have less or more concentrated spatial distributions than what is observed in the galaxies. For example, for the Milky Way constraint of , at redshift of , subhalos with mass could still have formed MPGCs efficiently, which would have led to a spatial distribution resembling subhalos, contradicting the observations. At redshifts higher than the intersection between the TK relation and the curve from MPGC observations, only rarer, e.g. , subhalos could form MPGCs, thus the spatial distribution would have been more concentrated than is observed. The intersection between the constraint and the TK curve is therefore taken to be the MPGC truncation redshift or the local of the host galaxy.
5 Discussion
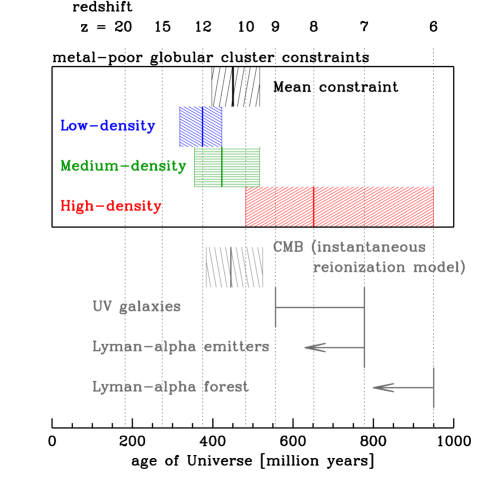
The reionization redshift () constraints from metal-poor globular cluster observations (see Fig. 6) are summarized in Fig. 7 with existing estimates and limits from the literature. The local constraints from metal-poor globular cluster (MPGC) observations are tabulated in Tab. 1.
The only existing constraints on from MPGCs are for the Milky Way. As described in §1, our estimate agrees with that derived in Moore et al. (2006), who used the same technique employed here. Also, the high-resolution dark matter Milky Way simulation described in Griffen et al. (2010) can only reproduce the observed spatial distribution of MPGCs and their numbers only when MPGC formation was suppressed by reionization at . This value agrees with our own estimate within its 1 uncertainty.
5.1 Environmental propagation of reionization
The MPGC values and their uncertainties span the redshift range covered by estimates from the literature, with the weighted mean MPGC constraint showing best agreement with the cosmic microwave background (CMB) value and an instantaneous reionization model (Larson et al., 2011; Komatsu et al., 2011). It is apparent that the M87 measurement is somewhat of an outlier compared to the other MPGC estimates. Since M87 is located in the high-density environment of a galaxy cluster, it is possible that its lower results from an environmentally-dependent reionization epoch. Unfortunately, the relatively large systematic uncertainties on the galaxy halo mass models mean the difference between in the highest and lowest density environments (M87 vs. Milky Way ) is only significant at the level.
In addition to a correlation between the MPGC spatial distribution and the local reionization epoch, Moore et al. (2006) predicted that should also correlate with the virial mass-normalized MPGC numbers. This is because galaxies with a lower had more time to produce MPGCs. Both Spitler et al. (2008b) and Spitler & Forbes (2009) found no evidence for a correlation between MPGC virial mass specific frequencies and environment. However, their virial mass estimates were derived from statistical relationships between stellar and virial masses, which are not ideal for use on individual galaxies.
Using the galaxy virial masses derived in Section 4 and MPGC GC numbers () from Section 3, the following MPGC virial mass specific frequencies ( Spitler et al., 2008b) are found: , for M87, NGC 1407, and the Milky Way, respectively. The errors are again dominated by systematic uncertainties in the galaxy mass models. M87 has a value that is larger than the Milky Way or NGC 1407, at the significance level. The normalized MPGC numbers thus lend further support to the idea that reionization finished in M87 at lower redshifts compared to the other galaxies. In general, massive galaxies at the centres of galaxy clusters (e.g. M87) are known to have enhanced relative number of GCs when normalized to the galaxy’s star light (e.g. Harris, 1991; McLaughlin, 1999a). Whether this holds when the MPGC numbers are instead normalized to virial masses (which should not be directly influenced by reionization) will need to be explored in a future work.
The above results provide an exciting hint that reionization completed first in low-density environments.
5.2 The theoretical context
A number of large-scale radiative transfer simulations have been run to understand the propagation of reionization through different galaxy environments. From analysis of these simulations, it is found that proto-galaxies in high-density environments produce significant numbers of ionizing sources early on and thus are the first locations to reionize (Iliev et al., 2006; Finlator et al., 2009; Iliev et al., 2011, however see Weinmann et al. 2007).
Such simulations typically do not have a large enough dynamical range to capture both the environmental propagation of reionization over large volumes and the small-scale physics that are important for understanding localized affects. For example, when an inhomogeneous intergalactic medium is incorporated into reionization models, dense pockets of neutral gas can survive even after surrounding regions had completed the reionization process (Miralda-Escudé et al., 2000; Ciardi et al., 2003; Furlanetto & Oh, 2005; Iliev et al., 2008; Choudhury et al., 2009; Mitra et al., 2011, 2012). These pockets tend to be located in dense environments, where recombination rates can stay high despite their proximity to large reservoirs of ionizing sources. This means the intergalactic medium in dense environments started to reionize first, but only completely reionized after lower density environments had finished.
The trend hinted at by the metal-poor globular cluster observations agrees with this latter theoretical work. Under this scenario, MPGCs in a high-density environment continued forming to lower redshifts in self-shielded pockets, even as low environmental-density regions were being completely ionized. The progenitor molecular clouds of MPGCs located in more vulnerable environments (like that surrounding the Milky Way) were not surrounded by gas with sufficiently high recombination rates to survive the ionizing front that originated within or passed through the region.
6 Conclusions
The spatial and kinematic properties of metal-poor globular clusters (MPGCs) provide an exciting hint that reionization was inhomogeneous. In the local Universe, reionization completed first in low-density environments around (for the Milky Way and large central group elliptical NGC 1407) and finished last in the high-density environment around the Virgo cluster at . While uncertainties on the galaxy halo mass models limit the strength of this conclusion, another property, the relative number of metal-poor globular clusters, supports this interpretation. The apparent environmental dependence of also aligns with theoretical work that finds that the ionization front propagated from high- to low-density environments, with the high densities finishing reionization last. Furthermore, the apparent agreement between the range of constraints from MPGC observations and those from the literature may provide additional support to models where reionization was globally prolonged in duration.
More observational work, especially to improve the individual galaxy halo mass models, is required to confirm the results found here. It will also be important to model MPGC formation in large-scale, radiative transfer simulations with realistic models of star cluster dynamical evolution. This will help refine the technique utilized here and clarify the relationship between reionization and the truncation of MPGC formation. For example, given that high star formation rates and gas densities were needed to produce such dense star clusters, it is possible that MPGCs trace the end of reionization, where ionizing radiation was able to finally penetrate the densest gas clouds.
Expanding this initial study to other galaxies will yield a reionization map of the local Universe, further aiding our understanding of galaxy formation and evolution over cosmic time.
If reionization is not responsible for the truncation of MPGC formation, the results presented here provide unique constraints on the formation histories of MPGCs. Furthermore, since MPGCs and stellar halos of the Milky Way share spatial and chemical properties (Helmi, 2008; Martell et al., 2011, see also M31, Huxor et al. 2011) they might share a common origin. If this is the case for other galaxies, then MPGC observations can be used to constrain the star formation history of their stellar halos.
Finally, the power of the Diemand-Moore technique is that it does not care about the detailed star formation and enrichment physics – it only requires an observable tracer object that accreted onto the galaxy at early times (Diemand et al., 2005).
Acknowledgements
We want to acknowledge the useful comments provided by the anonymous reviewer. We also thank Chris Blake for assistance with the cosmological derivations and Anna Sippel for help with the initial Subaru reductions. LS was supported by the ARC Discovery Programme grants DP0770233 and DP1094370. This work was supported by the National Science Foundation through grants AST-0808099, AST-0909237, and AST-1109878. DF thanks the ARC Discovery Programme for support. This paper was based in part on data collected at Subaru Telescope, which is operated by the National Astronomical Observatory of Japan. Some of the Subaru data were acquired with the timeswap Gemini program GN-2006B-C-18. Some of the data presented herein were obtained at the W. M. Keck Observatory, which is operated as a scientific partnership among the California Institute of Technology, the University of California and the National Aeronautics and Space Administration. The Observatory was made possible by the generous financial support of the W. M. Keck Foundation. Observations reported here were obtained at the MMT Observatory, a joint facility of the Smithsonian Institution and the University of Arizona.
References
- Ashman & Zepf (1992) Ashman K. M., Zepf S. E., 1992, ApJ, 384, 50
- Baek et al. (2010) Baek S., Semelin B., Di Matteo P., Revaz Y., Combes F., 2010, A&A, 523, 4
- Barkana & Loeb (2001) Barkana R., Loeb A., 2001, Physics Reports, 349, 125
- Battaglia et al. (2006) Battaglia G. et al., 2006, MNRAS, 370, 1055
- Beasley et al. (2002) Beasley M. A., Baugh C. M., Forbes D. A., Sharples R. M., Frenk C. S., 2002, MNRAS, 333, 383
- Bekki (2005) Bekki K., 2005, ApJ, 626, L93
- Bekki et al. (2008) Bekki K., Yahagi H., Nagashima M., Forbes D. A., 2008, MNRAS, 387, 1131
- Bica et al. (2006) Bica E., Bonatto C., Barbuy B., Ortolani S., 2006, A&A, 450, 105
- Binggeli et al. (1987) Binggeli B., Tammann G. A., Sandage A., 1987, The AJ, 94, 251
- Binney & Tremaine (2008) Binney J., Tremaine S., 2008, Galactic Dynamics: Second Edition
- Boley et al. (2009) Boley A. C., Lake G., Read J., Teyssier R., 2009, ApJ Letters, 706, L192
- Bolton et al. (2010) Bolton J. S., Becker G. D., Wyithe J. S. B., Haehnelt M. G., Sargent W. L. W., 2010, MNRAS, 406, 612
- Boulade et al. (2003) Boulade O. et al., 2003, in , pp. 72–81
- Bouwens et al. (2011) Bouwens R. J. et al., 2011, arXiv:1105.2038B
- Bouwens et al. (2010) Bouwens R. J. et al., 2010, ApJ, 708, L69
- Bowman & Rogers (2010) Bowman J. D., Rogers A. E. E., 2010, Nature, 468, 796
- Brodie et al. (2011) Brodie J. P., Romanowsky A. J., Strader J., Forbes D. A., 2011, 1109.5696
- Brodie & Strader (2006) Brodie J. P., Strader J., 2006, ARAA, 44, 193
- Bromm & Clarke (2002) Bromm V., Clarke C. J., 2002, ApJ, 566, L1
- Brough et al. (2006) Brough S., Forbes D. A., Kilborn V. A., Couch W., Colless M., 2006, MNRAS, 369, 1351
- Bunker et al. (2010) Bunker A. J. et al., 2010, MNRAS, 409, 855
- Choudhury et al. (2009) Choudhury T. R., Haehnelt M. G., Regan J., 2009, MNRAS, 394, 960
- Ciardi et al. (2003) Ciardi B., Stoehr F., White S. D. M., 2003, MNRAS, 343, 1101
- Cole & Kaiser (1989) Cole S., Kaiser N., 1989, MNRAS, 237, 1127
- Côté et al. (1998) Côté P., Marzke R. O., West M. J., 1998, ApJ, 501, 554
- Das et al. (2010) Das P., Gerhard O., Churazov E., Zhuravleva I., 2010, MNRAS, 409, 1362
- Diemand et al. (2005) Diemand J., Madau P., Moore B., 2005, MNRAS, 364, 367
- Dijkstra et al. (2004) Dijkstra M., Haiman Z., Loeb A., 2004, ApJ, 613, 646
- Doherty et al. (2009) Doherty M. et al., 2009, A&A, 502, 771
- Dopita et al. (2011) Dopita M. A., Krauss L. M., Sutherland R. S., Kobayashi C., Lineweaver C. H., 2011, Astrophysics and Space Science, 335, 345
- Duffy et al. (2008) Duffy A. R., Schaye J., Kay S. T., Dalla Vecchia C., 2008, MNRAS, 390, L64
- Dutton et al. (2011) Dutton A. A. et al., 2011, MNRAS, 416, 322
- Erb et al. (2006) Erb D. K., Steidel C. C., Shapley A. E., Pettini M., Reddy N. A., Adelberger K. L., 2006, ApJ, 646, 107
- Faber et al. (2003) Faber S. M. et al., 2003, in , pp. 1657–1669
- Fabricant et al. (2005) Fabricant D. et al., 2005, PASP, 117, 1411
- Fall & Zhang (2001) Fall S. M., Zhang Q., 2001, ApJ, 561, 751
- Fan et al. (2006) Fan X. et al., 2006, The AJ, 132, 117
- Finkelstein et al. (2010) Finkelstein S. L., Papovich C., Giavalisco M., Reddy N. A., Ferguson H. C., Koekemoer A. M., Dickinson M., 2010, ApJ, 719, 1250
- Finlator et al. (2009) Finlator K., Özel F., Davé R., Oppenheimer B. D., 2009, MNRAS, 400, 1049
- Forbes et al. (2011) Forbes D., Spitler L., Strader J., Romanowsky A., Brodie J., Foster C., 2011, 1101.3575
- Forbes et al. (1997) Forbes D. A., Brodie J. P., Grillmair C. J., 1997, AJ, 113, 1652
- Forbes et al. (2006) Forbes D. A., Sánchez-Blázquez P., Phan A. T. T., Brodie J. P., Strader J., Spitler L., 2006, MNRAS, 366, 1230
- Foster et al. (2010) Foster C., Forbes D. A., Proctor R. N., Strader J., Brodie J. P., Spitler L. R., 2010, The AJ, 139, 1566
- Furlanetto & Oh (2005) Furlanetto S. R., Oh S. P., 2005, MNRAS, 363, 1031
- Gebhardt & Kissler-Patig (1999) Gebhardt K., Kissler-Patig M., 1999, AJ, 118, 1526
- Gnedin et al. (2010) Gnedin O. Y., Brown W. R., Geller M. J., Kenyon S. J., 2010, ApJ, 720, L108
- Gray & Scannapieco (2010) Gray W. J., Scannapieco E., 2010, ApJ, 718, 417
- Griffen et al. (2010) Griffen B. F., Drinkwater M. J., Thomas P. A., Helly J. C., Pimbblet K. A., 2010, MNRAS, 405, 375
- Hansen et al. (2007) Hansen B. M. S. et al., 2007, ApJ, 671, 380
- Hansen et al. (2004) Hansen B. M. S. et al., 2004, ApJSS, 155, 551
- Harris (1991) Harris W. E., 1991, ARAA, 29, 543
- Harris (2010) Harris W. E., 2010, 1012.3224
- Harris et al. (2006) Harris W. E., Whitmore B. C., Karakla D., Okon W., Baum W. A., Hanes D. A., Kavelaars J. J., 2006, ApJ, 636, 90
- Hasegawa et al. (2009) Hasegawa K., Umemura M., Kitayama T., 2009, MNRAS, 397, 1338
- Helmi (2008) Helmi A., 2008, A&A Review, 15, 145
- Huxor et al. (2011) Huxor A. P. et al., 2011, MNRAS, 414, 770
- Iliev et al. (2006) Iliev I. T., Mellema G., Pen U., Merz H., Shapiro P. R., Alvarez M. A., 2006, MNRAS, 369, 1625
- Iliev et al. (2011) Iliev I. T., Moore B., Gottlöber S., Yepes G., Hoffman Y., Mellema G., 2011, MNRAS, 413, 2093
- Iliev et al. (2008) Iliev I. T., Shapiro P. R., McDonald P., Mellema G., Pen U., 2008, MNRAS, 391, 63
- Kashikawa et al. (2011) Kashikawa N. et al., 2011, ApJ, 734, 119
- Komatsu et al. (2011) Komatsu E. et al., 2011, ApJSS, 192, 18
- Krauss & Chaboyer (2003) Krauss L. M., Chaboyer B., 2003, Science, 299, 65
- Kundu & Whitmore (2001) Kundu A., Whitmore B. C., 2001, AJ, 122, 1251
- Kundu & Zepf (2007) Kundu A., Zepf S. E., 2007, ApJ, 660, L109
- Labbé et al. (2010) Labbé I. et al., 2010, ApJ, 716, L103
- Lacey & Cole (1993) Lacey C., Cole S., 1993, MNRAS, 262, 627
- Larsen et al. (2001) Larsen S. S., Brodie J. P., Huchra J. P., Forbes D. A., Grillmair C. J., 2001, AJ, 121, 2974
- Larson et al. (2011) Larson D. et al., 2011, ApJSS, 192, 16
- Lewis et al. (2000) Lewis A., Challinor A., Lasenby A., 2000, ApJ, 538, 473
- Lidz et al. (2007) Lidz A., McQuinn M., Zaldarriaga M., Hernquist L., Dutta S., 2007, ApJ, 670, 39
- Lorenzoni et al. (2011) Lorenzoni S., Bunker A. J., Wilkins S. M., Stanway E. R., Jarvis M. J., Caruana J., 2011, MNRAS, 414, 1455
- Macciò et al. (2008) Macciò A. V., Dutton A. A., van den Bosch F. C., 2008, MNRAS, 391, 1940
- Mamon & Łokas (2005) Mamon G. A., Łokas E. L., 2005, MNRAS, 363, 705
- Mannucci et al. (2009) Mannucci F. et al., 2009, MNRAS, 398, 1915
- Martell et al. (2011) Martell S. L., Smolinski J. P., Beers T. C., Grebel E. K., 2011, A&A, 534, 136
- McLaughlin (1999a) McLaughlin D. E., 1999a, AJ, 117, 2398
- McLaughlin (1999b) McLaughlin D. E., 1999b, ApJ, 512, L9
- Miralda-Escudé et al. (2000) Miralda-Escudé J., Haehnelt M., Rees M. J., 2000, ApJ, 530, 1
- Mitra et al. (2011) Mitra S., Choudhury T. R., Ferrara A., 2011, MNRAS, 413, 1569
- Mitra et al. (2012) Mitra S., Choudhury T. R., Ferrara A., 2012, MNRAS, 419, 1480
- Miyazaki et al. (2002) Miyazaki S. et al., 2002, PASJ, 54, 833
- Mo & White (2002) Mo H. J., White S. D. M., 2002, MNRAS, 336, 112
- Moore et al. (2006) Moore B., Diemand J., Madau P., Zemp M., Stadel J., 2006, MNRAS, 368, 563
- Moore et al. (1998) Moore B., Governato F., Quinn T., Stadel J., Lake G., 1998, ApJ, 499, L5
- Muratov & Gnedin (2010) Muratov A. L., Gnedin O. Y., 2010, ApJ, 718, 1266
- Murphy et al. (2011) Murphy J. D., Gebhardt K., Adams J. J., 2011, ApJ, 729, 129
- Napolitano et al. (2009) Napolitano N. R. et al., 2009, MNRAS, 393, 329
- Navarro et al. (1996) Navarro J. F., Frenk C. S., White S. D. M., 1996, ApJ, 462, 563
- Neilsen & Tsvetanov (1999) Neilsen E. H., Tsvetanov Z. I., 1999, ApJ Letters, 515, L13
- Ocvirk & Aubert (2011) Ocvirk P., Aubert D., 2011, 1108.1193
- Oke et al. (1995) Oke J. B. et al., 1995, PASP, 107, 375
- Ostriker & Gnedin (1996) Ostriker J. P., Gnedin N. Y., 1996, ApJ, 472, L63
- Ouchi et al. (2010) Ouchi M. et al., 2010, ApJ, 723, 869
- Parmentier & Grebel (2005) Parmentier G., Grebel E. K., 2005, MNRAS, 359, 615
- Peng et al. (2006) Peng E. W. et al., 2006, ApJ, 639, 95
- Pentericci et al. (2011) Pentericci L. et al., 2011, ApJ, 743, 132
- Pipino et al. (2007) Pipino A., Puzia T. H., Matteucci F., 2007, ApJ, 665, 295
- Pota et al. (2011) Pota V., Forbes D. A., Brodie J. P., Romanowsky A. J., et a., 2011, MNRAS in prep.
- Power et al. (2009) Power C., Wynn G. A., Combet C., Wilkinson M. I., 2009, MNRAS, 395, 1146
- Prada et al. (2011) Prada F., Klypin A. A., Cuesta A. J., Betancort-Rijo J. E., Primack J., 2011, arXiv:1104.5130
- Press & Schechter (1974) Press W. H., Schechter P., 1974, ApJ, 187, 425
- Proctor et al. (2009) Proctor R. N., Forbes D. A., Romanowsky A. J., Brodie J. P., Strader J., Spolaor M., Mendel J. T., Spitler L., 2009, MNRAS, 398, 91
- Rhode et al. (2010) Rhode K. L., Windschitl J. L., Young M. D., 2010, The AJ, 140, 430
- Rhode et al. (2007) Rhode K. L., Zepf S. E., Kundu A., Larner A. N., 2007, The AJ, 134, 1403
- Rhode et al. (2005) Rhode K. L., Zepf S. E., Santos M. R., 2005, ApJ, 630, L21
- Robertson et al. (2010) Robertson B. E., Ellis R. S., Dunlop J. S., McLure R. J., Stark D. P., 2010, Nature, 468, 49
- Romanowsky et al. (2011) Romanowsky A. J., Strader J., Brodie J. P., et a., 2011, ApJ, submitted
- Romanowsky et al. (2009) Romanowsky A. J., Strader J., Spitler L. R., Johnson R., Brodie J. P., Forbes D. A., Ponman T., 2009, AJ, 137, 4956
- Salvaterra et al. (2011) Salvaterra R., Ferrara A., Dayal P., 2011, MNRAS, 414, 847
- Santos (2003) Santos M. R., 2003, p. 348
- Scannapieco et al. (2004) Scannapieco E., Weisheit J., Harlow F., 2004, ApJ, 615, 29
- Shapiro et al. (2010) Shapiro K. L., Genzel R., Förster Schreiber N. M., 2010, MNRAS, 403, L36
- Shen & Gebhardt (2010) Shen J., Gebhardt K., 2010, ApJ, 711, 484
- Sheth & Tormen (1999) Sheth R. K., Tormen G., 1999, MNRAS, 308, 119
- Spitler (2010) Spitler L. R., 2010, MNRAS, 406, 1125
- Spitler & Forbes (2009) Spitler L. R., Forbes D. A., 2009, MNRAS, 392, L1
- Spitler et al. (2008a) Spitler L. R., Forbes D. A., Beasley M. A., 2008a, MNRAS, 389, 1150
- Spitler et al. (2008b) Spitler L. R., Forbes D. A., Strader J., Brodie J. P., Gallagher J. S., 2008b, MNRAS, 385, 361
- Srbinovsky & Wyithe (2010) Srbinovsky J. A., Wyithe J. S. B., 2010, PASA, 27, 110
- Strader et al. (2007) Strader J., Beasley M. A., Brodie J. P., 2007, AJ, 133, 2015
- Strader et al. (2006) Strader J., Brodie J. P., Spitler L., Beasley M. A., 2006, AJ, 132, 2333
- Strader et al. (2011) Strader J. et al., 2011, ApJSS, 197, 33
- Trujillo-Gomez et al. (2011) Trujillo-Gomez S., Klypin A., Primack J., Romanowsky A. J., 2011, ApJ, 742, 16
- van den Bergh (2001) van den Bergh S., 2001, ApJ, 559, L113
- Vesperini et al. (2003) Vesperini E., Zepf S. E., Kundu A., Ashman K. M., 2003, ApJ, 593, 760
- Weinmann et al. (2007) Weinmann S. M., Macciò A. V., Iliev I. T., Mellema G., Moore B., 2007, MNRAS, 381, 367
- White & Springel (2000) White S. D. M., Springel V., 2000, p. 327
- Widrow et al. (2008) Widrow L. M., Pym B., Dubinski J., 2008, ApJ, 679, 1239
- Willott et al. (2010) Willott C. J. et al., 2010, The AJ, 139, 906
- Wise & Abel (2008) Wise J. H., Abel T., 2008, ApJ, 684, 1
- Wolf et al. (2010) Wolf J., Martinez G. D., Bullock J. S., Kaplinghat M., Geha M., Muñoz R. R., Simon J. D., Avedo F. F., 2010, MNRAS, 406, 1220
- Xue et al. (2008) Xue X. X. et al., 2008, ApJ, 684, 1143
- Yan et al. (2010) Yan H., Windhorst R. A., Hathi N. P., Cohen S. H., Ryan R. E., O’Connell R. W., McCarthy P. J., 2010, Research in A&A, 10, 867
- Zinn (1985) Zinn R., 1985, ApJ, 293, 424