Femtosecond Population Inversion and Stimulated Emission
of Dense Dirac Fermions in Graphene
Abstract
We show that strongly photoexcited graphene monolayers with fs pulses quasi-instantaneously build up a broadband, inverted Dirac fermion population. Optical gain emerges and directly manifests itself via a negative conductivity at the near-infrared region for the first 200fs, where stimulated emission completely compensates absorption loss in the graphene layer. Our experiment-theory comparison with two distinct electron and hole chemical potentials reproduce absorption saturation and gain at fs, revealing, particularly, the evolution of the transient state from a hot classical gas to a dense quantum fluid with increasing the photoexcitation.
pacs:
78.67.Wj, 73.22.Pr, 78.47.J-,78.45.+hGraphene is gradually emerging as a prominent platform for ultrafast photonics and optoelectronics BonaccorsoNaturephotonics2010 ; RMP2009 ; KFM2008 . Growing evidence was demonstrated in, e.g., broadband transparency and universal absorption from the near-infrared to visibleNairScience2008 , carrier dynamics DawlatyAPL2009 , saturable absorption SunACSNano2010 , pulsed photoluminescence LuiPRB2010 ; LuiPRL2010 ; StohrPRB2010 , and coherently-driven photo-currents SunNanoLett2010 . For graphene to play a significant role in ultrafast laser technology or telecommunications that exceed semiconductor nanostructure performance, it is vital to investigate femtosecond nonlinearities of strongly photoexcited states. Prior time-resolved studies in graphene have been mostly concerned with the weak excitation regime where the photoexcited carrier density is much smaller than the initial background carrier density. In this case a linear power dependence of transient signals was observed DawlatyAPL2009 ; BreusingPRL2009 ; NewsonOE2009 ; SunPRL2008 .
Ultrafast photoexcitations strongly alter the thermodynamic equilibrium of electronic states and lead to a series of temporally overlapping rapid processes in graphene, as illustrated in Fig. 1(a). First, during or immediately following the pulse duration , photoexcitations are . Then, electron-electron collisions lead to decoherence and eventually to a quasi-thermal transient distribution after a time . Finally, for longer times via coupling to phonons, the system relaxes back to equilibrium via cooling of the hot carriers () and recombination of electron-hole pairs (). In most semiconductors and their nanostructures, where for 10 fs laser pulses oudarPRL1985 , ultrafast nonlinear photoexcitations lead to a largely non-thermal, peaked distribution close to the pump photon energy and state filling dominates on the 10s of fs time scale [first panel, Fig. 1(b)].
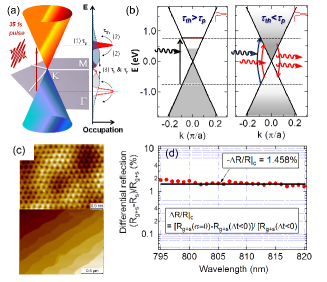
In this letter, we demonstrate that graphene is in the opposite limit for 35 fs pulses, where a broadband quasi-equilibrium, yet population inverted dense Fermi system emerges during the pulse propagation. The photoexcited phase space is quickly depleted via carrier-carrier collisions, leading to band filling [second panel of Fig. 1(b)]. Most intriguingly, we demonstrate that broadband gain emerges below the excitation photon energy via stimulated emission. The broadband optical gain directly manifests itself via a remarkable negative conductivity at the near-infrared probe energy detuning even 400 meV below the excitation level within hundreds of fs. These results can be quantitatively described in terms of distinct electron and hole chemical potentials, which evolves from a hot classical gas to a dense quantum fluid with increasing the excitation from the linear to the highly nonlinear regime. Such femtosecond build-up of high-density and broadband population inversion has implications in advancing gaphene-based above-terahertz speed modulators, saturable absorbers and gain mediums.
A Ti:Sapphire amplifier with central wavelength (eV) and is used to pump an optical parametric amplifier (900-2400 nm) to produce near-infrared probes below the 1.55 eV excitation. Ultrafast degenerate and non-degenerate differential reflectivity changes with fs time resolution are recorded with tunable pump fluences, which exhibits no pump polarization dependence. Our epitaxial graphene monolayer sample was grown by thermal annealing in ultrahigh vacuum on a Si-terminated 6H-SiC(0001). The Fermi energy is eV in the sample (Fig. 1b) reflecting the substrate-induced electron doping as reported GierzNanoLett2008 ; Hupalo09 . Fig.1(c) shows the STM characterizations of tomography of our samples used, which show homogenous carbon monolayer in atomic length scales (top) and scales with smooth overgrowth on the steps of SiC surface (bottom). The strong dependence of the R30 reconstruction modulation with the bias voltage confirm the single layer graphene, with the homogeneity of the sample better than 90 across the entire probe region. The monolayer thickness is further confirmed by the optical deferential reflection spectra [Fig. 1(d)], determined by the measurements with (Rg+s) or without (Rs) graphene on SiC substrate.
To understand optical response in graphene, we expand the solution of the Fresnel equation with respect to (of the order of the fine structure constant of quantum electrodynamics ) and obtain (also see supplementary)
| (1) |
Re is the real part of the complex optical conductivity. Eq.(1) leads to two key aspects: (i) the reflection coefficient provides a direct measurement (or absorption) without reference to any model assumption,e.g., ; (ii) using the established universal value for graphene monolayer without pulse RMP2009 ; KFM2008 , there exists a threshold value for the photoinduced differential reflectivity that corresponds to the transition to a negative optical conductivity and thus to gain behavior . With for SiC substrate follows , which can be determined experimentally by measuring differential reflectivity the optical spectra [Fig. 1(d)]. Here the reflection from the zero conductivity state in the pumped garphene/SiC sample exactly corresponds to the case of bare SiC substrate. Critical to note also the negative represents the hallmark for the existence of gain in the excited graphene layer, which should not be confused with the refection loss in the substrate.
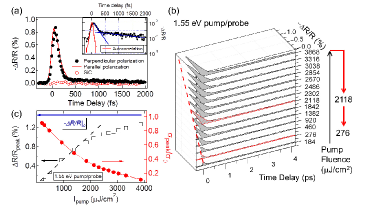
Next we present ultrafast degenerate reflectivity spectroscopy to reveal femtosecond nonlinear saturation. A typical temporal profile of at 1.55 eV in the graphene monolayer (black dots) is shown in Fig. 2(a), clearly showing a negative transient signal. Note the photoinduced change is negligible in the controlled experiment using the SiC substrate without graphene (red circles). Several temporal regimes can be identified in the logarithmic scale plot in the inset: a pulse width limited rise fs (red line), followed by a bi-exponential decay of fs and ps (blue lines). The power dependence of photoinduced at the maximum of in Fig. 2(b) reveals a clear nonlinear behavior. Fig. 2(c) summarizes at the signal peak for different pump fluences , showing a nonlinear pump fluence dependence above , at least one order of magnitude higher than what is reported for semiconducting single-walled carbon nanotubes WangPRL2010 . Following Eq.(1), the measured allows us to obtain the corresponding peak conductivity in photoexcited graphene, as shown by the red dot in Fig. 2(c) (normalized by ). At the highest pump fluence used , peak appoaches 90 of the critical value and the peak conductivity drops to only 10 of .
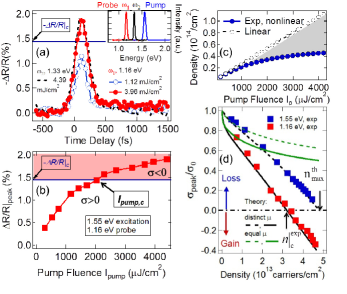
The most striking response is obtained after ultrafast non-degenerated differential reflectivity. Fig. 3(a) shows dynamics using 1.55 eV pump and low energy probes at 1.16 eV and 1.33eV. It is clearly visible that, at high pump fluence, the critical value , the threshold for negative conductivity (blue lines), indeed occurs for both cases. With increasing pump fluence, Fig. 3(b) indicates that, above , the stimulated infrared emission surpasses absorption loss in the photoexcited graphene for the 1.16 eV probe. The temporal profiles for pump fluence above the gain threshold indicate that the negative conductivity can persist for hundreds of fs, e.g., the 3960 at 1.16 eV. We emphasize three key aspects of this conclusion: (i) the critical value has not been reached by the degenerate pump/probe [Fig. 2(c)] and appears exclusively for non-degenerate condition when probing below 1.55 eV, (ii) the is a model independent value that corresponds to , which directly indicates the transition from loss to gain behavior, (iii) the femtosecond emergence of stimulated emission even at the 400 meV below the excitation level indicates very rapid establishment of broadband population inversion and broadband gain in the strongly photoexcited graphene states.
We can extract the number of photoexcited electrons in graphene immediately after the laser pulse from
| (2) |
where is the Gaussian pulse envelop , normalized such that the total pulse fluence is . For , the absorption coefficient is determined by the adiabatic dependence of the absorption on the pump fluence and can be derived from the measured saturation curve at 40 fs (Fig. 2c) by (see supplementary). Without pump, the absorption of a graphene monolayer on SiC is . Using the actual absorption , instead of , is crucial as the linear relation substantially overestimates during the pulse propagation, as shown in Fig. 3(c). From Eq.(3), we extract from the data extremely dense photo-excited fermions cm-2 for our electron doped sample, surpassing the saturation in a nm GaAs quantum well by more than two orders of magnitude under the similar excitation condition chemlaIEEE1984 .
Next we analyze the transient state at . Immediately after the pulse at = 40fs, energy of the electronic system is conserved because no relaxation into the phonon system has taken place yet. In the case of highly excited graphene, the phase space constraint of the Dirac spectrum leads to an approximate conservation of numbers of photoexcited holes and electrons, valid to the second order in the electron-electron Coulomb interaction Fritz08 ; Foster09 . A recent explicit analysis of the short time dynamics by Winzer et al. indicates that the conservation of hole and electron numbers is a good approximation for the high excitation regime WinzerNL . Consequently, this gives rise to a slow imbalance relaxation and thus to a population inverted transient state with quasi-conserved occupations of the two branches of the Dirac cone in our experimental condition. These, together with the assumption that a decohered, quasi-thermal state leads to the non-equilibrium transient distribution function ():
| (3) |
characterized by the electron temperature, and two distinct chemical potentials and , for electrons in the upper and holes in the lower branch of the spectrum, respectively. Note that a scenario based on a single chemical potential does not explain the demonstrated population inversion. In thermodynamic equilibrium holds and . In general, and are functions of given photon energy, , total density, and density of photoexcited carriers, (see supplementary section). The non-equilibrium optical conductivity is calculated in Keldysh formalism Keldysh and follows as
| (4) |
Fig. 3(d) compares the peak transient conductivity with the calculated conductivity of Eq.4 as function of for two probe photon energies 1.55 eV and 1.16 eV. Excellent agreement between experiment and theory is found which demonstrates the faithful representation of the transient state at fs by the distribution function, Eq.3. For the degenerate scheme, our theory (black dashed line) yields and thus perfect transparency for cm-2. Once the systems is driven into this regime, a balance between stimulated emission and absorption will lead to a transprancy. For non-degenerate scheme by probing at 1.16 eV, our theory (black solid line) predicts a critical density cm-2 for the transition from loss to gain. All of these results agree quantitatively with the experimental values cm-2 and cm-2, respectively (black arrows) note . In addition, the experiment-theory comparison of the conductivity is shown in Fig. 3d for the distinct- (black lines) and the equal-chemical-potential model (green lines) at the probe photon energy and , which clearly identifies the validity of the distinct- model calculation.
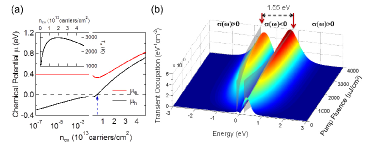
The detailed information of the transient state at 40 fs as a function of is shown in Fig. 4(a) for the transient chemical potentials and carrier temperature (inset). For weak excitation (but larger than the number of thermally excited carriers before the pulse) we find while , corresponding to a hot, dilute gas of classical holes. Increasing nex changes the sign of the hole chemical potential () and eventually decreases Te, i.e. as a function of pump fluence we enforce a crossover from a hot and dilute Maxwell-Boltzmann gas to a degenerate population inverted quantum system, with measuring the degree of population inversion note2 . Most notably, the transient conductivity, , of Eq.(4) changes sign if crosses , with broadband optical gain due to population inversion for the entire region (), as illustrated between two intersection planes in Fig. 4(c). The separation between the planes is shown to approach to the pump energy 1.55eV at high excitation density, consistent with our experiment.
We have showed the existence of pronounced femtosecond population inversion and near-infrared gain in strongly photoexcited graphene monolayers. These results clearly reveal the transient electron and hole potentials are separated on the time scale of 100s of fs. Our experimental-theory comparison explains well of the absorption saturation and gain from the dense fermions, and reveals a crossover from a hot Maxwell-Boltzmann gas to a degenerate dense Fermi-Dirac system.
This work was supported by by the U.S. Department of Energy-Basic Energy Sciences under Contract No. DE-AC02-07CH11358. J.S. acknowledges support by the Deutsche Forschungsgemeinschaft through the Center for Functional Nanostructures within subproject B4.5.
References
- (1) F. Bonaccorso et. al., Nature Photonics 4, 611-622 (2010)
- (2) A. H. Castro Neto et al., Rev. Mod. Phys. 81, 109 (2009)
- (3) Kin Fai Mak, et al., Phys. Rev. Lett. 101,196405 (2008).
- (4) R.-R. Nair et al., Science , 6, 1308 (2008).
- (5) J.-M. Dawlaty et al., Appl. Phys. Lett. 92, 042116 (2008); P.-A. George et al., Nano Lett. 8(12), 4248 (2008); H. Choi et al., Appl. Phys. Lett. 94, 172102 (2009).
- (6) Z. Sun et al., ACS Nano. 4(2), 803 (2010); Q. Bao et al., Advanced Functional Materials 19, 3077 (2009).
- (7) R.-J. Sthr et al., Phys. Rev. B 82, 121408 (2010).
- (8) C.-H. Liu et al., Phys. Rev. Lett. 105, 127404 (2010).
- (9) W. Lui et al., Phys. Rev. B 82, 081408 (2010).
- (10) D. Sun et al., Nano Lett. 10(4), 1293 (2010).
- (11) M. Breusing et al., Phys. Rev. Lett. 102, 086809 (2009).
- (12) R.-W. Newson et al., Optics Express 17, 2326 (2009).
- (13) D. Sun et al., Phys. Rev. Lett. 101, 157402 (2008).
- (14) J.-L.Oudar et al., Phys. Rev. Lett. 55, 2074 (1985)
- (15) I. Gierz et al., Nano Lett. 8, 4603 (2010);
- (16) M. Hupalo et al., Phys. Rev. B 80, 041401(R) (2009).
- (17) J. Wang et al, Phys. Rev. Lett. 104, 177401 (2010).
- (18) D. S. Chemla et al., IEEE J. Quant Electron. 20, 265 (1984).
- (19) L. Fritz et al., Phys. Rev. B 78, 085416 (2008).
- (20) M. S. Foster et al., Phys. Rev. B 79, 085415 (2009).
- (21) Torben Winzer et al., Nano. Lett. 10, 4839 (2010)
- (22) L. V. Keldysh, Sov. Phys. JETP 20, 1018 (1965).
- (23) This extremely good agreement between theory and experiment clearly corroborates fs (). The 70 fs and 2.5 ps relaxation components in Fig. 2a can then be naturally assigned to the cooling of hot carriers and recombination of electron-hole pairs .
- (24) Our analysis for the low photoexcited carrier density and longer, ps relaxation are consistent with the behaviors found in kim2011
- (25) R. Kim et al. Phys. Rev. B 84, 075449 (2011)