Vibrational and Thermal Properties of ZnX (X=Se, Te): Density Functional Theory (LDA and GGA) versus Experiment
Abstract
We calculated the phonon dispersion relations of ZnX (X=Se, Te) employing ab initio techniques. These relations have been used to evaluate the temperature dependence of the respective specific heats of crystals with varied isotopic compositions. These results have been compared with measurements performed on crystals down to 2 K. The calculated and measured data are generally in excellent agreement with each other. Trends in the phonon dispersion relations and the corresponding densities of states for the zinc chalcogenide series of zincblende-type materials are discussed.
pacs:
63.20.-e, 63.20.dk, 63.20.D-, 68.35.bg, 65.40.Ba, 71.55.Gs, 71.70.EjI Introduction
In an ongoing effort to characterize the vibrational and thermal properties of multinary semiconductors and semimetals of current interest we have recently focused our attention on binary and ternary chalcogenides, such as HgX (X=S, Se, Te), CuGaS2 or ZnS in the zinc-blende (zb) and rocksalt structure.Cardona2009 ; Romero2008 ; Cardona2010b ; Romero2011 ; Cardona2010a Most of our past experimental work has been concerned with the specific heats in the low-temperature regime where deviations from the Debye- power law can be easily studied. Such deviations arise from low-energy phonon branches with low dispersion, typically zone-boundary transverse acoustic (TA) phonon branches. Ab initio calculations of the specific heat () based on the electronic structure derived from local density functionals have been carried out and compared in detail with the experimental results. They were found to account rather well for the experimental data and, in some cases, confirm our experimental results where large deviations from previously published measurements were encountered, e. g. for GaN.Kremer2005 For most of our investigated systems, by selective isotope substitution we could effect incremental variations of the low-temperature heat capacities.Gibin2005 The small changes of the heat capacities induced by selective isotope substitution are generally very well described by density functional theory (DFT) and were advantageously used to contrast the calculations with experimental data. The ab initio calculations were done employing the two most common approximations for the density functional of the exchange and correlation energy, the local density approximation (LDA) and the generalized gradient approximation (GGA) implemented in various DFT codes. Usually, LDA and GGA results bracket the experimental data. For example, LDA tends to underestimate the lattice parameters and the cell volume, while the GGA approximation overestimates them. This has lately been discussed by us, for example, for ZnS, the cubic mercury chalcogenides HgX (X=S, Se, Te) and cinnabar (-HgS). For systems including heavy elements we have also tested the effect of including spin-orbit (SO) interaction into the DFT calculations. For -HgS, SO coupling was found to give a negligible effect on the thermal properties. However, the heat capacity and also the phonon dispersion relations of the semimetal Bi can be noticeably better described if SO interaction is included in the DFT calculations.Diaz2007 SO interaction effects on the thermal properties are less pronounced for Sb, another semimetal.Serrano2008 The relativistic electronic structures which results from our calculations enabled us to study a number of interesting band structure effects such as linear SO splittings of the valence band near the origin of the Brillouin zone.Cardona2009 ; Cardona2010b In addition to this program, also various DFT implementations (ABINIT and VASP) have been compared with each other and probed against the experimental data.
In the present contribution we extend our investigations to the thermal and vibrational properties of the binary semiconductor ZnSe and ZnTe. ZnSe and ZnTe crystallize at normal pressure and temperature in the cubic zb structure. ZnSe is a wide-band-gap II-VI semiconductor with a gap of 2.8 eV while the band-gap of ZnTe is smaller and amounts to 2.2 eV. Because of its superior wide range infrared low-temperature optical transmittance ZnSe has gained technological importance for application as infrared transparent optical components, such as windows. ZnTe can be easily doped and found applications in optoelectronics, e.g. for blue light-emitting diodes and solar cells.
The vibrational and thermal properties of ZnSe and ZnTe have been the subject of a number of studies. Initially the comparison of experimental data such as the phonon dispersion branches of ZnSe and ZnTe with inelastic neutron scattering (INS) (Ref. Hennion1971, ; Vagelatos1974, ) or the heat capacities with theoretical approaches remained on the semiempirical level.Plumelle1974 ; Talwar1981 ; Kushwaha2010 These early investigations have been extended recently to ab initio LDA and GGA calculations using up-to-date implementations of the DFT method. LDA results have been compared with the INS phonon energies and the heat capacities and found to be in good agreement.Corso1993 ; Petzke1997 ; Hamdi2006 Hamdi et al. have also calculated the structural parameters of ZnSe and compared them with experimental and other available theoretical data.Hamdi2006 Recently, Tan et al. have used DFT-GGA calculations to study the pressure induced phase transitions from the zb to the rocksalt structure.Tan2010 They also performed calculations of the phonon dispersion relations and heat capacities of ZnSe and ZnTe with the DFT-GGA CASTEP code.Castep Unfortunately, the results of these calculations have not been compared with the available experimental data in more detail.
Investigations of isotope substitution of the atomic masses of either Zn/(Se,Te) or simultaneously of both constituents simultaneously, on the properties of ZnX (X = Se, Te) appear to be rather scarce. To the best of our knowledge, the only available studies are a theoretical investigation of the temperature and mass dependence of the lattice constants, the temperature dependence of the linear thermal expansion coefficient and the mode Grüneisen parameters upon isotopic substitution in ZnSe using perturbation theory in a density-functional framework.Debernardi1996 Also, available is an experimental investigation of the Raman and excitonic spectra with different isotopic compositions.Goebel1998 In Ref. Goebel1998, an interesting dependence of the linewidth of the Raman spectra of ZnSe on isotope disorder was discovered.
We have recently demonstrated that changes of the specific heats due to the isotope substitution, even though sometimes very small, can be revealed by careful experiments even on very small crystalline samples.Cardona2010b Especially, we have shown that the logarithmic derivatives with respect to the atomic masses , / are a very sensitive and useful tool to highlight small alterations of the specific heats since the logarithmic derivative eliminates, to a large extent, systematic experimental errors. In binary and multinary compounds the logarithmic derivatives particularly allowed us to reveal the influence of variations of the atomic masses on the phonon spectrum and to compare with the calculated phonon density of states (PDOS). We have also proposed and tested a sum rule which relates the sum of the logarithmic derivatives of with respect to the atomic masses with the logarithmic derivative with respect to temperature.Cardona2007
The low-temperature heat capacities of ZnSe have been the subject of two preceding experimental studies carried out in the 1970s by Irwin and La Combe Irwin1974 and by Birch.Birch1975 However, the two previous heat capacity data sets just overlap in the temperature range of the maximum which for ZnSe occurs at about 20 K: in order to enable a meaningful comparison, e.g. with the logarithmic derivatives, and to test the sum rule a repetition of the measurements on a ZnSe sample with natural isotope composition was found necessary. We therefore carried out measurements of the heat capacities on a series of samples with various isotope combinations with special emphasis on the low-temperature regime. For ZnTe heat capacity data are available only down to 15 K.Irwin1974 ; Demidenko1969 ; Gavrichev2002 The data from the different authors deviate significantly from each other, especially in the temperature regime where the maximum in is expected. We therefore repeated and extended the heat capacity measurement on ZnTe down to 2 K. Our measurements reveal clearly the maximum in at 14 K. Additionally, our low temperature heat capacity data enable us to extract very reliably the Debye temperatures for 0 K, for ZnSe and ZnTe.
The comparison of our experimental data and literature data of the phonon dispersion obtained by INS experiments with the calculations reveal significantly better agreement with the LDA while the GGA data deviate noticeably from the experiments. The analysis of the total and the partial phonon densities of states and the comparison with that of ZnS (Ref. Cardona2010a, ) highlights the close similarities of the PDOS of ZnX (X = S, Se, Te). It also reveals the compression of the frequency scales with increasing masses of the chalcogen atom. The PDOSs projected on the Zn and the X atoms shows an interesting trend on going from S to Te. While in ZnS the acoustical and optical phonons can be clearly attributed to vibrations of the Zn and S atoms, respectively, the situation is reversed for ZnTe. Here the optical branches emerge essentially from vibrations of the lighter Zn atoms. For ZnSe, with almost equal masses of the Zn and the Se atoms, the acoustical and optical phonon branches arise from combined vibrations of Zn and Se, respectively.
II Theoretical Details
For the calculations reported here we have made use of density functional theoryHohenberg1964 ; Kohn1965 as implemented in the ABINIT package Abinitref . Two different exchange-correlation functionals (LDA, GGA) were tested but most of our results are based on the LDA approach, basically because it gives a much better agreement with experimental data.
In the ABINIT package we have utilized a linear response approachBaroni1987 ; Gonze1997A ; Gonze1997B together with an iterative minimization norm-conserving pseudopotential plane-wave method.Gonze2002 These pseudopotentials are single projector, ordinary norm conserving, based on the Troullier-Martins method.Hamann1979 ; Troullier1991 ; Payne1992 12 and 6 ”valence” electrons were used for Zn and Se, respectively. A 40 Ry cutoff was set for the plane wave expansion and an 8 8 8 k-point grid regularly shifted along four different directions, with a total of 60 k-points for the ground state calculation and 2048 k-points for the vibrational response part. The calculations converged well: increasing the plane-wave cutoff to 50 Ry and the k-points mesh to 10 10 10 yielded, on average, a change of less then two percent in the phonon frequencies. For the phonon frequencies we have used a q-mesh of 12 12 12, to guarantee a good coverage of the dispersion relations. The dynamical matrices were obtained from perturbation theoryGonze1997A ; Gonze1997B and a Fourier interpolation was employed in order to increase the mesh sampling and to improve the description of quantities such as vibrational density of states and heat capacities.
III Experimental
zb-ZnSe and zb-ZnTe crystals with different isotopic compositions: natZn natSe/Te i.e., Zn and Se/Te with natural isotope composition, 64Zn 76Se, 64Zn 80Se, 68Zn 76Se, and 68Zn 80Se, 68Zn natTe, and natZn 130Te, were grown by vapor phase transport as described in detail previously.Lauck1999 . Larger zb-ZnTe crystals with the natural isotope composition were obtained by a modified Piper-Polich method in a semi-open quartz-glass ampoule.Lauck1986a ; Lauck1986b The heat capacities of crystalline pieces of these samples, typically of 20 - 100 mg weight, were measured between 2 and 280 K with a physical property measurement system (Quantum Design, San Diego, CA) as described in detail in Ref. Serrano2006
IV Lattice Dynamics
In Figure 1(a) and (b) and we display the calculated phonon dispersion relations of ZnSe along selected directions of the Brillouin zone (BZ). For comparison we have plotted our LDA and GGA results and the INS data reported by Hennion et al.Hennion1971 The LDA calculations are overall in good agreement with the experimental findings, as has also been observed by Dal Corso et al. Corso1993 The results of the GGA calculation deviate markedly, especially for the optical branches.
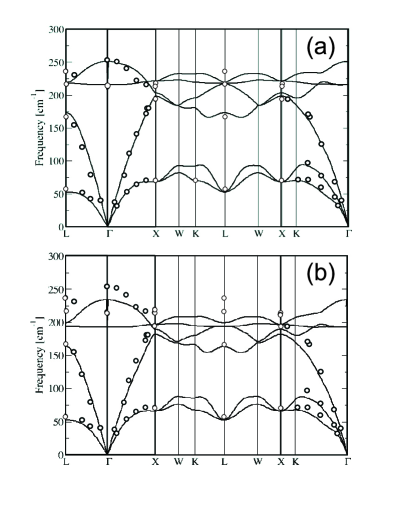
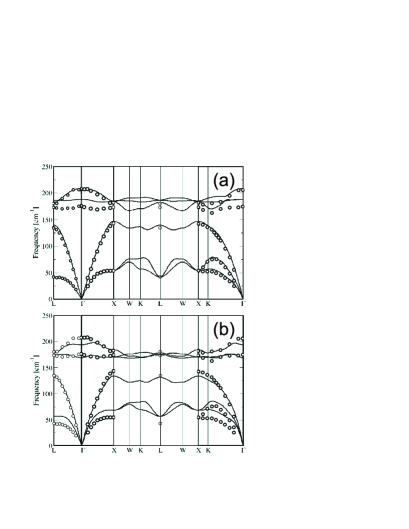
Figure 2(a) and (b) show the comparison of the LDA and GGA calculations for ZnTe with the INS data collected by Vagelatos et al..Vagelatos1974 As already observed by Dal Corso et al. the agreement of the experiment with the DFT-LDA calculations is excellent, especially for the acoustical branches. The longitudinal optical branches are equally well reproduced by the calculations, while the transverse optical branches fall short by about 5%. The DFT-GGA results agree well with the optical branches while the energies of transverse acoustical branches lie systematically below the experimental data.
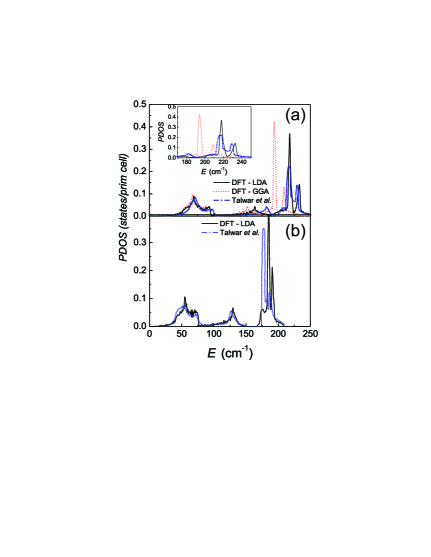
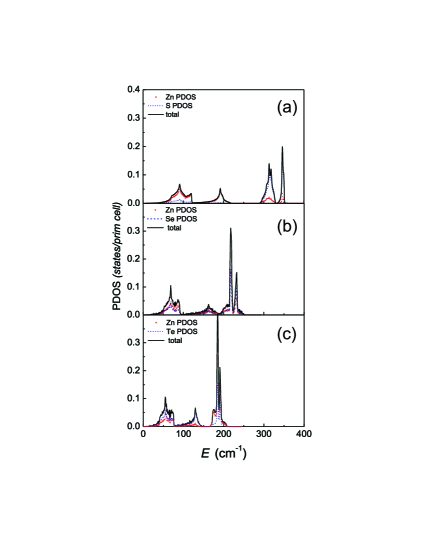
The total PDOS and the PDOS projected on the two constituting elements as obtained by the LDA calculations, are displayed in Fig. 3. For comparison we also show the PDOS of ZnSe and ZnTe derived by Talwar et al. from a rigid-ion-model.Talwar1981 In Figure 4 we also added the PDOS of ZnS as published by us recently.Cardona2010a Very similar to the PDOS of ZnS the PDOSs of ZnSe and ZnTe exhibit two dominating features, one between 50 and 100 cm-1, arising essentially from acoustic phonon branches, and a sharp double peak at higher energies corresponding to the the optical phonons. The energies of the latter peaks decrease markedly as one substitutes S by Se and Te. These two main peak groups are separated by a gap in which a small mid-gap peak is located. While the low-energy peak in the PDOS of ZnSe is largely independent of the computational approach the mid-gap feature and the sharp optical phonon double-peak obtained from the GGA calculations are down-shifted, the latter by about 10% as compared to the LDA result. Except for the mid-gap peak the LDA PDOS is generally in good agreement with results of the rigid-ion-model used by Talwar et al..Talwar1981
It is of interest to compare the projected PDOS of the three systems ZnX (X =S, Se, Te) (see Fig. 4). For the ZnS the acoustical and the high energy optical phonon branches arise essentially from vibrations of Zn and S, respectively. Due to the reversal of the masses of the two constituents in ZnTe (Zn: 65 a.m.u.; Te: 128 a.m.u) the situation is reversed for ZnTe. There the acoustical phonons arise from Te vibrations and the optical ones from vibrations of the lighter Zn atoms. Due to the very similar atomic masses of Zn and Se acoustical and optical phonon branches for ZnSe comprise mixed Zn and Se vibrations.
V Heat Capacity
By using the calculated PDOS() we obtained the free energy, and the heat capacity (at constant volume), according toCvCp
| (1) | |||||
| (2) |
where is the Boltzmann constant and the Bose-Einstein factor. The cut-off in PDOS at the highest phonon frequency, defines the upper limit of integration.
Figure 5 and 6 display the calculated heat capacities, of ZnSe and ZnTe for different isotope mass compositions in the representation which is chosen to emphasize the broad peak at low temperature. For ZnSe the maximum is found at 17.2 K and for ZnTe it moves down to 13.5 K. The broad peak in the representation of the heat capacity has been demonstrated to arise from regions of low dispersion of zone-boundary acoustical phonons which also give rise to the low-energy peaks in the PDOS.Cardona2007 They appear at 68.6 cm-1 and 55.1 cm-1 for ZnSe and ZnTe, respectively. We again find a ratio 6 for the energies of the acoustical phonon peaks and the peak temperature in the representation, close to what has been typically observed for several semiconductors before.Cardona2010b
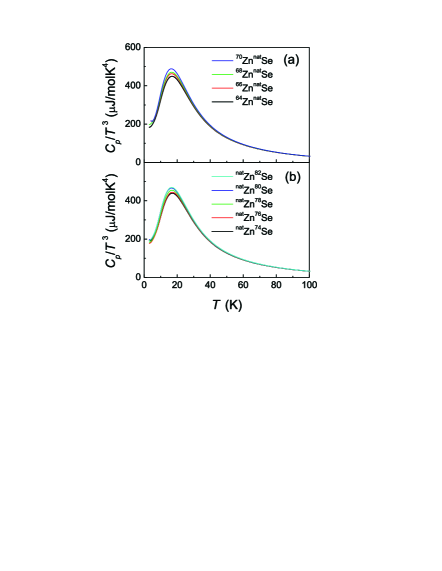
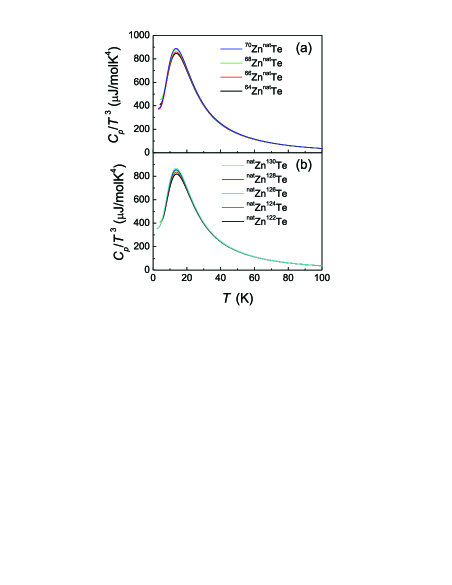
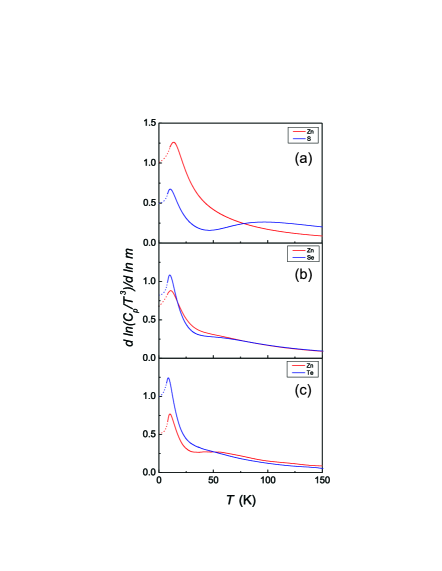
The peak value of for ZnTe is by almost a factor of two larger than that of ZnSe at 17.2 K, reflecting the lattice softening when Se is replaced by Te. Isotope mass increases lead to small growth of the heat capacities, which become clearly visible as slight changes of the maximum value of the peak. Below we will discuss the logarithmic derivatives of which reveal that the variation of the isotope masses changes the heat capacities in different temperature regimes. Figure 7 displays the logarithmic derivatives, /, with respect to the isotope mass, , of the two constituting elements, Zn and either Se or Te, respectively. For completeness we have also included the analog graphs for ZnS.Cardona2010a For the latter there is a clear differentiation between the derivative vs the masses of Zn and S. Similar sharp peaks at low temperature, with that of S significantly smaller in magnitude than that of the Zn derivative, have been attributed to a considerable S component in the TA vibrations which have mainly Zn character. The characteristic S contribution due to high energy S vibrations shows up as a broad peak centered near 100 K.Cardona2010a Similar derivatives are obtained for ZnSe and ZnTe. However, depending on the relative masses of the constituents Zn and Se/Te the magnitude and the maximum temperatures of the peaks shift. For ZnSe the low-temperature peaks in the derivative are of equal magnitude and a pronounced high-temperature peak is missing. This finding reflects the mixing of Zn- and Se-related vibrations due to the rather similar atomic masses of Zn and Se. For ZnTe the situation is reversed. Here the pronounced peak at low temperature is associated to Te vibrations, while the vibrations of the lighter Zn atoms give rise to a shallow broad peak centered at 70 K. Again, as in ZnS, there is some hybridization of Zn with Te vibrations and a noticeable Zn component in the TA vibrations which now have mainly Te character.
In previous work we have demonstrated that for low temperatures, 0, the logarithmic derivatives are related to the ratios of the atomic mass to the molar mass according to,Serrano2006 ; Cardona2010a ; Romero2011
| (3) |
| (4) |
The dashed lines at low temperatures in Figure 7 represent a free-hand extrapolation for 0 so as to agree with these values.
Our low temperature heat capacities of ZnSe and ZnTe collected on samples with the natural isotope composition are summarized and compared with the results of the DFT-LDA and GGA calculations in Figure 8. The representation reveals low-temperature peaks at 17.0 K and at 13.5 K, for ZnSe and ZnTe, respectively. For ZnSe the data by Irwin et al.Irwin1974 and BirchBirch1975 are in good agreement with our more complete data. Especially, for ZnTe we could resolve the diverging low-temperature heat capacity results obtained before by Gavrichev et al.Gavrichev2002 and Irwin et al.Irwin1974 and extend the temperature range down to 2 K. This was found necessary in order to clearly establish the position and magnitude of the maximum and to enable the calculation of the logarithmic derivatives, discussed below.
The Debye temperatures, , for 0 K are obtained from the experimental data by fitting a power law
| (5) |
to the low-temperature range 2 K 10 K.
For ZnSe we obtained
which is by about 6% larger than the value reported by Birch Birch1975 and somewhat closer to the result (278.5 K) derived from the elastic constants by Lee.Lee1970
For ZnTe we found
which is close to the value from elastic constants measurements 225.3 KLee1970 but significantly larger than the values estimated from x-ray measurements and quoted in review articles (182 K - 210 K).Blattner1972 ; Landolt1999
We finally note that the ratio of the Debye-temperatures, 1.26, is very close to the square-root of the inverse atomic mass ratio of the chalcogenide atoms,
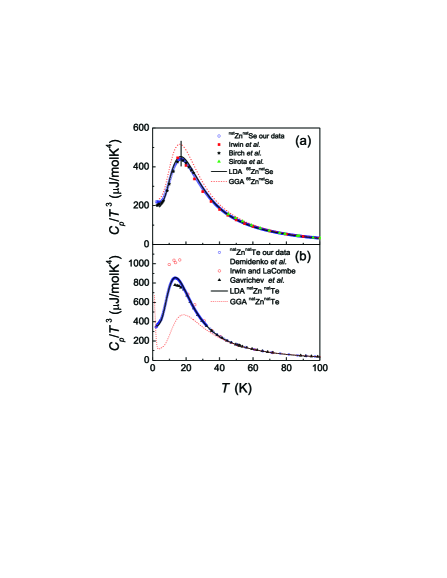
As already observed for the phonon dispersion, the agrement of the heat capacities of ZnSe and ZnTe with the LDA calculations is better than with the GGA results. Especially in the temperature regime of the maximum overestimates/underestimates the experimental data by about 20%/50% for ZnSe and ZnTe, respectively.
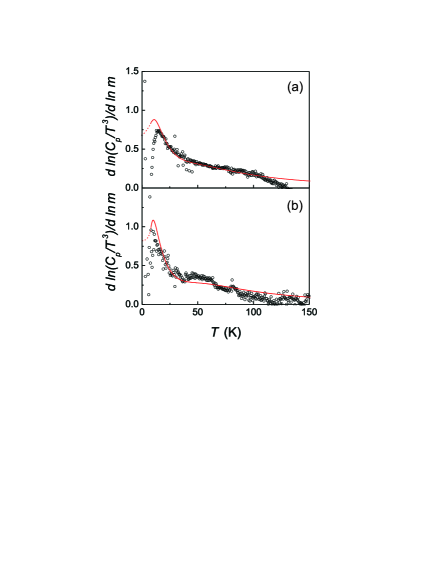
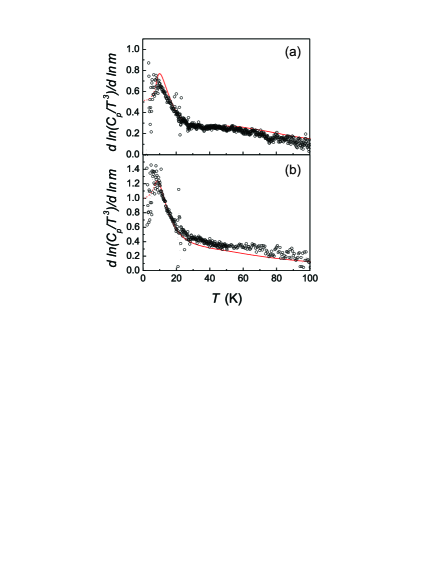
The logarithmic derivatives vs the mass of the isotopes of Zn and Se are summarized in Figure 9. Those for Zn and Te are displayed in Figure 10. The agreement with the LDA calculations in magnitude and position of the low temperature peaks is very satisfactory. For ZnTe, the logarithmic derivative with respect to the isotope mass of the Zn atoms clearly exhibits the broad maximum centered at 50 K due to phonons involving low-energy Zn vibrations.
In previous work, on monatomic crystals we derived a connection between the logarithmic derivative of versus and the corresponding derivative vs the isotopic mass.Gibin2005 For binary and ternary materials, a similar connection was shown to hold provided one adds the two or three logarithmic derivatives with respect to each of the isotope masses.Cardona2007 ; Romero2011
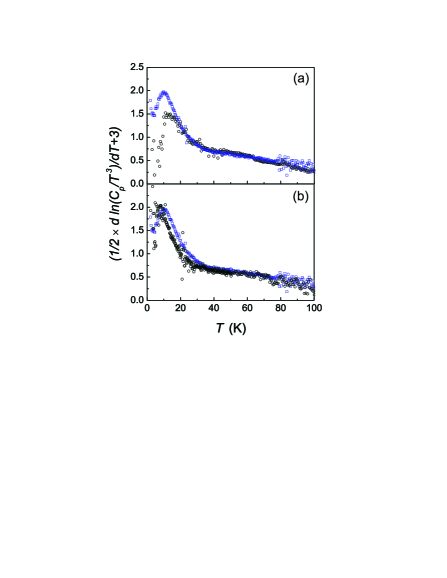
Accordingly, for the relation of the temperature and isotope mass derivatives in a two component system we obtain the expression Romero2008
| (6) |
where (i =1, 2) are the masses of the two constituting elements, i.e. Zn and X = Se and Te, respectively. As demonstrated in Figure 11, the relation given in Eq. (6) is nicely fulfilled for ZnSe and ZnTe, thus lending further support for the proposed sum rule.
VI Conclusions
Up-to-date ab initio electronic structure calculations have now matured and became a powerful tool to study the thermodynamic properties of crystals. Here we demonstrate this for the binary zinc chalcogenides, ZnSe and ZnTe. Both materials are technologically important semiconductors used for optical applications. We have used DFT-LDA and GGA codes to calculate the phonon dispersions and the heat capacities down to lowest temperatures. In the experimental part we extend the available experimental basis and comprehensively determine the heat capacities of ZnSe and ZnTe over the temperature range from 2 K to room temperature and have compared the results with the calculations. Generally, better agreement of the experimental data is found with the DFT-LDA results. Additionally, we measured the heat capacities of isotope substituted samples in order to vary the atomic masses of Zn and Se and Te and to probe the effect of selective isotope substitution on the phonon spectra and the thermodynamic properties. These data are compared with the results of the calculations and found to be in very good agreement. A comparison of ZnS, ZnSe and ZnTe instructively reveals the variation of the phonon spectrum with the variation of the atom mass of chalcogenide atoms.
Acknowledgements.
AHR has been supported by CONACYT Mexico under projects J-152153-F, Binational Collaboration FNRS-Belgium-CONACYT and PPPROALMEX-DAAD-CONACYT. We are indebted to N.N. for a critical reading of the manuscript.References
- (1) M. Cardona, R. K. Kremer, R. Lauck, G. Siegle, A. Muñoz, and A. H. Romero, Phys. Rev. B 80, 195204 (2009).
- (2) A. H. Romero, M. Cardona, R. K. Kremer, R. Lauck, G. Siegle, J. Serrano, and X. C. Gonze, Phys. Rev. B 78, 224302 (2008).
- (3) M. Cardona, R. K. Kremer, G. Siegle, A. Muñoz, A. H. Romero, and M. Schmidt, Phys. Rev. B 82, 085210 (2010).
- (4) M. Cardona, R. K. Kremer, R. Lauck, G. Siegle, A. Muñoz, and A. H. Romero, and A. Schindler, Phys. Rev. B 81 075207 (2010).
- (5) A. H. Romero, M. Cardona, R. K. Kremer , R. Lauck, G. Siegle, C. Hoch, A. Muñoz, and A. Schindler, Phys. Rev B 83, 195208 (2011).
- (6) R. K. Kremer, M. Cardona, E. Schmitt, J. Blumm, S.K. Estreicher, M. Sanati, M. Bockowski, I. Grzegory, T. Suski, and A. Jezowski, Phys. Rev. B 72, 075209 (2005).
- (7) A. Gibin, G.G. Devyatykh, A.V. Gusev, R.K. Kremer, M. Cardona, and H.-J. Pohl, Sol. State Comm. 133, 569 (2005).
- (8) L. E. Diaz-Sanchez, A. H. Romero, M. Cardona, R. K. Kremer, and X. Gonze, Phys. Rev. Lett. 99, 165504 (2007).
- (9) J. Serrano, R. K. Kremer, M. Cardona, G. Siegle, L. E. Diaz-Sanchez, and A. H. Romero, Phys. Rev. B 77, 054303 (2008).
- (10) B. Hennion, F. Moussa, G. Pepy, and K. Kunc, Phys. Lett. 36A, 376 (1971).
- (11) N. Vagelatos, D. Wehe, and J. S. King, J. Chem. Phys. 60, 3613 (1974).
- (12) P. Plumelle and M. Vandevyer, phys. stat. sol. (b) 73, 271 (1976).
- (13) D. N. Talwar, M. Vandevyver, K. Kunc, and M. Zigone, Phys. Rev B 24, 741 (1981).
- (14) A. K. Kushwaha, Physica B 405, 1638 (2010).
- (15) A. Dal Corso, S. Baroni, R. Resta, and S. de Gironcoli, Phys. Rev B 47, 3588 (1993).
- (16) K. Petzke, C. Schrepel, U. Scherz, Z. Phys. Chem. 201, 317 (1997).
- (17) I. Hamdi, M. Aouissi, A. Qteish, and N. Meskini, Phys. Rev. B 73, 174114 (2006).
- (18) Tan, Jia-Jin, Ji, Guang-Fu, Chen, Xiang-Rong, and Guo, Quing-Quan, Commun. Theor. Phys. (Beijing, China) 53, 1160 (2010).
- (19) for reference see the CASTEP website at http://www.castep.org/.
- (20) A. Debernardi and M. Cardona, Phys. Rev. B 54, 11305 (1996).
- (21) A. Göbel, T. Ruf, J. M. Zhang, R. Lauck, and M. Cardona, Phys. Rev B 59, 2749 (1999).
- (22) M. Cardona, R. K. Kremer, R. Lauck, G. Siegle, J. Serrano, and A. H. Romero, Phys. Rev. B 76, 075211 (2007).
- (23) J. C. Irwin and J. LaCombe, J. Appl. Phys 45, 567 (1974).
- (24) J. A. Birch J. Phys C: Solid State Phys. 8, 2043 (1975).
- (25) A.F. Demidenko and A.K. Maltsev, Izv. Akad. Nauk SSSR Neorg. Mater. 5, 158 (1969).
- (26) K.S. Gavrichev, G.A. Sharpataya, V.N. Guskov, J.H. Greenberg, T. Feltgen, M. Fiederle, and K.W. Benz, phys. stat. sol. (b) 229, 133 (2002).
- (27) P. Hohenberg and W. Kohn, Phys. Rev. 136, B864 (1964).
- (28) W. Kohn and L. J. Sham, Phys. Rev. 140, A1133 (1965).
- (29) X. Gonze, B. Amadon, P.-M. Anglade, J.-M. Beuken, F. Bottin, P. Boulanger, F. Bruneval, D. Caliste, R. Caracas, M. Cote, T. Deutsch, L. Genovese, Ph. Ghosez, M. Giantomassi S. Goedecker, D.R. Hamann, P. Hermet, F. Jollet, G. Jomard, S. Leroux, M. Mancini, S. Mazevet, M.J.T. Oliveira, G. Onida, Y. Pouillon, T. Rangel, G.-M. Rignanese, D. Sangalli, R. Shaltaf, M. Torrent, M.J. Verstraete, G. Zerah, and J.W. Zwanziger, Comp. Phys. Comm. 180, 2582 (2009); ABINIT is a common project of the Universite Catholique de Louvain, Corning Incorporated, and other contributors http://www.pcpm.ucl.ac.be/ABINIT.
- (30) S. Baroni, P. Giannozzi, and A. Testa, Phys. Rev. Lett. 58, 1861 (1987).
- (31) X. Gonze, Phys. Rev. B 55, 10337 (1997).
- (32) X. Gonze and C. Lee, Phys. Rev. B 55, 10355 (1997).
- (33) X. Gonze, J. M. Beuken, R. Caracas, F. Detraux, M. Fuchs, G. M. Rignanese, L. Sindic, M. Verstraete, G. Zerah, and F. Jollet, Comput. Mater. Sci. 25, 478 (2002).
- (34) D. R. Hamann, M. Schluter and C. Chiang, Phys. Rev. Lett. 43, 1494 (1979).
- (35) N. Troullier and José Luís Martins, Phys. Rev. B 43, 1993 (1991).
- (36) M. C. Payne, M. P. Teter, D. C. Allan, T. A. Arias, and J. D. Joannopoulos, Rev. Mod. Phys. 64, 1045 (1992).
- (37) R. Lauck and E. Schönherr, J. Cryst. Growth 197, 513 (1999).
- (38) R. Lauck and G. Müller-Vogt, J. Cryst. Growth 74, 513 (1986).
- (39) R. Lauck, G. Müller-Vogt, and W. Wendl, J. Cryst. Growth 74, 520 (1986).
- (40) J. Serrano, R. K. Kremer, M. Cardona, G. Siegle, A. H. Romero, and R. Lauck, Phys. Rev. B 73, 094303 (2006).
- (41) As discussed in Ref. Kremer2005, , the difference between the experimentally accessible heat capacity at constant pressure,, and is significant only at high temperatures, thus negligible in low temperature range considered here.
- (42) B. H. Lee, J Appl. Phys. 41, 2984 (1970).
- (43) see R. J. Blattner, L. K. Walford, and T. O. Baldwin, J. Appl. Phys. 43, 935 (1972) for detailed references.
- (44) Landolt-Börnstein Tables, edited by U. Rösler, New Series Vol. III/41b (Springer, New York, 1999).