Interfacial coupling across a modified interface studied with ferromagnetic resonance
Abstract
Using spin waves we directly probe the interface of an exchange biased Ni80Fe20/Ir25Mn75 film which has been modified by the presence of an Au dusting layer. Combining this experimental data with a discretised simulation model, parameters relating to interface exchange coupling and modification of interface magnetisation are determined. Exchange coupling is found to be relatively uniform as gold thickness is increased, and undergoes a sudden drop at 1.5Å of gold. Interface magnetisation decreases as a function of the gold dusting thickness. Antiparallel alignment of the ferromagnet and antiferromagnet supress the interface magnetisation compared to when they are in parallel alignment. These findings imply that the interface region has specific magnetisation states which depend on the ferromagnet orientation.
pacs:
75.70.Cn, 75.30.Ds, 75.30.Gw, 76.50.+gI Introduction
Fine scale control over growth of magnetic interfaces has made the tailoring of bulk magnetic properties though exchange bias possibleHinchey and Mills (1986); Steadman et al. (2002); Skumryev et al. (2003). In most cases it is not at all clear what occurs at the interface region and the role played by various factors such as roughnessKuch et al. (2006), intermixingSort et al. (2005), coupling directionNogués et al. (1999); Fitzsimmons et al. (2002); Lee et al. (2007) and defectsKeller et al. (2002); Gruyters (2009). Recently, many groups have begun to make detailed observations of this region with techniques able to probe buried interfaces such as neutron scatteringLee et al. (2007); Roy et al. (2005); Ball et al. (1996), XMCDBrück et al. (2008); Roy et al. (2005); Ohldag et al. (2003); Mishra et al. (2010); Marrows et al. (2005) and electron MössbauerMacedo et al. (2004). Ferromagnetic resonance Magaraggia et al. (2011a); Kennewell et al. (2010); Stoecklein et al. (1988); McMichael et al. (1998); Kittel (2005); Kuanr et al. (2008); McCord et al. (2004); Pechan et al. (2002) can also be used to study magnetic interfaces through shifts in the spin wave mode resonance conditions. Sufficiently thick films allow multiple standing spin wave modes to be observed. Their standing wave profiles are distorted by magnetic interactions at the FM/AFM interface. It has been shown that by interpreting these standing wave modes with a suitable model, information about interface coupling and interface magnetisation may be obtainedStamps et al. (1996); Magaraggia et al. (2011a); Kittel (1958); Rado and Weertman (1959); Yen et al. (1979); Guslienko and Slavin (2005); Wee et al. (2004). This is possible because interface pinning affects higher order mode frequencies more strongly then lower order mode frequencies due to the quadratic spin wave dispersion relationship Kittel (2005).
In order to uniquely identify the role of the interface in exchange bias, many experiments have been performed which directly modify the interface region either through ion-bombardmentFassbender and McCord (2008); Mewes et al. (2000); Mougin et al. (2001); Juraszek et al. (2002); Magaraggia et al. (2011b) or direct doping using an impurity layerAli et al. (2008); Yanson et al. (2008); Perez et al. (2001). Here we study Permalloy/IrMn bi-layers that have a partial Au layer between the ferromagnetic and antiferromagnetic layers. This partial gold layer is not thick enough to form a continuous layer, and is characterised though an nominal thickness. Gold is chosen because it locally blocks exchange coupling, as opposed to other materials such as iron which may enhance local exchange couplingAli et al. (2008). This partial or “dusting” layer at the interface allows a detailed examination of how the FM/AFM interaction changesAli et al. (2008) as a result of interface disruption.
Ferromagnetic resonance experiments were carried out at microwave frequencies to probe the magnetic ground state of the system. These resonances are calculated with an atomistic model which incorporates dipolar and exchange coupling as well as allowing a detailed adjustment of the layer by layer parameters. Measures of effective interface coupling are extracted which replicate the observed resonance frequencies. The simplest fit, with the fewest parameters, is to assume that the interface magnetisation must take on different values depending on the ferromagnet orientation with respect to the antiferromagnet. The gold dusting layer is found to disrupt the interface magnetisation, and interface coupling is dramatically reduced for nominal thicknesses less then a continuous monolayer.
II Experiment and Characterisation
Magnetic multilayer specimens consisting of Ta(50 Å)/ Ni80Fe20 (605 Å)/Au dusting (t Å)/Ir25Mn75 ( 60 Å)/ Ta(50 Å) and Ta(50 Å)/ Ni80Fe20 (t Å)/Ir25Mn75 ( 60 Å)/ Ta(50 Å) were sequentially deposited onto Si(001) substrates by dc-magnetron sputtering at an argon working pressure of 2.5 mTorr. Typical deposition rates were 2–2.5 Å s-1, which were determined by measuring the thickness of calibration films by low-angle x-ray reflectometry. Film roughness was in the order of 3-4 Å, also determined by low-angle x-ray reflectometry. An in-plane field of 15.9 kA m-1 was applied during the growth to induce a macroscopic uniaxial anisotropy in the Ni80Fe20 layer in a defined direction. The base pressure prior to the deposition was of the order of 110-8 Torr and the samples were deposited at ambient temperature.
The IrMn layers were deposited from an alloy target. To facilitate the growth of face-centred-cubic (fcc) (111) orientation of IrMn, a buffer underlayer of Ta was employed. X-ray diffraction revealed that such samples were predominantly fcc with a (111) texture. We did not detect any changes in texture in a representative selection of doped samples measured by this technique, presumably since the Au dusting layer was so thin. Furthermore, the fcc structure of Au should prevent disruption of the crystal structure in subsequent layers. No post annealing steps were required, since the exchange bias pinning direction was set by a 15.9 kA m-1 in-plane forming field applied to the sample during the deposition of all the layers in this top spin-valve configuration.
The IrMn layer thickness of 60 Å was chosen such that any slight changes in IrMn layer thickness itself did not alter the exchange bias. Atomic level disorder at the interface was achieved by depositing a layer dusting of Au Ali et al. (2008). The Au dusting layer was varied from 0 to 1.5 Å, and is discontinuous for layer thickness below 8 Å, given that the lattice spacing for Au is 4.08 Å.
In-plane and out-of-plane FMR magnetometry was used to extract from resonance frequency dataKittel (2005). In-plane FMR magnetometry along the easy axis of a Ni80Fe20 sample with no IrMn gave a saturation magnetisation of 0.800.05 T, a gyromagnetic ratio of 2.81010 Hz T-1 and in plane bulk anisotropy of less then 0.0007 T. Further magnetometry was performed using the magneto-optical Kerr effect (MOKE). A 635 nm diode laser, rated at 5 mW, was used to illuminate the sample. A differential amplifier was used to analyse polarisation rotation.
MOKE measurements were carried out along the sample easy axis by sweeping the field at 10 Hz, in order to reduce noise. Exchange bias is determined from MOKE measurements by taking half the difference between the positive and negative coercive field points on the corresponding hysteresis loop.
Broadband FMR measurements were carried out using a 20 GHz vector network analyser to excite and detect resonance measurements. A 0.3 mm wide microstrip line, which was connected to 50 high frequency co-axial cables, acts as a microwave antenna and drives resonance in the sample, which is placed on top and is in direct contact with the microstrip. A Kepco powered electromagnet is used to supply the in-plane magnetic field. This magnetic field is swept and the S21(H) parameters are measured at a fixed microwave frequency as in Kennewell et al. (2010); Magaraggia et al. (2011a). The applied magnetic field , was varied between 0 and 51.7 kA m-1, resonance was measured for with and against the bias direction. The determined resonance field is referred to as . Microwave frequencies were chosen such that the fundamental resonance mode (FMR) and the first exchange mode (FEX) were excited at applied fields larger then the saturation field of 1.6 kA m-1.
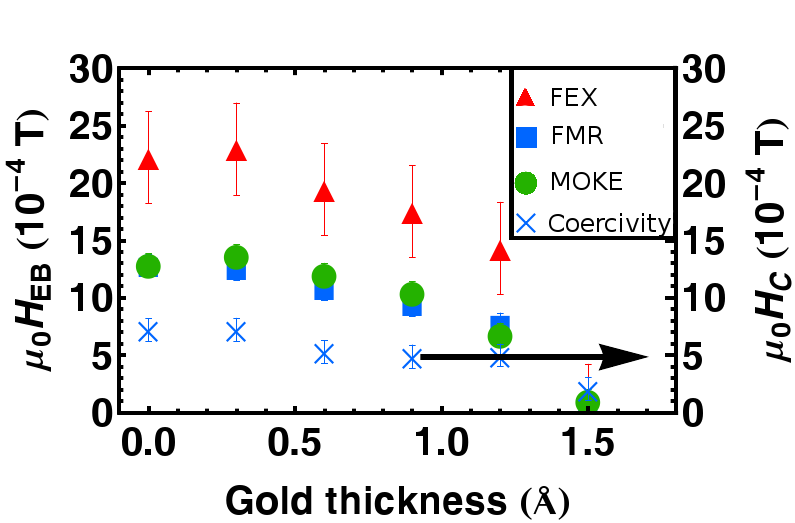
As in previous studiesMagaraggia et al. (2011a), the bias was characterised using spin wave modes as half the difference between along and against the easy axis direction. The exchange bias determined by the two spin wave modes and MOKE are shown in Fig.(1). As expectedXi et al. (2000) the FMR and MOKE data are in good agreement, and the FEX mode shows a much larger exchange bias field. The FEX bias shift is larger then the other measures of exchange bias since this mode is particularly sensitive to interface pinningMagaraggia et al. (2011a). Addition of gold at the interface decreases the exchange bias to zero at an nominal dusting of 1.5 Å. Similar findings have been reported for other types of dusting materialsAli et al. (2008). We note that coercivity undergoes a very slow decrease with increasing Au dusting thickness.
III Model
Standing spin wave resonance conditions for in-plane magnetised thin films can be estimated using Kittel’s formulaKittel (2005):
| (1) |
where is the frequency of the spin wave with wavenumber , is an externally applied field in the plane of the thin film, is the saturation magnetisation and is the exchange constant. In the simplest approximation, perturbations to spin wave frequency due to interface pinning and surface effects can be associated with a modified . The precision with which FMR can be performed requires a more realistic model however, capable of describing inhomogeneous magnetic parameters near the interface. We base our model on the theory of Benson and MillsBenson and Mills (1969). This also describes additional weak surface pinning due to dipole field effects which are not present in continuous models111Example frequency shifts are 8.0410-3 GHz for the FMR mode and 24.310-3 GHz for the FEX mode for a 60.5 nm permalloy film using calculation parameters = T, = T and = T m2..
The geometry is shown in Fig.(3) where there is a discrete number of layers in the y-direction, and an infinite number of lattice sites in the x and z directions.
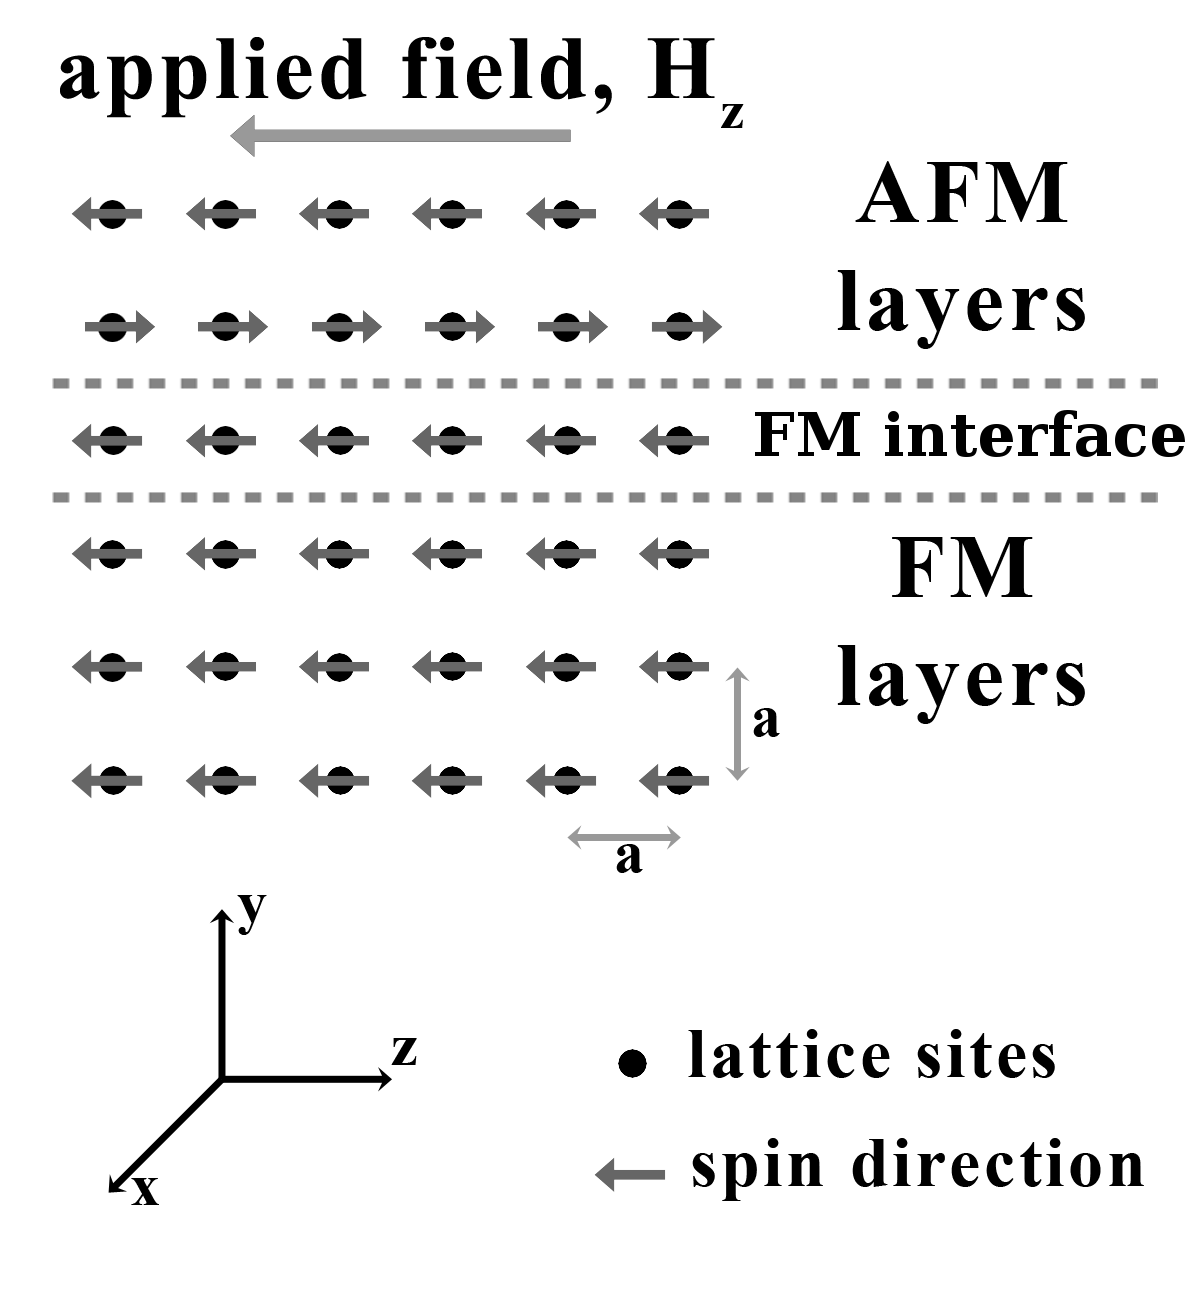
The spin direction , saturation magnetisation , exchange interaction , in plane and out of plane anisotropy are defined individually for each layer. In what follows, the same set of parameters for all AFM layers is used. Likewise, the parameters for all FM layers are the same except for the FM interface layer, which can vary. The spins in the ferromagnetic layers are all aligned along the direction of the externally applied field and antiferromagnetic layers are aligned antiparallel to neighbouring antiferromagnetic layers as shown in Fig.(3). At the interface the first antiferromagnetic layer can be set either parallel or antiparallel relative to the applied field and ferromagnetic layers. For the purposes of this calculation, interface coupling is always set to be positive. The geometry when the FM and AFM layers are aligned at the interface is referred to as “with bias”. Likewise, the geometry when the FM and AFM layers are anti-aligned at the interface is referred to as “against bias”.
Following Ref.Benson and Mills (1969), there are four contributions to the Hamiltonian:
The first contribution is due to the static applied field, , in the z-direction;
| (2) |
with the Landé factor and the Bohr magneton. The second contribution is due the exchange interaction;
| (3) |
with giving the exchange between two spins at and , this is only non zero for nearest neighbours. The third contribution is from dipolar interactions;
| (4) |
where . This is a long range interaction and the resulting dipole sums are very slow to converge. Following the treatment detailed by Ref.Benson and Mills (1969) using Ewald’s method these are converted to a rapidly convergent form.
Further anisotropy contributions, such as magnetocrystalline anisotropies, which arise from sources other then the demagnetizing field comprises both in plane uniaxial anisotropy Lévy and Lévy (1993); Corciovei (1960) in the z direction and out of plane anisotropy Kohmoto (2003) in the y direction;
| (5) |
where is the static in plane anisotropy constant and is the out of plane anisotropy constant for a spin at .
Equations of motion are formed from the Hamiltonian by assuming a translationally invariant plane wave solution and linearising by assuming time invariant terms . The equations of motion are solved by expressing them in matrix form and numerically solving the eigenvalue problem to find the spin wave frequencies and mode profiles. The saturation magnetisation is defined as , but in the code is used as a factor to alter . The link between and is given by .
Matching excitation frequency vs simulation results for both the FMR and FEX mode to experimental data, as shown in the example of Fig.(4), allows a consistent extraction of bulk in-plane anisotropy and exchange constant parameters. The sample with the thickest gold dusting of 1.5 Å is used to fit , MS, Kip,FM, Kop,FM and because this sample shows no bias(see Fig.(1)). Best fits give in-plane anisotropy of the ferromagnet in field units is T and the spin wave stiffness is D T m2, which corresponds to an exchange constant J J. Data obtained by FMR magnetometry is used to set Hz T-1 and M A m-1. The lattice constant of permalloy was set as a=0.355 nmNarishige et al. (1992) and 170 discrete layers were used to simulate a 60.5 nm thick permalloy film.

Interactions between the antiferromagnet and ferromagnet are mediated via direct exchange interaction at the FM/AFM interface Jint, and long range dipole forces. The above values were held constant and interface parameters varied to fit FMR data from the thinner Au samples. Parameters used for the antiferromagnet were obtained fromSzunyogh et al. (2009) and are in-plane anisotropy T , magnetisation M A m-1, exchange coupling J J and the lattice constant a=0.3785 nm. 16 layers were used in order to simulate a 6 nm thick IrMn film.
IV Results for Interface Parameters
We compare the calculated resonance field of the FMR mode (at 3 GHz) and the FEX mode (at 7 GHz) by altering only the strength of Jint in Fig.(5). Experimental data for Au thicknesses of 0, 0.9 and 1.5 Å are shown for comparison. The two different theoretical lines represent the resonance fields for the FM aligned with and against bias. It is these two configurations which produces the observed exchange bias as seen in ferromagnetic resonance experiment.
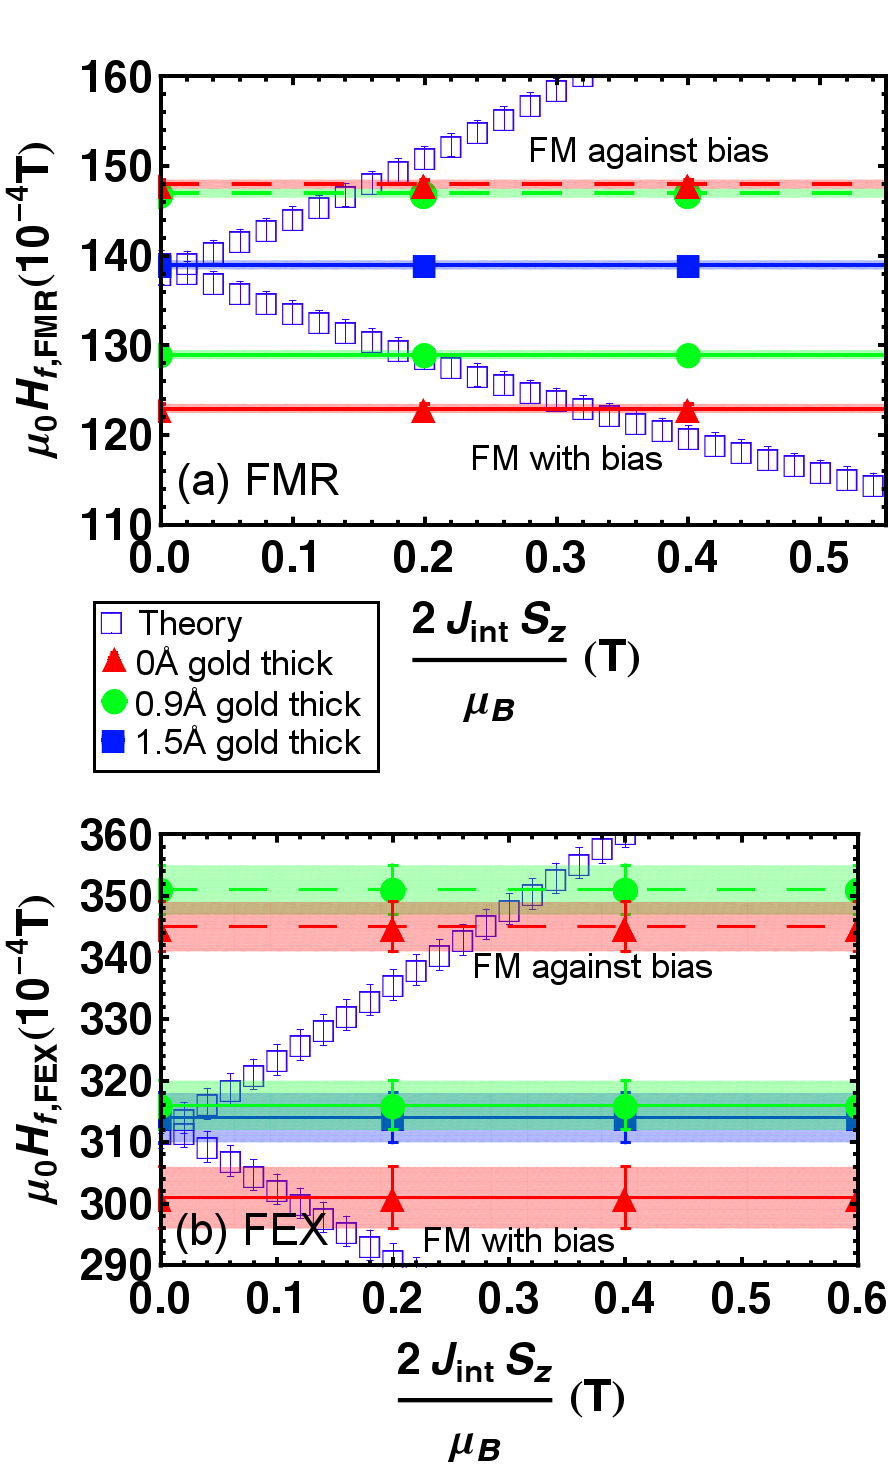
There are several features of note. Firstly there is a small difference in for the two orientations (referred to as a “field gap”), even when J. This is caused by the different forces acting on spins at the interface when the ferromagnet is aligned with or against the antiferromagnet due to dipolar pinning from the antiferromagnet interface. Such a feature should not be seen experimentally as the interface is not atomically flat, and the polycrystalline nature of the thin film introduces a mixture of interface conditions. Furthermore, we assume that Jint and all other interface parameters represent averages across interface.
The field gap in Fig.(5) for the two directions at nonzero Jint can reproduce the exchange bias seen in the experimental data, but only if Jint is different for each field direction. This is difficult to understand and we interpret it as meaning the model is too simple.
As a minimum complication we introduce a quantity which describes changes in the interface magnetisation of the ferromagnet from that of the bulk. This is not unreasonable as the interface should be directly modified by the gold dusting layer. In fact, changes in interface magnetisation have been observed experimentallyMishra et al. (2010); Brück et al. (2008); Roy et al. (2005); Ohldag et al. (2003); Wu et al. (2010), and have also been used in attempts to theoretically describe exchange biasKiwi (2001); Nowak et al. (2002). In this way there are effectively magnetic “clusters” coupled to the ferromagnet and antiferromagnet across the interface.
The dependence of resonance conditions as a function of is shown in Fig.(6) for a fixed interface coupling to the AFM, set to T. This value of interface coupling was chosen to correspond to the coupling found for the 0 Å gold dusting film, as in Fig.(8)(a).
Both orientations of the FM with respect to the AFM are shown in Fig.(6). When the FM is aligned with bias, we note that the resonance field is always decreased as expected from arguments presented inMagaraggia et al. (2011a). The resonance field for the FM aligned against bias is always bigger, and has a maximum before it starts to converge towards the “with bias” case at low . This represents the FM and AFM becoming decoupled as the interface magnetisation decreases to zero. In other words there are two solutions of a suitable value for a given resonance field for the “against bias” case. In fitting to the data, the lower solution was chosen because should decrease as more Au is introduced to the interface.

In order to match calculated resonances to experimental resonances, is allowed to vary depending on FM direction with respect to the AFM, but Jint is required to be the same regardless of FM orientation. Due to the smaller experimental uncertainties related to the FMR mode data, the parameters determined this way represent a best fit to optimise agreement with the FMR mode resonance conditions.
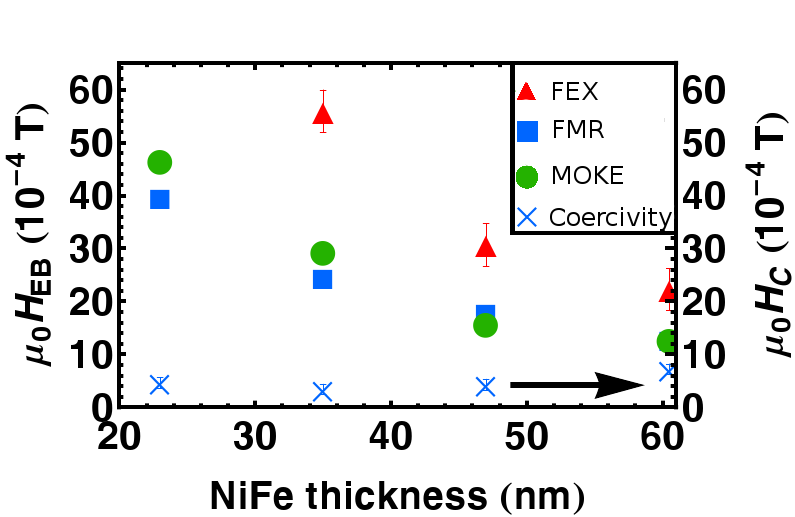
Fits to Jint were done by matching to experimental data for the 0 Å gold film and finding solutions. Fig.(7) shows the experimental results for the FMR resonances (at an excitation frequency of 3 GHz) of the FMR mode, along with simulation results which use Jint and values found for the Ta(50 Å)/ Ni80Fe20 (t Å)/Ir25Mn75 ( 60 Å)/ Ta(50 Å) films. Although there is not complete agreement, using the parameters found for the thickest of the permalloy films seems to qualitatively reproduce the experimental resonance results. Fig.(7) also shows a comparison of experimental to theoretical results for the FEX mode in thinner NiFe films, although one should note the experimental excitation frequencies are varied from film to film in order to keep the modes in a Hf range observable by our setup due to thickness effects.

Results for with T, and comparisons to the experimental data for both modes are shown in Fig.(8).
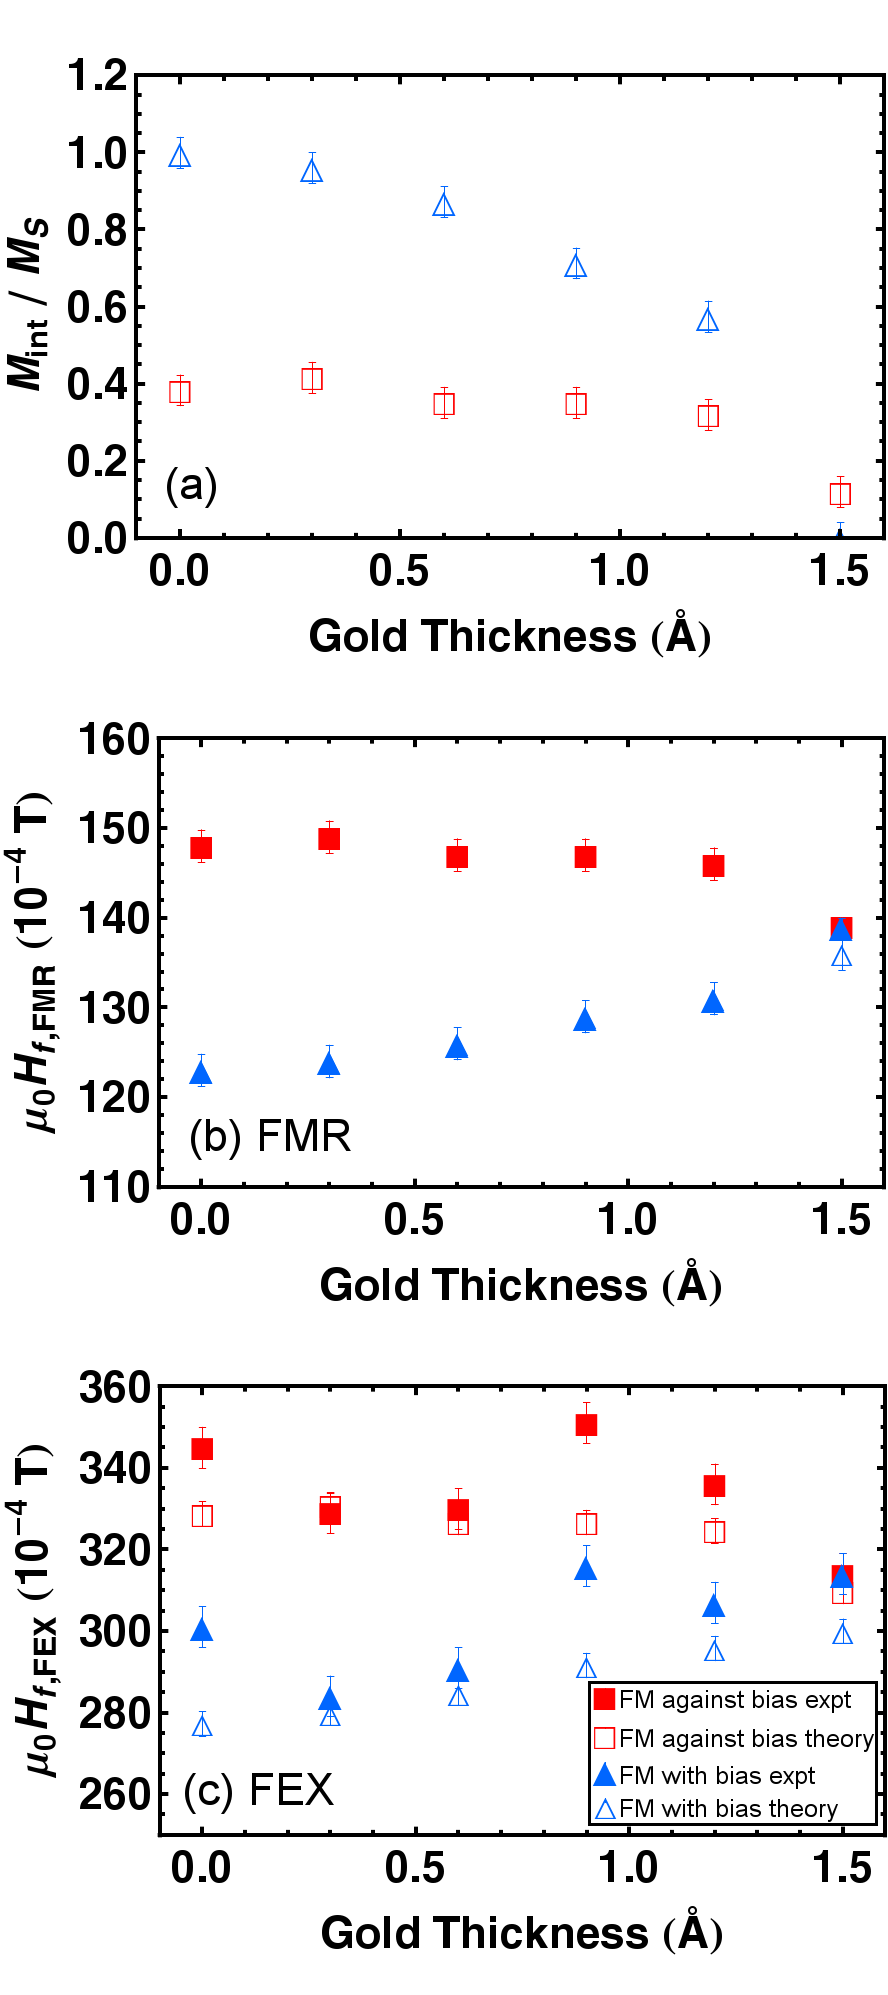
The calculations are in excellent agreement with the experimental data for the FMR mode. In contrast, the match to the FEX mode is not as good, with some large fluctuations which are possibly due to sample-to-sample thickness variation, as exchange modes are extremely sensitive to film thicknessKittel (2005). Nevertheless, several points do closely follow the calculated trend for resonance field shifts. Interface magnetisation is suppressed when the FM is against bias, but approaches the bulk value it is aligned with bias. The average decreases roughly linearly as a function of gold dusting thickness and results from decreased average exchange coupling across the interface. At a average gold thickness of 1.5 Å interface magnetisation drops sharply for both orientations as coupling through the interface layer becomes negligible.
V Discussion and Summary
We have used measurements of standing spin wave modes in a modified interface exchange biased system to propose a model of effective exchange coupling in an FM/AFM system with diluted interface. Interface coupling mediated via the interface magnetisation is found to slowly attenuate as the gold dusting thickness was increased, and then drops to zero at 1.5 Å. When the FM and AFM are aligned (FM is aligned with bias) and there is no gold dusting, the interface magnetisation is found to be close to the bulk value for the FM. More importantly, the interface magnetisation is substantially suppressed when the FM is antiparallel aligned to the AFM (FM is aligned against bias). The interface magnetisation couples to and pins the ferromagnet, and it is this difference in pinning, arising from different FM/AFM alignment, which produces the bias effect observed with spin wave resonance. We have shown that a modified interface magnetisation model accurately reproduces the measured resonance fields.
Although modification of antiferromagnetic anisotropy in the model was tried, it was not sufficient to realistically change the calculated resonances. Resonances in the ferromagnet are found to be insensitive to changes in AFM anisotropy for a large range about the standard valueSzunyogh et al. (2009) of T for IrMn. Restricting any changes in anisotropy to the interface layers of the FM or AFM to reproduce these experimental field shifts leads to physically unrealistic values. The conclusion is that is the most sensible parameter to change in order to describe the experimental results.
Experimentally it has been found that exchange biased multilayers have pinned or uncompensated spinsMishra et al. (2010); Brück et al. (2008); Roy et al. (2005); Ohldag et al. (2003); Wu et al. (2010) and fanning of magnetisation in the ferromagnetMacedo et al. (2004). Our findings show that the interface magnetisation might vary as the bulk ferromagnetic spin direction is altered with respect to the antiferromagnet. The maximum difference of interface magnetisation between the two FM orientations is 0.6 times the value for bulk and is confined close to the interface. Furthermore, exchange coupling strength across the ferromagnet/antiferromagnet interface needs only be very small compared to exchange coupling strength in the bulk of each material respectively, although we note that this is an effective coupling as mediated via the layer of altered magnetisation at the interface. This seems to be true even for samples where the permalloy layer is made thinner. Introduction of different types of dusting layers at different distances from the interface, and analysis with spin wave techniques would allow further exploration of the local changes to magnetisation at the FM/AFM interface.
VI Acknowledgments
Support from the Australian Research Council under the Discovery and Australian Postgraduate Award programmes is acknowledged. Furthermore, support from the United Kingdom’s Engineering and Physical Sciences Research Council is also acknowledged.
References
- Hinchey and Mills (1986) L. L. Hinchey and D. L. Mills, Phys. Rev. B 34, 1689 (1986).
- Steadman et al. (2002) P. Steadman, M. Ali, A. T. Hindmarch, C. H. Marrows, B. J. Hickey, S. Langridge, R. M. Dalgliesh, and S. Foster, Phys. Rev. Lett. 89, 077201 (2002).
- Skumryev et al. (2003) V. Skumryev, S. Stoyanov, Y. Zhang, G. Hadjipanayis, D. Givord, and J. Nogués, Nature 423, 850 (2003).
- Kuch et al. (2006) W. Kuch, L. I. Chelaru, F. Offi, J. Wang, M. Kotsugi, and J. Kirschner, Nat. Mater. 5, 128 (2006).
- Sort et al. (2005) J. Sort, V. Baltz, F. Garcia, B. Rodmacq, and B. Dieny, Phys. Rev. B 71, 054411 (2005).
- Nogués et al. (1999) J. Nogués, T. J. Moran, D. Lederman, I. K. Schuller, and K. V. Rao, Phys. Rev. B 59, 6984 (1999).
- Fitzsimmons et al. (2002) M. R. Fitzsimmons, C. Leighton, J. Nogués, A. Hoffmann, K. Liu, C. F. Majkrzak, J. A. Dura, J. R. Groves, R. W. Springer, P. N. Arendt, V. Leiner, H. Lauter, and I. K. Schuller, Phys. Rev. B 65, 134436 (2002).
- Lee et al. (2007) S. J. Lee, J. P. Goff, G. J. McIntyre, R. C. C. Ward, S. Langridge, T. Charlton, R. Dalgliesh, and D. Mannix, Phys. Rev. Lett. 99, 037204 (2007).
- Keller et al. (2002) J. Keller, P. Miltényi, B. Beschoten, G. Güntherodt, U. Nowak, and K. D. Usadel, Phys. Rev. B 66, 014431 (2002).
- Gruyters (2009) M. Gruyters, Phys. Rev. B 79, 134415 (2009).
- Roy et al. (2005) S. Roy, M. R. Fitzsimmons, S. Park, M. Dorn, O. Petracic, I. V. Roshchin, Z.-P. Li, X. Batlle, R. Morales, A. Misra, X. Zhang, K. Chesnel, J. B. Kortright, S. K. Sinha, and I. K. Schuller, Phys. Rev. Lett. 95, 047201 (2005).
- Ball et al. (1996) A. R. Ball, A. J. G. Leenaers, P. J. van der Zaag, K. A. Shaw, B. Singer, D. M. Lind, H. Fredrikze, and M. Rekveldt, Appl. Phys. Lett. 69, 583 (1996).
- Brück et al. (2008) S. Brück, G. Schütz, E. Goering, X. Ji, and K. M. Krishnan, Phys. Rev. Lett. 101, 126402 (2008).
- Ohldag et al. (2003) H. Ohldag, A. Scholl, F. Nolting, E. Arenholz, S. Maat, A. T. Young, M. Carey, and J. Stöhr, Phys. Rev. Lett. 91, 017203 (2003).
- Mishra et al. (2010) S. K. Mishra, F. Radu, S. Valencia, D. Schmitz, E. Schierle, H. A. Dürr, and W. Eberhardt, Phys. Rev. B 81, 212404 (2010).
- Marrows et al. (2005) C. H. Marrows, P. Steadman, A. C. Hampson, L.-A. Michez, B. J. Hickey, N. D. Telling, D. A. Arena, J. Dvorak, and S. Langridge, Phys. Rev. B 72, 024421 (2005).
- Macedo et al. (2004) W. A. A. Macedo, B. Sahoo, V. Kuncser, J. Eisenmenger, I. Felner, J. Nogués, K. Liu, W. Keune, and I. K. Schuller, Phys. Rev. B 70, 224414 (2004).
- Magaraggia et al. (2011a) R. Magaraggia, K. Kennewell, M. Kostylev, R. L. Stamps, M. Ali, D. Greig, B. J. Hickey, and C. H. Marrows, Phys. Rev. B 83, 054405 (2011a).
- Kennewell et al. (2010) K. J. Kennewell, M. Kostylev, N. Ross, R. Magaraggia, R. L. Stamps, M. Ali, A. A. Stashkevich, D. Greig, and B. J. Hickey, J. Appl. Phys. 108 (2010).
- Stoecklein et al. (1988) W. Stoecklein, S. S. P. Parkin, and J. C. Scott, Phys. Rev. B 38, 6847 (1988).
- McMichael et al. (1998) R. D. McMichael, M. D. Stiles, P. J. Chen, and W. F. Egelhoff, Phys. Rev. B 58, 8605 (1998).
- Kittel (2005) C. Kittel, Introduction to Solid State Physics, 8th ed., edited by S. Johnson (John Wiley & Sons, Inc, United States of America, 2005).
- Kuanr et al. (2008) B. K. Kuanr, S. Maat, S. Chandrashekariaih, V. Veerakumar, R. E. Camley, and Z. Celinski, J. Appl. Phys. 103, 07C107 (2008).
- McCord et al. (2004) J. McCord, R. Mattheis, and D. Elefant, Phys. Rev. B 70, 094420 (2004).
- Pechan et al. (2002) M. J. Pechan, D. Bennett, N. Teng, C. Leighton, J. Nogués, and I. K. Schuller, Phys. Rev. B 65, 064410 (2002).
- Stamps et al. (1996) R. L. Stamps, R. E. Camley, and R. J. Hicken, Phys. Rev. B 54, 4159 (1996).
- Kittel (1958) C. Kittel, Phys. Rev. 110 (1958).
- Rado and Weertman (1959) G. Rado and J. Weertman, J. Phys. Chem. Solids 11, 315 (1959).
- Yen et al. (1979) P. Yen, T. S. Stakelon, and P. E. Wigen, Phys. Rev. B 19, 4575 (1979).
- Guslienko and Slavin (2005) K. Y. Guslienko and A. N. Slavin, Phys. Rev. B 72, 014463 (2005).
- Wee et al. (2004) L. Wee, R. L. Stamps, L. Malkinski, and Z. Celinski, Phys. Rev. B 69, 134426 (2004).
- Fassbender and McCord (2008) J. Fassbender and J. McCord, J. Magn. Magn. Mater. 320, 579 (2008).
- Mewes et al. (2000) T. Mewes, R. Lopusnik, J. Fassbender, B. Hillebrands, M. Jung, D. Engel, A. Ehresmann, and H. Schmoranzer, Appl. Phys. Lett. 76, 1057 (2000).
- Mougin et al. (2001) A. Mougin, T. Mewes, M. Jung, D. Engel, A. Ehresmann, H. Schmoranzer, J. Fassbender, and B. Hillebrands, Phys. Rev. B 63, 060409 (2001).
- Juraszek et al. (2002) J. Juraszek, J. Fassbender, S. Poppe, T. Mewes, B. Hillebrands, D. Engel, A. Kronenberger, A. Ehresmann, and H. Schmoranzer, J. Appl. Phys. 91, 6896 (2002).
- Magaraggia et al. (2011b) R. Magaraggia, M. Kostylev, R. L. Stamps, K. W. Lin, J. Y. Guo, K. J. Yang, R. D. Desautels, and J. van Lierop, IEEE Trans. Mag. to be published (2011b).
- Ali et al. (2008) M. Ali, C. H. Marrows, and B. J. Hickey, Phys. Rev. B 77, 134401 (2008).
- Yanson et al. (2008) Y. Yanson, O. Petracic, K. Westerholt, and H. Zabel, Phys. Rev. B 78, 205430 (2008).
- Perez et al. (2001) M. Perez, C. H. Marrows, and B. J. Hickey, Europhys. Lett. 54, 262 (2001).
- Xi et al. (2000) H. Xi, R. M. White, and S. M. Rezende, J. Appl. Phys. 87, 4960 (2000).
- Berkowitz and Takano (1999) A. E. Berkowitz and K. Takano, J. Magn. Magn. Mater. 200, 552 (1999).
- Benson and Mills (1969) H. Benson and D. L. Mills, Phys. Rev. 178, 839 (1969).
- Note (1) Example frequency shifts are 8.0410-3 GHz for the FMR mode and 24.310-3 GHz for the FEX mode for a 60.5 nm permalloy film using calculation parameters = T, = T and = T m2.
- Lévy and Lévy (1993) J. Lévy and J. Lévy, J. Magn. Magn. Mater. 125, 310 (1993).
- Corciovei (1960) A. Corciovei, Czech. J. Phys. 10, 568 (1960).
- Kohmoto (2003) O. Kohmoto, Journal of Magnetism and Magnetic Materials 262, 280 (2003).
- Narishige et al. (1992) S. Narishige, K. Mitsuoka, and Y. Sugita, IEEE Trans. Magn. 28, 990 (1992).
- Szunyogh et al. (2009) L. Szunyogh, B. Lazarovits, L. Udvardi, J. Jackson, and U. Nowak, Phys. Rev. B 79, 020403 (2009).
- Wu et al. (2010) J. Wu, J. S. Park, W. Kim, E. Arenholz, M. Liberati, A. Scholl, Y. Z. Wu, C. Hwang, and Z. Q. Qiu, Phys. Rev. Lett. 104, 217204 (2010).
- Kiwi (2001) M. Kiwi, J. Magn. Magn. Mater. 234, 584 (2001).
- Nowak et al. (2002) U. Nowak, K. D. Usadel, J. Keller, P. Miltényi, B. Beschoten, and G. Guntherodt, Phys. Rev. B. 66 (2002).