Protostellar Outflow Heating in a Growing Massive Protocluster
Abstract
The dense molecular clump P1 in the infrared dark cloud (IRDC) complex G28.34+0.06 harbors a massive protostellar cluster at its extreme youth. Our previous Submillimeter Array (SMA) observations revealed several jet-like CO outflows emanating from the protostars, indicative of intense accretion and potential interaction with ambient natal materials. Here we present the Expanded Very Large Array (EVLA) spectral line observations toward P1 in the (J,K) = (1,1), (2,2), (3,3) lines, as well as H2O and class I CH3OH masers. Multiple transitions reveal the heated gas widely spread in the 1 pc clump. The temperature distribution is highly structured; the heated gas is offset from the protostars, and morphologically matches the outflows very well. Hot spots of spatially compact, spectrally broad (3,3) emission features are also found coincident with the outflows. A weak (3,3) maser is discovered at the interface between an outflow jet and the ambient gas. These findings suggest that protostellar heating may not be effective in suppressing fragmentation during the formation of massive cores.
1 Introduction
The majority of stars, from low to high mass ones are born in clusters (Lada & Lada, 2003). In a clustered environment, feedback from protostellar radiation and outflows can play an important role in shaping their parental molecular cloud and thereby regulate further cloud fragmentation and star formation. In particular, protostellar feedback may be crucial for the formation of massive stars which typically contain masses at least one order of magnitude higher than the global Jeans mass in the molecular clump ( for and K; Pillai et al. 2006; Rathborne et al. 2006). Calculations have shown that the accretion luminosity of a low mass protostar can heat gas to 100 K out to hundreds of AU, thereby raising the local thermal Jeans mass (Masunaga & Inutsuka, 2000; Krumholz, 2006). Subsequent numerical simulations indicate that protostellar heating from low mass stars in the cluster may change the equation of state (Larson, 1985), and suppress the fragmentation (Krumholz et al., 2010), thereby aiding the formation of massive cores. On the other hand, protostellar outflows in the cluster can also inject momentum and energy into the local medium, and affect the evolution of the cloud (Quillen et al., 2005; Curtis et al., 2010; Wang et al., 2010).
To investigate the protostellar feedback, we observed the dense molecular clump P1 in the IRDC complex G28.34+0.06. Located in the southern part of G28.34+0.06, P1 is one of the dense molecular clumps among the filamentary network in the IRDC complex which stretches over 6 pc at a kinematic distance of 4.8 kpc (Carey et al., 2000; Rathborne et al., 2006; Wang et al., 2008). P1 is a northeast-southwest (NE-SW) orientated molecular clump containing a large mass reservoir of within a size of 1 pc. Wang et al. (2008) presented an mosaic of the entire IRDC, and found that the gas temperature decreases from 20 to 14 K toward the inner part of P1, indicative of external heating. A similar trend was found in the line width, suggesting a turbulence dissipation toward smaller scales. Our SMA observations resolved the P1 clump into a string of five cores (named SMA1–5) containing 22–64 in mass and pc in size; at higher angular resolution and better sensitivity, the cores are further resolved into ten compact condensations (named, e.g. SMA2a–d) with masses of 1.4–10.6 and sizes of 0.01 pc, indicative of a hierarchical fragmentation (Zhang et al., 2009; Wang et al., 2011). In addition, all five cores are associated with highly collimated CO (3–2) outflows. The large mass reservoir and the ongoing accretion indicate that P1 will eventually form a massive star cluster after the accretion is completed. This young protocluster provides an opportunity to investigate how protostellar heating and outflows affect the parent molecular environment, and the formation of massive cores. The new EVLA observations presented in this Letter reveal the temperature profiles at unprecedented high angular resolution, allowing us to evaluate the protostellar feedback in detail.
2 Observations
The NRAO111The National Radio Astronomy Observatory is a facility of the National Science Foundation operated under cooperative agreement by Associated Universities, Inc. EVLA was used to obtain the (J,K) = (1,1), (2,2), (3,3), as well as H2O and CH3OH maser line emission data in 2010 during the EVLA early science phase. Table 1 summarizes the observations. The data were calibrated in CASA222http://casa.nrao.edu and imaged using CASA and Miriad333http://www.astro.umd.edu/$∼$teuben/miriad,http://www.cfa.harvard.edu/sma/miriad.
The (1,1) and (2,2) observed in the EVLA C array has a channel width of 0.2 km s-1. Wang et al. (2008) observed (1,1) and (2,2) toward the same phase center in the VLA D array with a channel spacing of 0.6 km s-1. We combined the calibrated visibilities of Wang et al. (2008) with the new C array data for imaging. To increase the signal-to-noise ratio in the final images, we averaged the channel width to 0.3 km s-1 and tapered the visibilities with a Gaussian function with a FWHM of 180 k. We also made images with a 0.6 km s-1 channel width to compare with the images at 0.3 km s-1 resolution, and found that the latter does not introduce additional features. For the (3,3) images we also averaged the channel width to 0.3 km s-1 to improve the signal-to-noise ratio.
3 Results
3.1 Ammonia Emission
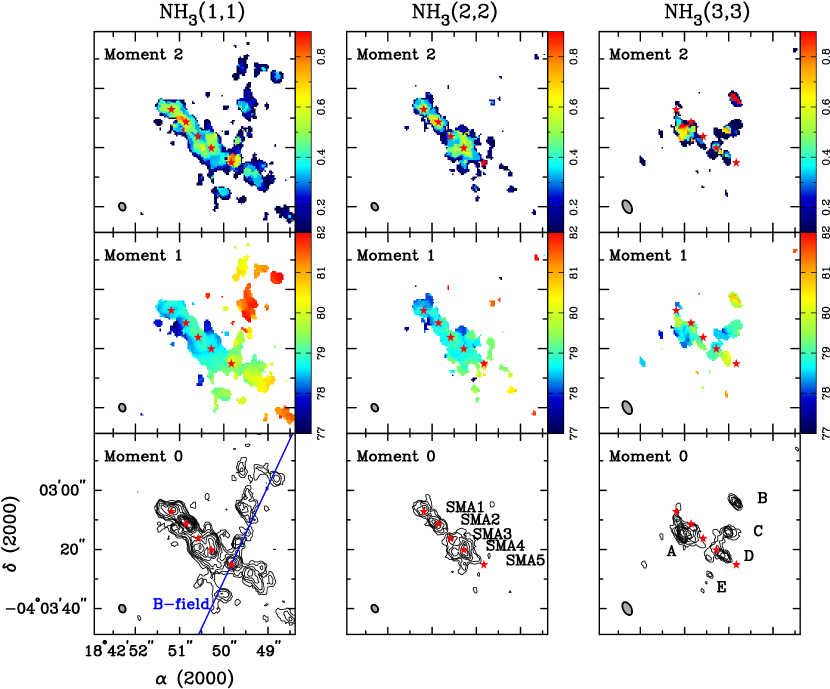
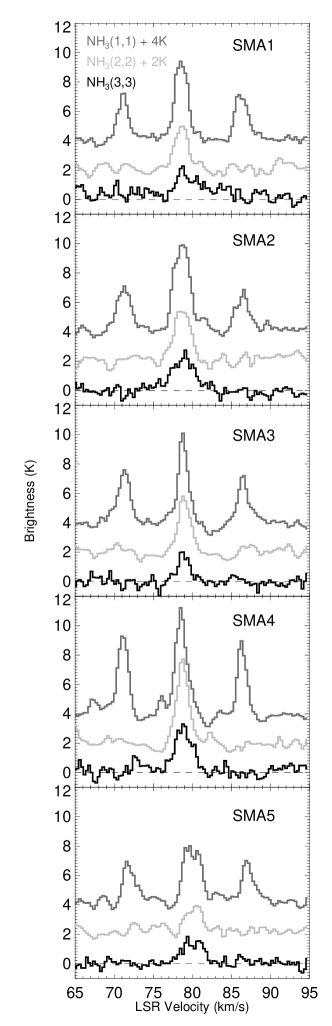
Figure 1 presents moment 0, 1 and 2 maps of the (1,1), (2,2) and (3,3) main hyperfine emission. The NE-SW orientated filament is traced by the (1,1) and (2,2) emission extremely well. Ammonia cores coincide with all the SMA dust cores, indicating that traces the dense envelopes of the protostellar cores. As illustrated in the moment 1 images of (1,1) and (2,2), there is a velocity gradient of 1.5 km s-1 over 1 pc along the filament. This gradient is, however, not uniform; it is enhanced toward southwest starting at SMA5. On the other hand, the velocity field from SMA1 through SMA4 is quite uniform, at about 79 km s-1. The moment 2 images show similar velocity dispersion444For a Gaussian line profile, velocity dispersion is related to FWHM line width as . of 0.4–0.8 km s-1 along the filament as traced by (1,1) and (2,2). The velocity dispersion is enhanced to several local maxima of 0.6–0.8 km s-1 which coincide with all the SMA dust cores except SMA3. The enhancements may originate from a combination of spatially unresolved motions such as rotation, infall, and outflow.
In addition to the main filament, the (1,1) emission also reveals a fainter northwest-southeast (NW-SE) orientated filament, crossing the main filament at SMA5, making an shape. This minor filament is located at a slightly different velocity, around 82 km s-1. Compared to the main filament, the minor filament shows weaker emission in (1,1) and little emission in (2,2), indicative of even colder gas. The minor filament is evident in the previous (1,1) image at lower resolution (Wang et al., 2006; Zhang et al., 2009), however, it does not correspond to any dust emission feature at 350–1300 m (Rathborne et al., 2006, 2010; Zhang et al., 2009; Chen et al., 2010; Wang et al., 2011). Therefore, the minor filament is remarkably less dense than the main filament. Like the main filament, the minor filament consists of a velocity gradient of 2 km s-1 over 1 pc; it also hosts several cores with sizes similar to the cores on the main filament. It has a velocity dispersion of km s-1 in general, but local enhancements of up to 0.5 km s-1 are also presented. We will discuss the nature of the minor filament in Section 4.3. In the following text, unless otherwise stated, we refer the main NE-SW filament as “the filament”.
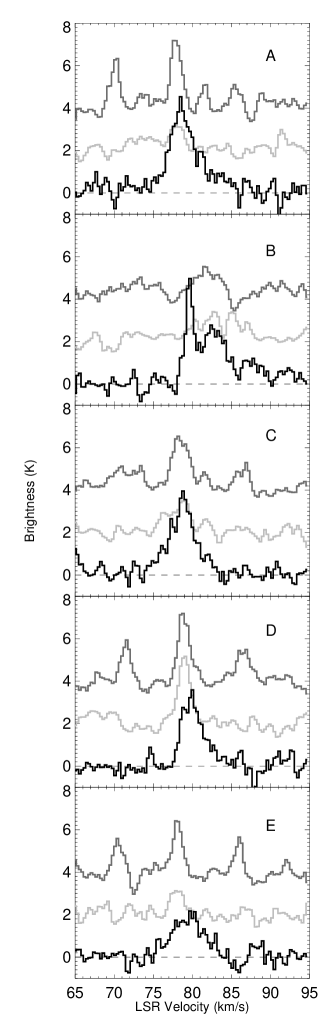
It is interesting to note that the clumpy (3,3) emission does not follow the dust filament at all. We visually identified five representative peaks from the (3,3) moment 0 map, labeled as A–E in Figure 1. None of these peaks coincide with any dust cores. In fact, the only one that lies on the filament is peak D which is between SMA4 and SMA5; other peaks are offset from the filament. Because (3,3) is excited at an energy level of 125 K, these ammonia peaks trace local temperature enhancements relative to the generally cold molecular clump. Another important feature is the large velocity dispersion: all the peaks show centrally condensed distribution of km s-1, and up to 2.2 km s-1 in peak B. Peak B is located down stream of the red lobe of outflow SMA2a, the most energetic outflow in P1 (Wang et al., 2011). The centroid velocity on peak B is redshifted relative to the filament, consistent with the redshifted CO emission. Indeed, all these (3,3) peaks seem to trace the footprint of the jet-like CO (3–2) outflows revealed by the SMA (Wang et al., 2011). We will discuss this further in Section 4.1.
3.2 Maser Emission
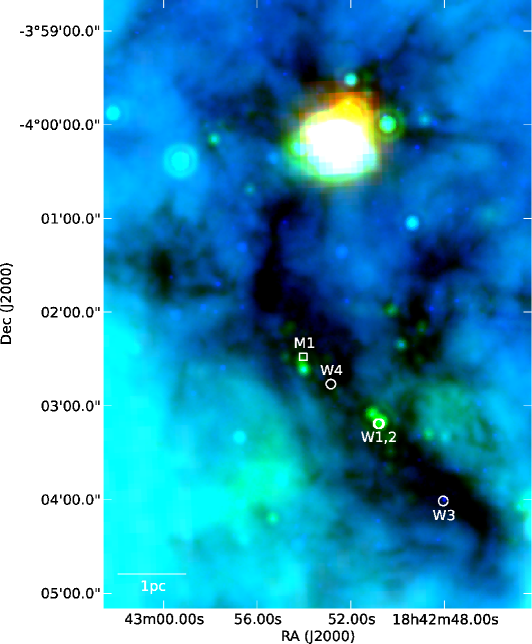
We report maser detections based on the following criteria: (a) Peak flux 6; (b) Emission continues at least two channels with flux 4; and (c) Within the primary beam response of 0.3. We adopt these criteria because at some channels the images are contaminated by the side lobes of a strong maser located at P2, well outside of the primary beam. Using the criteria, we identify 4 water masers (W1–4) and 1 methanol maser (M1), as presented in Figure 2. Positions of the masers are obtained by fitting a two dimensional Gaussian to the brightness distribution of the maser emission. The positional uncertainty is 0. All masers are either coincident with or close to infrared point sources at 8–24 m.
Comparing the maser positions and velocities with previous observations made with VLA (Wang et al. 2006, resolution 2′′) and GBT (Chambers et al. 2009, resolution 30′′), we find that W1, W3, and W4 are new features, while W2 and M1 are spatially and spectrally coincident with two masers reported before. Both W2 and M1 have been varying in peak flux during the last several years: W2 was 2.4 Jy on 2005 September 23/24, then brightened to 6 Jy on 2006 December 5, and dimmed dramatically to 0.03 Jy on 2010 November 24; M1 dimmed from 0.24 Jy on 2006 December 5 to 0.02 Jy on 2010 November 24. On the other hand, W1 and W3 were either newly emerged or experienced brightening between 2006 and 2010, otherwise they should have been detected by Chambers et al. (2009). W4 is below the detection limit of Chambers et al. (2009).
Among all the five detected masers, only two (W1, W2) are associated with emission above significance. W1 and W2 locate right on top of the dust condensations SMA2a and SMA2b, respectively, and thus are presumably excited by the protostars embedded in the same dust condensations. The position discrepancy between the H2O maser with its exciting protostar is within a fraction of 1000 AU.
4 Discussion
4.1 Outflow Heating
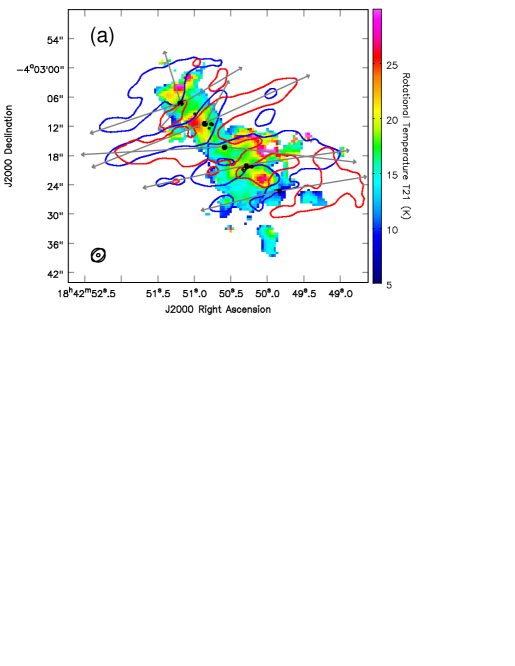
Intensity ratios of the main and hyperfine components from multiple (J,K) transitions constrain rotational temperature which well approximates kinetic temperature in the regime of 20 K (Ho & Townes, 1983; Walmsley & Ungerechts, 1983). In the following analysis, we assume that the rotational temperature is the same as the kinetic temperature when the former is 20 K. Following the procedure of Ho & Townes (1983), we compute a rotational temperature () map based on the (1,1) and (2,2) images. The images were first smoothed to a common beam of before computing the map. The uncertainty of is estimated to be 3 K. Figure 3(a) shows with the dust condensations and the CO (3–2) outflows superposed. The map reveals a highly structured temperature profile ranging from 8 to 30 K, opposite to the smooth temperature profiles observed in other IRDCs (Ragan et al., 2011). This may be due to beam dilution since the data in Ragan et al. (2011) have a larger beam. A number of remarkable enhancements ( K) are present among the entire map, but surprisingly none of the temperature enhancements coincide with any dust condensations. Instead, all the enhancements spatially match the footprint of the outflows.
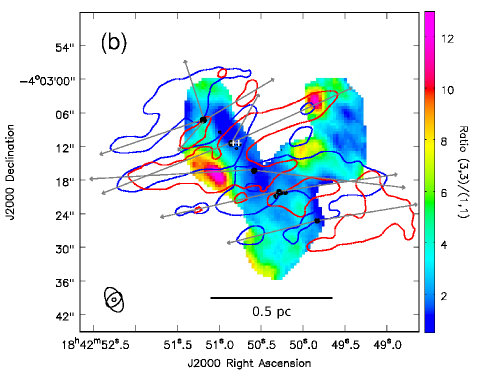
Since the (3,3) is more widely spread than the (1,1) toward the northwest where the signal-to-noise ratio of (1,1) prohibits us from computing opacity, it is difficult to derive a reliable rotational temperature map from the (1,1) and (3,3) lines. Instead, we compute the intensity ratio of the main hyperfine of (3,3)/(1,1), , as plotted in Figure 3(b). To compute the intensity ratio, the (1,1) image was first smoothed to the beam of the (3,3) image. The intensity ratio is positively correlated with the rotational temperature (Ho & Townes, 1983; Zhang et al., 2002). For reference, assuming optically thin emission and the same abundance for the ortho and para (Zhang et al., 2007), , 2, and 5 correspond to rotational temperatures of , 55, and 109 K, respectively. Like the map, the map is also highly structured. varies continuously from 0.3 to 12.5 over the map. Again several hot spots represented by peaks (corresponding to (3,3) emission peaks A–E) match the outflow footprint and are offset from the dust condensations. In addition to the peaks, there is a low valley along SMA2 to SMA3. Optically thin thermal (3,3) emission should have (Ho & Townes, 1983). Higher values are seen toward peaks A–C, indicative of non-thermal emission. Toward peak B, the (3,3) emission is weakly amplified (Figure 4), resembling an (3,3) maser similar to those found in other massive star formation regions where outflows are present (e.g. Mangum & Wootten, 1994; Zhang & Ho, 1995; Beuther et al., 2007; Brogan et al., 2011). However the spatial resolution is insufficient to constrain the brightness of this emission feature.
The morphological match between the heated gas and the outflow footprint suggests that the heating in the P1 region is due to protostellar outflows. Indeed, all the hot spots exclusively coincide with large (3,3) line widths compared to relatively small line width toward the dust condensations (Figure 4), likely indicative of gas motion and extra turbulence injected by the outflow shocks. The outflow heating has two important features. First, the heating alters thermal property of the gas throughout the clump, from a distance 0.1 pc up to 0.5 pc away from the driving protostars. Second, the heating is localized and far from well mixed. The temperature at the low valley is not high enough to suppress further fragmentation into Jeans mass of 1 (Wang et al., 2011). We probably have witnessed through EVLA and SMA the very beginning of an outflow induced gas heating.
4.2 Radiative Heating
It is apparent that protostellar outflows can introduce significant heating to the ambient gas. What is the effect of protostellar radiation? Is radiative heating from low mass protostars sufficient to suppress fragmentation and aid the formation of massive cores? The fact that all dense cores correspond with low is intriguing. In addition, the temperature map in Figure 3(a) indicates that dense cores have typical temperatures of 18 K, and are offset from the high temperature peaks. The temperature distributions suggest that the heating of low mass protostars may not play a significant role in the formation of dense cores detected with the SMA. Otherwise, massive cores should be found at the peaks of the temperature distribution. Longmore et al. (2011) made a similar statement for a hot molecular core G8.68–0.37.
It is also interesting to note that the protostars embedded in the SMA cores have not produced significant heating. SMA1 to SMA4 have a rather uniform of 18 K, while SMA5 has a lower of 9 K. We caution that the map has a beam, so any temperature structure has been smoothed to a spatial scale of 0.065 pc. How much luminosity is required to heat the gas to 18 or 9 K at a radius of 0.065 pc from the central source? Assuming thermal equilibrium between gas and dust, the luminosity can be estimated following the equation (Scoville & Kwan, 1976; Garay & Lizano, 1999):
where is the dust emissivity at far infrared wavelengths (Rathborne et al., 2010), is the dust emissivity at 50 m (Scoville & Kwan, 1976), and pc is the radius from the central protostar. We estimate a luminosity of 30 for each protostar embedded in SMA1, SMA2a, SMA3, and SMA4a, and 1 for the protostar SMA5. These values should be taken with caution because the beam dilution may introduce large uncertainty in both temperature and radius. Nevertheless, we note that the luminosity of SMA2a is in rough agreement with the luminosity inferred from SED for the 24 m source in the SMA2 vicinity (102 , Wang et al., 2008). A lack of significant heating from the growing protostars is consistent with non detection of line emission from organic molecules (Zhang et al., 2009; Wang et al., 2011).
4.3 Origin of the Minor Filament
The origin of the low-density minor filament is rather interesting. A low-density streak perpendicular to a high-density oblate region is expected if magnetic field is dynamically important compared to self-gravity and turbulence during the formation of the system (Li et al., 2011). In this case, gravitational contraction along the field lines is more efficient, resulting in a high-density region perpendicular to the magnetic field, while on the other hand turbulence is also channeled by the field and gives rise to streaks aligned with the magnetic field in the lower-density region. This phenomenon has been seen in simulations (Price & Bate, 2008; Nakamura & Li, 2008) and in observations of NGC 2024 in Orion (Li et al., 2011). In G28.34-P1, the -shaped filamentary system projected on the sky is almost perpendicular. If the system were formed from the same mechanism, one should expect a mean magnetic field along the minor filament and perpendicular to the main filament. Based on the JCMT dust polarization data cataloged by Matthews et al. (2009), we derived a mean B-field direction of as labeled on Figure 1. Because the main filament has a P.A. of (Wang et al., 2011), the separation angle between the mean B-field and the main filament is . The mean magnetic field at the clump scale is indeed along with the minor filament and roughly perpendicular to the main filament. The large deviation in the B-field direction may indicate that the strong outflows have started to disturb the initially ordered field lines in the inner part of P1 (Li et al., 2009). Therefore we speculate that the minor filament originates from turbulence anisotropy during the formation of the -shaped filamentary system, and that the formation process has been governed by the interplay between strong magnetic field, self-gravity, and turbulence.
| Parameter/Line | (1,1) | (2,2) | (3,3) | H2O/CH3OH |
|---|---|---|---|---|
| Observing date | 2010Oct09 | 2010Oct11 | 2010May09 | 2010Nov24 |
| Configuration | C | C | D | C |
| Rest frequency (GHz) | 23.694 | 23.722 | 23.870 | 22.235/24.959 |
| Primary beam (′) | 2 | 2 | 2 | 2 |
| Gain calibrator | J1851+005 | J1851+005 | J1851+005 | J1851+005 |
| Flux calibrator aaAbsolute flux is accurate to about 5%. | 3C48 | 3C48 | 3C48 | 3C48 |
| Bandpass calibrator | 3C454.3 | 3C454.3 | 3C454.3 | 3C454.3 |
| Phase center bbPhase center I at (R.A., decl.); II at . | I | I | II | II |
| Integration time (minute) | 95 | 95 | 21 | 15/15 |
| Bandwidth (MHz) | 4 | 4 | 4 | 4 |
| Polarization | dual | dual | dual | full |
| Naive channel width (km s-1) | 0.2 | 0.2 | 0.2 | 0.8 |
| Final channel width (km s-1) | 0.3 | 0.3 | 0.3 | 0.8 |
| Synthesized beam (′′) cc Final (1,1) and (2,2) images are made by adding archival D array data (Section 2). | / | |||
| RMS noise (mJy/beam) dd rms noise measured in final images. | 1.2–1.5 | 1.2–1.5 | 3 | 1.2–1.5/0.8 |
| Convention factor (K/Jy) | 367 | 388 | 165 | 1939/1484 |
| Weighting method | natural | natural | natural | robust/natural |

References
- Beuther et al. (2007) Beuther, H., Walsh, A. J., Thorwirth, S., Zhang, Q., Hunter, T. R., Megeath, S. T., & Menten, K. M. 2007, A&A, 466, 989
- Brogan et al. (2011) Brogan, C. L., Hunter, T. R., Cyganowski, C. J., Friesen, R. K., Chandler, C. J., & Indebetouw, R. 2011, ApJ, 739, L16+
- Carey et al. (2000) Carey, S. J., Feldman, P. A., Redman, R. O., Egan, M. P., MacLeod, J. M., & Price, S. D. 2000, ApJ, 543, L157
- Carey et al. (2009) Carey, S. J., et al. 2009, PASP, 121, 76
- Chambers et al. (2009) Chambers, E. T., Jackson, J. M., Rathborne, J. M., & Simon, R. 2009, ApJS, 181, 360
- Chen et al. (2010) Chen, H., Liu, S., Su, Y., & Zhang, Q. 2010, ApJ, 713, L50
- Churchwell et al. (2009) Churchwell, E., et al. 2009, PASP, 121, 213
- Curtis et al. (2010) Curtis, E. I., Richer, J. S., Swift, J. J., & Williams, J. P. 2010, MNRAS, 408, 1516
- Garay & Lizano (1999) Garay, G., & Lizano, S. 1999, PASP, 111, 1049
- Ho & Townes (1983) Ho, P. T. P., & Townes, C. H. 1983, ARA&A, 21, 239
- Krumholz (2006) Krumholz, M. R. 2006, ApJ, 641, L45
- Krumholz et al. (2010) Krumholz, M. R., Cunningham, A. J., Klein, R. I., & McKee, C. F. 2010, ApJ, 713, 1120
- Lada & Lada (2003) Lada, C. J., & Lada, E. A. 2003, ARA&A, 41, 57
- Larson (1985) Larson, R. B. 1985, MNRAS, 214, 379
- Li et al. (2011) Li, H.-B., Blundell, R., Hedden, A., Kawamura, J., Paine, S., & Tong, E. 2011, MNRAS, 411, 2067
- Li et al. (2009) Li, H.-b., Dowell, C. D., Goodman, A., Hildebrand, R., & Novak, G. 2009, ApJ, 704, 891
- Longmore et al. (2011) Longmore, S. N., Pillai, T., Keto, E., Zhang, Q., & Qiu, K. 2011, ApJ, 726, 97
- Mangum & Wootten (1994) Mangum, J. G., & Wootten, A. 1994, ApJ, 428, L33
- Masunaga & Inutsuka (2000) Masunaga, H., & Inutsuka, S.-i. 2000, ApJ, 531, 350
- Matthews et al. (2009) Matthews, B. C., McPhee, C. A., Fissel, L. M., & Curran, R. L. 2009, ApJS, 182, 143
- Nakamura & Li (2008) Nakamura, F., & Li, Z.-Y. 2008, ApJ, 687, 354
- Pillai et al. (2006) Pillai, T., Wyrowski, F., Carey, S. J., & Menten, K. M. 2006, A&A, 450, 569
- Price & Bate (2008) Price, D. J., & Bate, M. R. 2008, MNRAS, 385, 1820
- Quillen et al. (2005) Quillen, A. C., Thorndike, S. L., Cunningham, A., Frank, A., Gutermuth, R. A., Blackman, E. G., Pipher, J. L., & Ridge, N. 2005, ApJ, 632, 941
- Ragan et al. (2011) Ragan, S. E., Bergin, E. A., & Wilner, D. 2011, ApJ, 736, 163
- Rathborne et al. (2010) Rathborne, J. M., Jackson, J. M., Chambers, E. T., Stojimirovic, I., Simon, R., Shipman, R., & Frieswijk, W. 2010, ApJ, 715, 310
- Rathborne et al. (2006) Rathborne, J. M., Jackson, J. M., & Simon, R. 2006, ApJ, 641, 389
- Scoville & Kwan (1976) Scoville, N. Z., & Kwan, J. 1976, ApJ, 206, 718
- Walmsley & Ungerechts (1983) Walmsley, C. M., & Ungerechts, H. 1983, A&A, 122, 164
- Wang et al. (2011) Wang, K., Zhang, Q., Wu, Y., & Zhang, H. 2011, ApJ, 735, 64
- Wang et al. (2010) Wang, P., Li, Z.-Y., Abel, T., & Nakamura, F. 2010, ApJ, 709, 27
- Wang et al. (2008) Wang, Y., Zhang, Q., Pillai, T., Wyrowski, F., & Wu, Y. 2008, ApJ, 672, L33
- Wang et al. (2006) Wang, Y., Zhang, Q., Rathborne, J. M., Jackson, J., & Wu, Y. 2006, ApJ, 651, L125
- Zhang & Ho (1995) Zhang, Q., & Ho, P. T. P. 1995, ApJ, 450, L63+
- Zhang et al. (2002) Zhang, Q., Hunter, T. R., Sridharan, T. K., & Ho, P. T. P. 2002, ApJ, 566, 982
- Zhang et al. (2007) Zhang, Q., Sridharan, T. K., Hunter, T. R., Chen, Y., Beuther, H., & Wyrowski, F. 2007, A&A, 470, 269
- Zhang et al. (2009) Zhang, Q., Wang, Y., Pillai, T., & Rathborne, J. 2009, ApJ, 696, 268