Comment on “Magnetic-Field-Tuned Quantum Phase Transition in the Insulating Regime of Ultrathin Amorphous Bi Films”
A recent Letter by Lin and Goldman Lin11 presented experimental data for the relative magnetoresistance (MR) in disordered thin films, which were interpreted as evidence of a quantum phase transition. Such films are known to exhibit a superconductor (SC)-insulator transition as a function of disorder GoldmanReview , and a huge peak in the resistance with magnetic field MRold ; MRmore . These highly disordered samples were insulating at zero . The experimental results supporting the quantum phase transition scenario are: (a) the relative magnetoresistance, , at was temperature () independent at a specific, non-universal, field , and (b) near this point all the different- curves collapsed upon rescaling , where and were interpreted as the critical exponents of the transition. In this comment we present an alternative interpretation based on activated transport in a disordered landscape. We first present numerical simulations, and then support them by simple analytic arguments.
Our numerical simulations were performed using a new ab initio technique, based on the disordered negative- Hubbard model, that fully captures the effects of thermal phase fluctuations ConduitMeir10 . The results of this method describe the observed phenomenology of transport through thin disordered SC films, including the origin of the magnetoresistance peak ConduitMeir11 . Here we report results for more disordered systems, which, as in the experiment, are resistive at zero (we used an onsite energy standard deviation of , where is the lattice hopping integral, onsite interaction , and filling). The inset of Fig. 1(b) depicts for several temperatures, with the resulting MR shown in Fig. 1(a), where the main experimental result is reproduced – following a peak, the MR isotherms cross at a constant magnetic field. Near that point, all the curves collapse (Fig. 1b), using the same scaling analysis as in Lin11 , with . The sample displays no notable phenomenon in the local currents and chemical potential at .
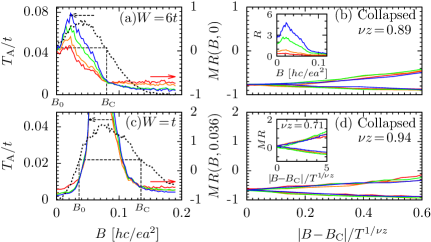
Since our numerical calculations neglect quantum fluctuations, the source of our crossing point cannot be the putative quantum phase transition Lin11 . To understand the crossing we note that both in the theory and in the experiment, the resistance is activated, , with the activation temperature at field , and is the high temperature resistance. Fig. 1(a) shows that , in agreement with experiment, is a non-monotonic function, and, in fact, corresponds to . If obeys the activated behavior above, becomes -independent at . Moreover, expanding around , we find that the scaling function
| (1) |
is in agreement with the experimental fitted form with . (The deviations from perfect scaling come from the weak dependence of on , and from the deviations, both experimentally and numerically, from simple activation at lower temperatures.)
If our interpretation is correct, and was only determined by , the same behavior should be observed in less disordered samples for , where and . Indeed in Fig. 1(c,d) we present results for a sample with lower disorder that is SC at . Again the MR isotherms all cross at , with a reasonable collapse. Moreover the inset of Fig. 1(d) depicts the excellent collapse of the experimental data published in Ref.MRold for a lower disorder sample, with and , supporting our scenario.
In summary, using ab initio simulations and analytic arguments, we have demonstrated an alternative explanation of the experimental results of Ref. Lin11 . The crossing of the MR curves can be understood entirely in terms of activated transport, which our previous analysis attributed to transport through Coulomb blockade islands ConduitMeir11 . Finally, we have made a specific prediction to test our analysis.
G.J. Conduit and Y. Meir
Ben Gurion University, Beer Sheva 84105, Israel
References
- (1) Y.-H. Lin and A.M. Goldman, Phys. Rev. Lett. 106, 127003 (2011).
- (2) For a review, see, e.g., A. Goldman, Physics Today, Nov. 1998, p.41.
- (3) G. Sambandamurthy, L.W. Engel, A. Johansson, and D. Shahar, Phys. Rev. Lett. 92, 107005 (2004)
- (4) M.A. Steiner, G. Boebinger, and A. Kapitulnik, Phys. Rev. Lett. 94, 107008(2005); H.Q. Nguyen, S.M. Hollen, M.D. Stewart, Jr., J. Shainline, Aijun Yin, J.M. Xu, and J.M. Valles, Jr., Phys. Rev. Lett. 103, 157001 (2009).
- (5) G.J. Conduit and Y. Meir, Phys. Rev. B 84, 064513 (2011).
- (6) G.J. Conduit and Y. Meir, arxiv/1111.2941.