20xx Vol. 9 No. XX, 000–000
22institutetext: Graduate School of Chinese Academy of Sciences, Beijing 100863, China
\vs\noReceived [year] [month] [day]; accepted [year] [month] [day]
Temporal Variation of the Hemispheric Solar Rotation
Abstract
The daily sunspot numbers of the whole disk as well as the northern and southern hemispheres from January 1, 1945 to December 31, 2010 are used to investigate the temporal variation of the rotational cycle length through the continuous wavelet transformation analysis method. The auto-correlation function analysis of daily hemispheric sunspot numbers shows that the southern hemisphere rotates faster than the northern hemisphere. The results obtained from the wavelet transformation analysis are: there exists no direct relationship between the variation trend of the rotational cycle length and the variation trend of solar activity in the two hemispheres; the rotational cycle length of both hemispheres has no significant period appearing at the 11 years, but has significant period of about 7.6 years. Analysis concerning the solar cycle dependence of the rotational cycle length shows that in the whole disk and the northern hemisphere acceleration seems to appear before the minimum time of solar activity. Furthermore, the cross-correlation study indicates that the rotational cycle length of the two hemispheres has different phases, and the rotational cycle length of the whole disk as well as the northern and southern hemispheres also has phase shifts with the corresponding solar activity. What’s more, the temporal variation of North-South (N-S) asymmetry of the rotational cycle length is also studied; it displays the same variation trend as the N-S asymmetry of solar activity in a solar cycle as well as in the considered time interval, and it has two significant periods of 7.7 and 17.5 years. Moreover, the N-S asymmetry of the rotational cycle length and the N-S asymmetry of solar activity are highly correlated. It’s inferred that the northern hemisphere should rotate faster at the beginning of solar cycle 24.
keywords:
Sun: activity — Sun: rotation — Sun: sunspot1 Introduction
There are two main methods used in investigating the solar rotation rate: the trace method and the spectroscopic method Paternò (2010). And it is found that the Sun has a higher rotation rate in the equatorial region: 26 days at the equator while 30 days at latitude Lawrence et al. (2008); Le Mouël et al. (2007). More details about different measures of the Sun’s rotation rate can be found in the review papers Howard (1984); Schroeter (1985); Snodgrass (1992); Beck (2000); Paternò (2010). Hoping to reach a more synthetic view of solar rotation, Heristchi & Mouradian Heristchi2009 (2009) suggested a method called global rotation applied to structures of solar activity. Using this method, they indicated that individual structures, local proper motions, meridian drift or differential rotation could be analyzed together in the considered time.
How the solar differential rotation varies in a solar cycle as well as in a long time is still an unsolved problem. Li et al. 2011a ; 2011b used a continuous complex Morlet wavelet transformation to investigate the temporal variations of the rotational cycle length of daily sunspot areas and daily sunspot numbers from a global point of view, and indicated that the rotational cycle length of the Sun had a secular trend, and the rotational period had no relation with the Schwabe cycle. Li et al. 2011b pointed out that a lower than average rotation velocity should statistically appear around the maximum time of solar activity, while around the minimum time the rotation velocity was very close to the average. But Gilman & Howard Gilman1984 (1984), Zuccarello & Zappalá Zuccarello (2003) and Brajša et al. Brajsa2006 (2006) claimed a higher than average rotation velocity appear in the minimum time of solar activity.
The North-South (N-S) asymmetry in solar activity is an important part of solar physics. A lot of research has been done based on various solar activity indices on the solar surface. More details about the N-S asymmetry can be found in Vizoso & Ballester Vizoso1990 (1990), Verma Verma1993 (1993), Carbonell et al. Carbonell1993 (1993, 2007), Li et al. li2001 (2001, 2002, 2010), and Sýkora & Rybák Sykora2010 (2010). Besides, the rotational periods are also subjected to a N-S asymmetry Temmer et al. (2003). Gilman & Howard Gilman1984 (1984) found that in the northern hemisphere the rotation was more solid-body-like. Javaraiah & Ulrich Jav2006 (2006) indicated that there existed difference in the hemispheric rotation rates. Howard et al. Howard1984b (1984) analyzed the large spots data and found that the rotation rate increased less in the northern hemisphere. Antonucci et al. Antonucci1990 (1990) investigated the rotational period of the photospheric magnetic field during cycle 21 and their results showed that the two hemispheres had different dominant periods— 26.9 days for the northern hemisphere and 28.1 days for the southern hemisphere. Also, the result of Temmer et al. 2002a ; 2002b concerning the rotational periods of flare and sunspot numbers accorded with the periods found by Antonucci et al. Antonucci1990 (1990). However, the observational result of Balthasar et al. Balthasar1986 (1986) indicated that the sunspots had a little higher rotation rate in the southern hemisphere by analyzing sunspot groups of all types in the period 1874-1976. Georgieva & kirov Georgieva2003 (2003) indicated that the two hemispheres not only rotated differently but aslo had different periodicities in the variations of the rotation parameters. The N-S asymmetry in hydrogen filament rotation has been studied by Gigolashvili Gigolashvili2001 (2001) and Gigolashvili et al. Gigolashvili2003 (2003). They found that the sign of asymmetry changed with the hale period, and they suggested that the N-S asymmetry of the solar rotation might be connected with the N-S asymmetry of solar activity.
This work follows the previous study of Li et al. 2011a ; 2011b . We still use the continuous complex Morlet wavelet transformation to obtain the rotational signals reflected in the daily hemispheric sunspots’ wavelet power spectrum from a global point of view, and then conduct further research on temporal variation of the solar rotation separately into the northern and southern hemispheres and on their relationship with the hemispheric solar activity. In addition, we investigate the N-S asymmetry of the solar rotational cycle length, including its time-variation, its periodicity, and also its relationship with the N-S asymmetry of solar activity.
2 The rotational signal in daily Hemispheric sunspot numbers
2.1 Data
The time series data analyzed in our study are:
(1) The daily northern and southern hemispheric sunspot numbers ( January 1, 1945 to December 31, 2004 )111 ftp://cdsarc.u-strasbg.fr/pub/cats/J/A+A/447/735/, compiled by Temmer et al. Temmer2006 (2006).
(2) The daily northern and southern hemispheric international sunspot numbers (January 1, 2005 to December 31, 2010)222 http://sidc.oma.be/sunspot-data/. This time series actually starts from January 1, 1992, thus there is an overlapping time span from January 1, 1992 through December 31, 2004 with the first time series. However, in general, the first one renders the second very well (for details, see Temmer et al. Temmer2006 (2006)).
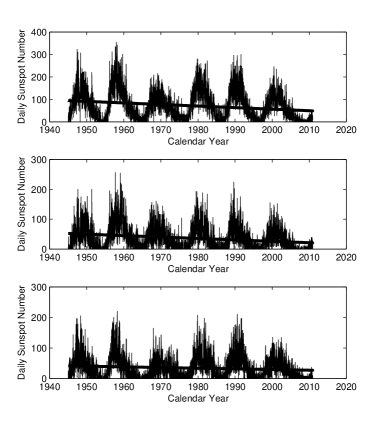
Figure 1 shows the data and their linear regressions against time (daily sunspot number on the whole solar disk at a certain time is the number in the northern hemisphere plus that in the south at the same time). It’s obvious that the daily sunspot numbers of the whole solar disk as well as the northern and southern hemispheres all have a decrease trend during the time interval considered.
2.2 Rotational Period
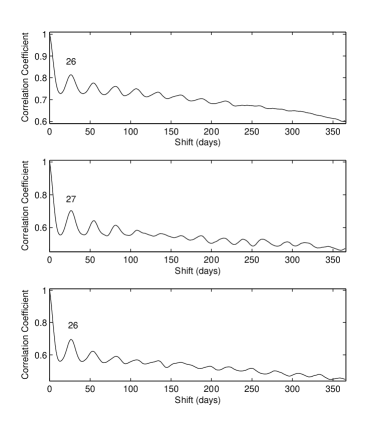
The auto-correlation function is used here to detect the periodicity of daily hemispheric sunspot numbers, which is shown in Figure 2. The auto-correlation coefficients of the daily hemispheric sunspot numbers show that the rotational period is the only period in the time scale shorter than 1 year, whose value is 26, 27, and 26 days for the whole disk, the northern, and southern hemispheres, respectively. It means that the southern hemisphere rotates faster over the considered time interval.
We also employ the continuous complex Morlet (dimensionless frequency =6) wavelet transformation Torrence & Compo (1998) here to study the periodicity of daily hemispheric sunspot numbers. The wavelet anylysis decomposes a transform from a one-dimensional time series into a two-dimensional time-frequency space. Therefore, this method determines not only the periodicities of the dominant modes of variability, but also shows how the modes vary in time Torrence & Compo (1998); Chowdhury & Dwivedi (2011). The Morlet wavelet used in the paper is defined as
| (1) |
where is the dimensionless frequency and is the dimensionless time. When using wavelets for feature-extraction purposes, the Morlet wavelet (with =6) is a good choice, since it provides a good balance between time and frequency localization Torrence & Compo (1998); Grinsted et al. (2004).
As the wavelet is not completely localized in time, the continuous wavelet transformation is subject to edge artefacts. It is thus useful to introduce a cone of influence (COI) in which the transform suffers from these edge effects (see the regions outside the thick dashed lines in Figures 8 to 10 as well as in Figure 14). The COI is defined as the wavelet power for a discontinuity at the edges decreases by a factor . Portions of the transform that are outside the area encompassed by the time axis and the COI are subject to these edge effects and are therefore unreliable Torrence & Compo (1998); Grinsted et al. (2004); De Moortel et al. (2004); Li et al. (2006); Chowdhury & Dwivedi (2011).
The significance levels for the wavelet power spectra are calculated assuming a mean background spectrum modeled with a univariate lag-1 autoregressive process. To determine the significance levels, one first needs to choose an appropriate background spectrum. For many time series, an appropriate background spectrum is either white noise or red noise. Throughout this paper, the statistical significance test is carried out by assuming that the noise has a red spectrum, that is a red noise background is considered. In a red noise spectrum, the discrete Fourier power spectrum, after normalizing, is
| (2) |
where , …, is the frequency index, is the number of data and is the assumed lag-1 autocorrelation. When , we obtain the white-noise spectrum with an expectation value of one at all frequencies Torrence & Compo (1998); Chowdhury & Dwivedi (2011).
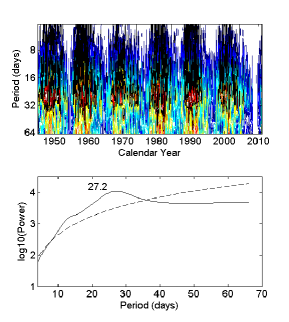
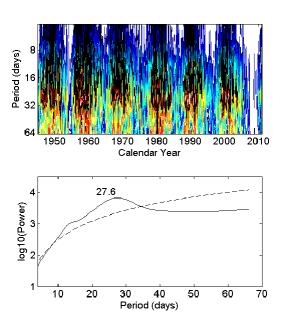
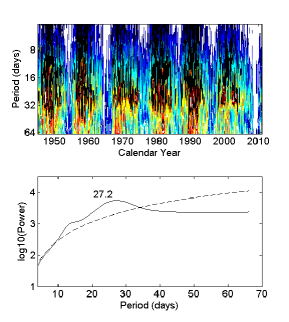
Presented in Figures 3 to 5 are the local wavelet power spectrum and the global power spectrum of the daily sunspot numbers for the whole disk, the northern hemisphere, and the southern hemisphere, respectively. Before performing the wavelet transformation, the raw data need to be normalized, that is the process of subtracting the mean value of the data and then dividing by the variance of the data. As the local wavelet power spectrum shows, the highest power belt appears around the rotational cycle of the Sun, and it can be seen clearly around the maximum time of the sunspot cycle. The figures of the global power spectrum also indicate that the rotation period is the only period (at the 95% confidence level), in the time scale shorter than 64 days. From a global point of view, the values of the rotational periods are 27.2, 27.6, and 27.2 days for the the whole disk, the northern and southern hemispheres, respectively.
2.3 Long-term Variations of the Solar Rotation
How the period length of the rotational cycle (PLRC) changes with time are presented in figure 6. At a certain time point, the rotational period (scale) has the highest spectral power among the period scales of 25 to 31 days (the cycle length of the differential rotation of sunspots also locates within this range(Temmer et al. 2002b; Yin et al. 2007)) in the local wavelet power spectrum (see Figs. 3 to 5), upon that the rotational period at each time can be determined. After that, a 2-year smoothing was introduced to the obtained temporal variation of the rotational cycle length, and the new time series and the linear regression lines are given in Figure 6. The rotational cycle length of the northern and southern hemispheres has different varying trends, but as Figure 1 shows, the hemispheric sunspot numbers have the same decreasing trends. Hence, we suggest that the trend of the rotation rate maybe have no direct relation with the trend of the sunspot numbers.
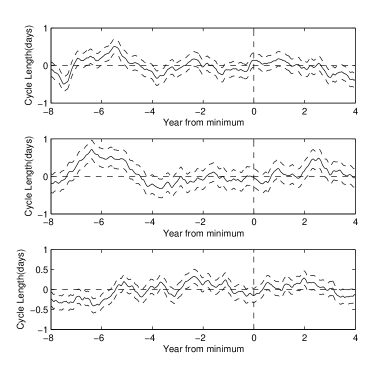
Moreover, as Brajša et al. Brajsa2006 (2006) and Li et al. 2011b did, we also investigate the cycle-related variation of the solar rotation rate, separated into the whole disk, the northern and southern hemispheres, respectively. As Figure 7 shows, in the whole disk and the northern hemisphere, a higher than average velocity appears before the minimum time of solar activity. However, in the southern hemisphere, the pattern isn’t clear seen. Maybe, it’s affected by the phase difference between the northern hemisphere and the southern one (see section 3).
2.4 The Periodicity in the Temporal PLRC
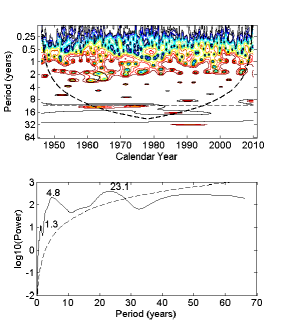
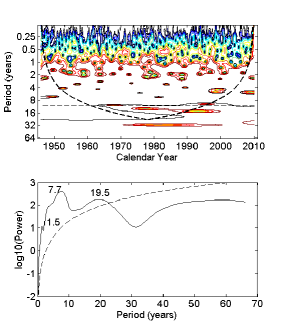
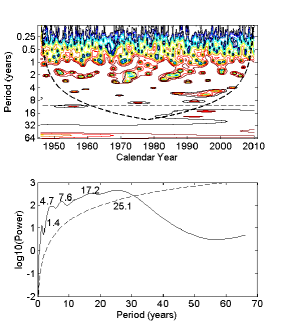
For further study, the complex Morlet (dimensionless frequency =6) wavelet transformation Torrence & Compo (1998) is used again to investigate the periodicity in the temporal PLRC of daily hemispheric sunspot numbers, and the results are represented in Figures 8 to 10. PLRC is normalized first, too. For PLRC, no significant period (scale) seems to appear at the 11-year Schwabe cycle in the whole disk as well as in the northern and southern hemispheres. This indicates that PLRC might have no relation with the Schwabe cycle, in agreement with Li et al. 2011a . However, two significant periods of 7.7 and 19.5 years can be seen for the northern hemisphere, while 4.7, 7.6, 17.2 and 25.1 years for the southern hemisphere, and 4.8 and 23.1 years for the whole disk (as the data are 2-year smoothed, periods less than 2 years are not reliable).
3 Relationship of PLRC with solar activity
Figure 11 shows the cross-correlation coefficient between the smoothed rotational cycle length of the northern and southern hemispheres. In the figure, the abscissa indicates the shift of the northern hemispheric rotational cycle length with respect to the southern hemispheric rotational cycle length, with negative values representing backward shifts. From the figure, one can find that the northern one lags the southern one by about 3 years.
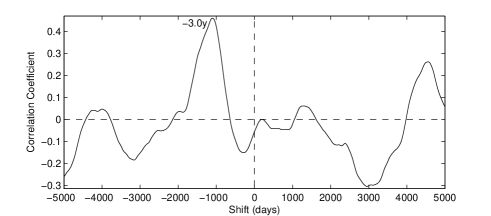
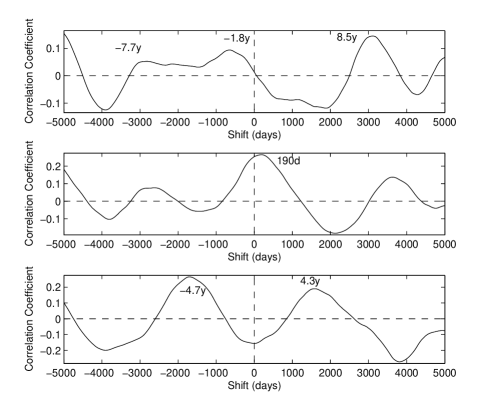
Figure 12 shows the cross-correlation coefficient between the rotational cycle length and the corresponding 2-year smoothed daily hemispheric sunspot numbers. In the figure, the abscissa indicates the shift of the rotational cycle length with respect to the daily hemispheric sunspot numbers, with negative values representing backward shifts. From the figure, one can find that rotational cycle length lags the sunspot numbers by about 1.8 years in the whole disk, leads by about 190 days in the northern hemisphere, and lags by about 4.7 years in the southern hemisphere. The three phase shifts are all different from one another, and the phase shifts in the whole Sun and in the northern hemisphere are both small, therefore the solar-cycle related variations of the rotational cycle length on the whole Sun and in the northern hemisphere look more similar with each other.
4 N-S asymmetry of the rotational cycle length
4.1 N-S Asymmetry
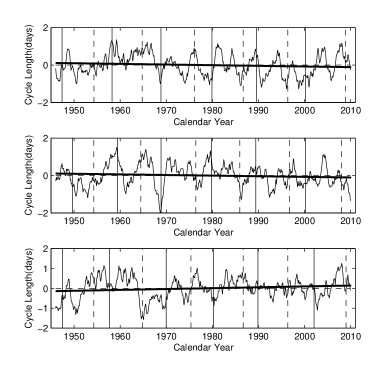
The N-S asymmetry is calculated traditionally by means of , where and stand for the rotational cycle length (or the 2-year smoothed daily sunspot numbers) in the northern and southern hemispheres, respectively. The obtained values (the thin solid lines) and their regression lines (the thick dashed lines) are plotted in Fig. 13. From the figure, one can find that the variation trend of N-S asymmetry of the rotational cycle length displays the same variation trend as the N-S asymmetry of daily sunspot numbers in the considered time interval. It means that in the considered time interval while solar activity in the southern hemisphere becomes stronger and stronger, the southern hemisphere rotates more and more slowly.
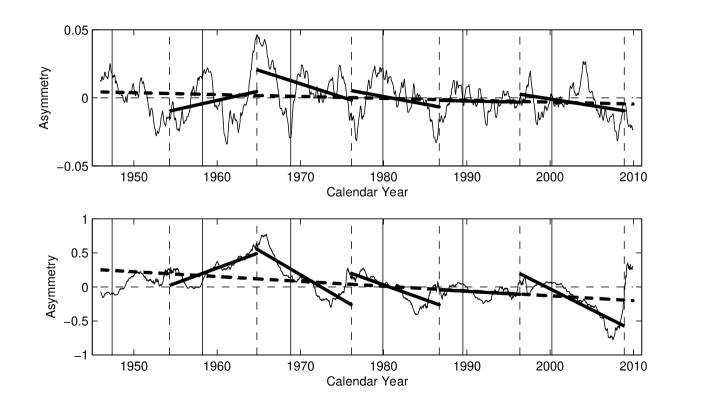
As Vizoso & Ballester Vizoso1990 (1990), Ataç & Özgüç Atac1996 (1996), and Li et al. li2002 (2002) did, here we fit a straight line to the daily values of the asymmetry, for each of solar cycles 19 to 23 separately (cycles 18 and 24 are not a complete cycle in the considered time), starting each cycle with the time of the minimum between two consecutive cycles (see the thick solid lines in Fig. 13). The panels show that the slopes of these fitted straight lines are positive for the first cycle, but negative for the subsequent four cycles. Such a positive (negative) sign for a cycle here in the top panel of Fig. 13 means that the northern (southern) hemisphere rotates more and more slowly, related to the southern (northern) hemisphere, when solar activity is progressing into the cycle. And a positive (negative) sign for a cycle in the bottom panel of Fig. 13 means that the northern (southern) hemispheric solar activity becomes stronger and stronger, related to the southern (northern) hemispheric solar activity, when solar activity is progressing into the cycle. Comparing the two panels of Fig. 13, we can conclude that, in a solar cycle, when one hemispheric solar activity becomes stronger and stronger, this hemisphere rotates more and more slowly. Vizoso & Ballester Vizoso1990 (1990) proposed a regularity that the slope of the straight fitted line changes its sign for every four cycles, and there has been no exception so far. From the preceding discussion and the regularity, it’s inferred that on cycle 24, the N-S asymmetry of the hemispheric PLRC should have a positive sign, accordingly at the beginning of cycle 24, the northern hemisphere should have a shorter rotational periods, namely the northern hemisphere should rotate faster at first, and then it will rotate more and more slowly.
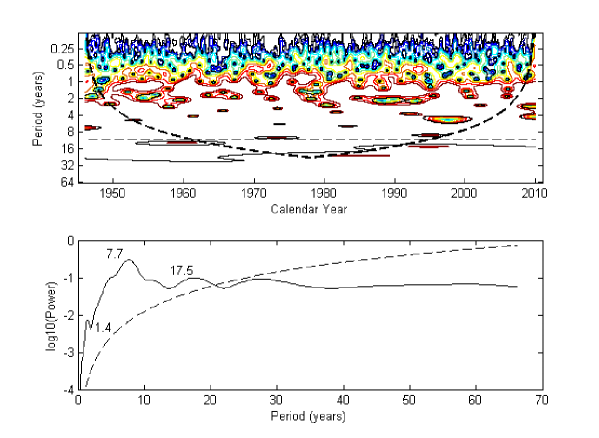
What’s more, we investigate the periodicity of the N-S asymmetry of the daily hemispheric rotational cycle length by using the complex Morlet wavelet transformation again (Figure 14), and find that no significant period (scale) seems to appear at the 11-year Schwabe cycle, but there are two significant periods at the 95% confidence level, whose values are 7.7 and 17.5 years (as the data are 2-year smoothed, 1.4-year period is not reliable), and the 7.7-year period consists with aforesaid period of the hemispheric rotational cycle length.
4.2 Relationship of the N-S Asymmetry of PLRC with the N-S Asymmetry of Solar Activity
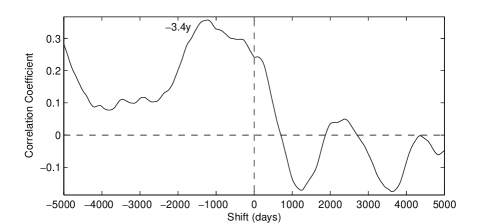
Figure 15 shows the cross-correlation coefficient between the N-S asymmetry of the rotational cycle length and the N-S asymmetry of the daily sunspot numbers. In the figure, the abscissa indicates the shift of the N-S asymmetry of the rotational cycle length with respect to the N-S asymmetry of the daily hemispheric sunspot numbers, with negative values representing backward shifts. As the figure shows, the two have a high correlation coefficient of 0.24 when there is no shift between the two. And when the N-S asymmetry of daily hemispheric sunspot numbers moved backward 3.4 years, the cross-correlation coefficient reaches its peak.
5 Conclusions and Discussion
The long-time variations of the solar rotation rate are studied in the northern and southern hemispheres respectively through a continuous wavelet transformation method from a global point of view, and the main results are listed as follows:
1. The autocorrelation function indicates that the southern hemisphere rotates faster than the northern hemisphere in the considered time interval. Lusting Lusting (1983) studied the solar differential rotation by using positions of sunspots of the years from 1947 to 1981, and found that the southern hemisphere had a smaller gradient of the differential rotation than the northern hemisphere had, in other words, the southern hemisphere rotated faster than the northern hemisphere. And from the Table 1 of Javaraiah et al. Jav2005 (2005), we may find that the southern hemisphere indeed had a smaller gradient of differential rotation. To answer why the southern hemisphere rotates faster, one need to make further study of the reasons for the difference of the long-time variations of the gradient of differential rotation in two hemispheres.
2. The rotational cycle length of the northern and southern hemispheres has different variation trends, while solar activity in the two hemispheres has the same variation trend. It means that the long-time variation trend of hemispheric rotation rate has no direct relation with the variation trend of solar activity in the considered time. Li et al. 2011c pointed out that secular trends of solar rotation on an average of latitudes or at a certain latitude should change with latitudes. Thus it may be one possible reason for the different trends of the two hemispheres’ rotational cycle length that the sunspots of the northern and southern hemispheres form in different average latitudes in the considered time. Further research is needed.
3. The rotational cycle length of both the hemispheres has no significant period (scale) appearing at the 11-year Schwabe cycle, in accordance with Li et al. 2011a , but both has significant period of about 7.6 years. And the period of about 7.6 years has been found in the periodicity of the surface equatorial rotation rate by Javaraiah et al. Jav2009 (2009).
4. In the whole disk and the northern hemisphere, a higher than average velocity appear before the minimum time of solar activity. This may be caused by the phase difference and periodic difference between the hemispheric rotational cycle length and the hemispheric solar activity, and may be also influenced by spatial-temporal distribution of the sunspots. The solar-cycle dependence of the two hemispheres’ rotational cycle length is also different, and this may be the result of the phase shift between the northern and southern rotational cycle length, as well as the phase shift between the northern and southern solar activity.
5. The rotational cycle length of the northern and southern hemispheres shows difference in their phases. Additionally, the phase shifts between the rotational cycle length and the sunspot numbers in the north, south and the whole disk are different from one another. Since the relation between the hemispheric rotation and the hemispheric sunspot activity is complex, in-depth research is needed.
6. The N-S asymmetry of the rotational cycle length has the same variation trend as the N-S asymmetry of solar activity in a solar cycle as well as in the considered time interval. The N-S asymmetry of the rotational cycle length has two significant periods — 7.7 and 17.5 years. Moreover, it has high correlation with the N-S asymmetry of sunspot activity. On the basis of the aforementioned characteristic and the regularity advanced by Vizoso & Ballester Vizoso1990 (1990) and Li et al. li2002 (2002), it’s inferred that the northern hemisphere should rotate faster at the beginning of solar cycle 24.
Acknowledgements.
The authors are indebted to Professor Ke-Jun Li for his constructive ideas and helpful suggestions on manuscript. The authors wish to express their gratitude to an anonymous reviewer for his/her careful reading of the manuscript and valuable comments which improved the paper considerably. Data used here are all downloaded from Web sites. The authors express their deep thanks to the staffs of these Web sites. The wavelet software was provided by C. Torrence and G. Compo. It is available at URL: http://paos.colorado.edu/research/wavelets/. This work was funded by the National Natural Science Foundation of China (NSFC) under Nos.10873032, 10921303, 11073010 and 40636031, and the National Key Research Science Foundation(2011CB811406).References
- (1) Antonucci, E., Hoeksema, J. T., Scherrer, P. H., 1990, ApJ, 360, 296
- (2) Ataç, T., Özgüç, A., 1996, SoPh, 166, 201
- (3) Balthasar, H., Vazquez, M., Woehl, H., 1986, A&A, 155, 87
- Beck (2000) Beck, J. G., 2000, SoPh, 191, 47
- (5) Brajs̆a, R., Ruždjak, D., Wöhl, H., 2006, SoPh, 237, 365
- (6) Carbonell, M., Oliver, R., Ballester, J. L., 1993. A&A, 274, 497
- (7) Carbonell, M., Terradas, J., Oliver, R., Ballester, J. L., 2007, A&A, 476, 951
- Chowdhury & Dwivedi (2011) Chowdhury, P., Dwivedi, B. N., 2011, SoPh, 270, 365
- De Moortel et al. (2004) De Moortel, I., Munday, S. A., Hood, A. W., 2004, SoPh, 222, 203
- (10) Georgieva, K., Kirov, B., 2003, ESASP, 517, 275
- (11) Gigolashvili, M., 2001, AGM, 18, 249
- (12) Gigolashvili, M. Sh., Mdzinarishvili, T. G., Japaridze, D. R., Chargeishvili, B. B., 2003, NewA, 8, 529
- (13) Gilman, P. A., Howard, R., 1984, ApJ, 283, 385
- Grinsted et al. (2004) Grinsted, A., Moore, J. C., Jevrejeva, S., 2004, NPGeo, 11, 561
- (15) Heristchi, D., Mouradian, Z., 2009, A&A, 497, 835
- Howard (1984) Howard, R., 1984, ARA&A, 22 131
- (17) Howard, R., Gilman, P. I., Gilman, P. A., 1984, ApJ, 283, 373
- (18) Javaraiah, J., Bertello, L., Ulrich, R. K., 2005, ApJ, 626, 579
- (19) Javaraiah, J., Ulrich, R. K., 2006, SoPh, 237, 245J
- (20) Javaraiah, J., Ulrich, R. K., Bertello, L., Boyden, J. E., 2009, SoPh, 257, 61
- Lawrence et al. (2008) Lawrence, J. K., Cadavid, A. C., Ruzmaikin, A., 2008, SoPh, 252, 179
- Le Mouël et al. (2007) Le Mouël, J. L., Shnirman, M.G., Blanter, E.M., 2007, SoPh, 246, 295
- (23) Li, K. J., Yun, H. S., Gu, X. M., 2001, ApJ, 554, 115
- (24) Li, K. J., Wang, J. X., Xiong, S. Y., et al., 2002, A&A, 383, 648
- Li et al. (2006) Li, K. J., Gao, P. X., Qiu, J., 2006, ApJ, 646, 1392
- (26) Li, K. J., Liang, H. F., Feng, W., 2010, RAA, 10, 1177
- (27) Li, K. J., Liang, H. F., Feng, W. et al., 2011a, Ap&SS, 331, 441
- (28) Li, K. J., Shi, X. J., Liang, H. F. et al., 2011b, ApJ, 730, 49
- (29) Li, K. J., Feng, W., Shi, X. J., et al., 2011c, SoPh, submitted
- (30) Lustig, G., 1983, A&A, 125, 355
- Paternò (2010) Paternò, L.,2010, Ap&SS, 328, 269
- Schroeter (1985) Schroeter, E. H., 1985, SoPh, 100, 141
- Snodgrass (1992) Snodgrass, H. B., 1992, ASPC, 27, 205
- (34) Sýkora, J., Rybák, J., 2010, SoPh, 261, 321
- (35) Temmer, M., Veronig, A., Hanslmeier, A., 2002a, ESASP, 505, 587
- (36) Temmer, M., Veronig, A., Hanslmeier, A., 2002b, A&A, 390, 707
- Temmer et al. (2003) Temmer, M., Veronig, A., Rybák, J., Hanslmeier, A., 2003, HvaOB, 27, 59
- (38) Temmer, M., Rybák, J., Bendík, P., Veronig, A., et al., 2006, A&A, 447, 735
- Torrence & Compo (1998) Torrence, Ch., Compo, G. P., 1998, BAMS, 79, 61
- (40) Verma, V. K., 1993, ApJ, 403, 797
- (41) Vizoso, G., Ballester, J. L., 1990, A&A, 229, 540
- (42) Yin, Z. Q., Han, Y. B., Ma, L. H., et al., 2007, ChJAA, 7, 823
- (43) Zuccarello, F., Zappalá, R.A., 2003, AN, 324, 464