The Cosmic Infrared Background Experiment (CIBER): A Sounding Rocket Payload to Study the Near Infrared Extragalactic Background Light
Abstract
The Cosmic Infrared Background Experiment (CIBER) is a suite of four instruments designed to study the near infrared (IR) background light from above the Earth’s atmosphere. The instrument package comprises two imaging telescopes designed to characterize spatial anisotropy in the extragalactic IR background caused by cosmological structure during the epoch of reionization, a low resolution spectrometer to measure the absolute spectrum of the extragalactic IR background, and a narrow band spectrometer optimized to measure the absolute brightness of the Zodiacal light foreground. In this paper we describe the design and characterization of the CIBER payload. The detailed mechanical, cryogenic, and electrical design of the system are presented, including all system components common to the four instruments. We present the methods and equipment used to characterize the instruments before and after flight, and give a detailed description of CIBER’s flight profile and configurations. CIBER is designed to be recoverable and has flown twice, with modifications to the payload having been informed by analysis of the first flight data. All four instruments performed to specifications during the second flight, and the scientific data from this flight are currently being analyzed.
Subject headings:
(Cosmology:) dark ages, reionization, first stars – (Cosmology:) diffuse radiation – Infrared: diffuse background – Instrumentation: spectrographs – Space vehicles: instruments – Zodiacal dust1. Introduction
The extragalactic background light (EBL) is the integrated intensity of all of the photons emitted along a line of sight through the Universe. Since at near infrared (IR) wavelengths the EBL is thought to be dominated by direct emission from stars, a measurement of the EBL at these wavelengths is an integral constraint on the total energy released via the process of nucleosynthesis through the history of the Universe (see Hauser & Dwek 2001 for a comprehensive review). Such measurements are a key constraint on all models of galaxy formation and evolution, connecting the global radiation energy density to star formation, metal production, and gas consumption from the present back to the epoch of reionization.
The Cosmic Infrared Background Experiment (CIBER) is a sounding-rocket borne payload comprising four instruments designed to measure the spectrum of the EBL, test models of the Zodiacal light intensity, and constrain the spatial fluctuations in the EBL imprinted during the epoch of reionization (Bock et al. 2006, Zemcov et al. 2011). The CIBER payload comprises two imaging telescopes (Imagers) which are designed to study spatial fluctuations in the near IR EBL, a low resolution spectrometer (LRS) designed to measure the spectrophotometric properties of the EBL in the range m, and a narrow band spectrometer (NBS) designed to characterize the absolute brightness of the Zodiacal Light (ZL) in a number of astronomical fields. CIBER has flown twice, first on Feb 25, 2009 and second on Jul 10, 2010, and two additional flights of essentially the same payload configuration are planned. A preliminary measurement of the spectrum of the ZL as measured by CIBER is presented in Tsumura et al. (2010).
This paper presents the overall mechanical, cryogenic and electronic design and implementation of the CIBER hardware. In addition, the customized laboratory test equipment and a description of the typical CIBER flight profile and performance are described. The design, scientific motivation and implementation of the individual instruments are presented in separate papers: Bock et al. 2011 discusses the design, implementation and performance of the Imagers, while Tsumura et al. 2011 describes the LRS and Renbarger et al. 2011 the describes NBS. Together, these three papers are hereafter referred to as the “CIBER Instrument Companion” papers. Since the CIBER payload was modified between its two flights to improve its performance, throughout this paper we describe the final configuration from the second flight, and specify the design changes informed by the first flight.
2. CIBER Cryogenic Design
CIBER’s four instrument assemblies are seated on a common optical bench cooled to K which is suspended from fore and aft bulkheads and housed in a vacuum tight skin. In this section we present the mechanical and cryogenic design and implementation of the CIBER experiment insert.
2.1. The CIBER Payload
A model of the CIBER cryogenic insert including the four telescopes is shown in Figures 1 and 2. The sounding rocket defines the coordinate system of the payload, with aft being the side through which the instruments view, and forward in the direction towards the experiment section’s cryostat. Except where noted, aluminum alloy Al-6061 is used throughout the CIBER instrument assembly. In operation, the cryogenic insert is suspended from the experiment section skin which acts as both vacuum jacket and structural member of the rocket assembly (see Section 6). The experiment section is made vacuum tight by the experiment door at the aft end, the skin, and the forward vacuum bulkhead, all of which are manufactured by NSROC111NSROC is the NASA contractor responsible for the implementation and maintenance of the NASA Sounding Rocket Program based at NASA’s Wallops Flight Facility; see http://sites.wff.nasa.gov/code810/nsroc.html.. The skin is gold plated on its interior to reduce its IR emissivity. The forward bulkhead interfaces the experiment section to the rest of the payload and hosts the hermetic connections through which the experiment wiring harness runs (see Section 4).
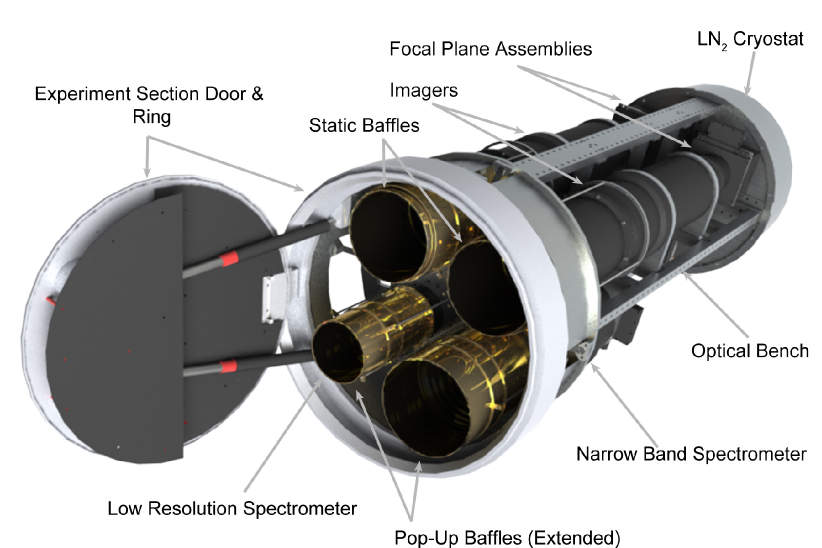
Starting at the forward end of the cryogenic insert, the experiment section comprises a liter liquid nitrogen (LN2) cryostat (described in detail in Section 2.2) with a cm2 work surface. Just forward of the work surface are attached twelve glass fiber reinforced plastic (GFRP) plates which mate to the forward pressure bulkhead. Mounted to the cryostat’s work surface is the optical bench to which the instruments are attached. Figure 1 shows the configuration of the instruments. All four assemblies were designed and manufactured by the Genesia Corporation of Japan using specifications developed by the science team. The specifications for the instruments themselves are described in detail in the CIBER Instrument Companion papers; here we summarize them in Table 1 and below in Sections 2.1.1, 2.1.2 and 2.1.3 for reference.
| Imagersa | LRS | NBS | |
| Aperture | 11 cm | 5 cm | 7.5 cm |
| Pixel size | |||
| Detector array | HAWAII-1 | PICNIC | PICNIC |
| Pixel layout | |||
| FOV | 5 slits, each | ||
| m | m | nm | |
| Optical QE | |||
| Array QE at m | |||
| Astronomical photo current (es) | 15 | ||
| Dark current (es) | |||
| Read noise (e-) | 15 | 26 | 28 |
| Approximate Sensitivity | |||
| (nW/m2/sr, pix) | 30 | 50 | 90 |
| Reference | Bock et al. (2011) | Tsumura et al. (2011) | Renbarger et al. (2011) |
| aCIBER has two imagers on-board, nominally centered near astronomical I and H-bands. | |||
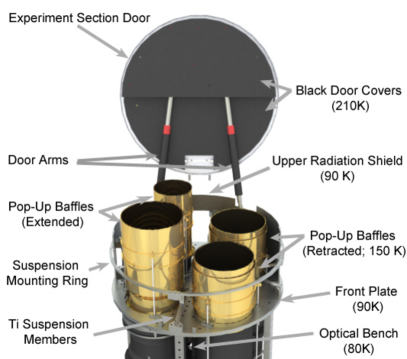
The optical bench’s surface has dimensions cm2, is machined to a thickness of mm, and is light-weighted along its length. Structural spines are mounted to the optical bench to increase the strength of the full assembly and these bisect the optical bench along its top and bottom to create four bays for the instruments. At the aft end of the optical bench is the “front plate” - this serves to stiffen the assembly, interface the bench to the aperture-end suspension, and provide a stable base for the pop up baffle assemblies. The four instrument static light baffles protrude through holes in the front plate which are designed to minimize the space between the edges of the holes and the baffles. The remaining gaps in the front plate are taped closed using aluminized mylar tape; this makes the insert section light-tight while minimizing heat flow from front plate to baffle. This “cryogenic insert” section is surrounded by a cylindrical radiation shield to ensure a low radiative load on the optical bench and instruments over most of their length (see Section 2.2). Fully assembled the insert has diameter mm and length mm.
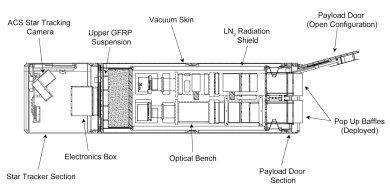
The CIBER cryogenic insert is suspended from the rocket skin by a suspension system. At the top end of the insert, the twelve GFRP plates discussed above support much of the weight of the insert section, while at the bottom the suspension centers the insert in the skin to provide both lateral strength and mm of vertical compliance to take up the change in length of the assembly when it contracts under cooling. The insert is installed with the suspension under compression at room temperature and provides tension when the instruments are cooled and the optical bench has contracted. Simulations were performed on the final optical bench and suspension assembly design to study its harmonic and stress properties before fabrication. In the first flight the forward suspension was composed of eight counter-angled GRFP plates, but these were too large to allow installation of the pop-up baffles (see Section 2.3). In the second flight these GFRP plates were replaced with four counter-angled Grade 5 Titanium plates with a much smaller footprint and are visible in the payload model detail shown in Figure 5. As a result of landing, the first flight’s upper suspension system ruptured at the bolt fixtures on both the bulkhead and cryostat; in the second flight these interfaces were reinforced to mitigate this problem. In both flights, the momentum of the cryogenic insert caused the whole assembly to bounce against the skin at landing due to the top suspension members bending under negative acceleration, which in turn caused the cryogenic fill tubes to rupture. For CIBER’s third flight, bumpers have been installed on the forward vacuum bulkhead which should constrain the motion of the insert along the long axis of the experiment section.
2.1.1 Wide Field Imagers
The CIBER Imagers are optimized to measure fluctuations in the near IR EBL arising during the epoch of reionization. We fly two identical Imager assemblies with different filter sets, one centered at m and the other at m, chosen to bracket the peak in the electromagnetic spectrum of the reionization fluctuations. The Imagers have a continuous field of view to allow measurement of the fluctuation power at scales larger than the expected peak in the angular power spectrum at 10 arcminutes Cooray et al. (2004). The use of commercially available near IR HgCdTe detector arrays with pixels leads to a plate scale of pixel on the sky, which allows removal of foreground galaxies to below the expected reionization signal level.
2.1.2 Low Resolution Spectrometer
The LRS is an spectrometer designed to measure the near IR EBL at m. The LRS comprises an optical coupler with a slit mask at its focus coupled to an imaging camera with a HgCdTe detector array. Spectral dispersion is achieved using a prism located between the output of the coupler and the camera. The incident light is focused on the five slits in the slit mask, recollimated by the coupler, dispersed by the prism, and imaged onto the detector array. The images of the slits yield cuts of the sky along one detector array axis, and spectral dispersion along the other. The resulting dispersed images are cuts along the sky and, after stars are masked, can be summed along the imaging direction and over the five slits to produce an extremely accurate measurement of the ZL and EBL spectra.
2.1.3 Narrow Band Spectrometer
The final instrument in the CIBER payload is the NBS which is a fast refractive camera with an filter at its aperture. The geometry of the instrument and filter causes the effective wavelength imaged at the focal plane to change with position on the detector array Eather & Reasoner (1969). By tuning the filter’s bandpass to a solar line which would be seen in reflection off the Zodiacal dust, the absolute brightness of the ZL can be measured. In the case of the first and second CIBER flights the Ca II at 8542Å line is chosen, though others are available. A direct measurement of the ZL in each CIBER field is important to the spectral measurement as it removes the need to model the Zodiacal dust, which is a difficult problem. Furthermore, as the ZL is not expected to have much structure over the NBS’s field of view, large pixels are sufficient to achieve the ZL measurement.
2.2. Liquid Nitrogen Design
The fundamental cryogenic element of CIBER is the liter LN2 tank, which provides cooling for the entire cryogenic insert section. LN2 is selected as the cryogen for CIBER since the thermal noise floor of HgCdTe detectors occurs near or above K and LN2 is readily available and easily handled. The calculated thermal loading on the cryogenic insert is listed in Table 2; the interior of the cryogenic insert must be shielded against this power to keep the components near K. Failure to do so would change the detector array properties and optical focus of the instruments. For this reason we employ radiation shields when testing and in flight. The main radiation shields cover the section of the experiment from the cryostat, to which they are thermally connected, to the top plate, from which they are thermally isolated. The shields are separated from the optical bench and spines by Vespel SP-1 standoffs at the front plate and along the optical bench spines; this arrangement ensures that the radiative load which falls on the shields flows directly to the cryostat. The shields are fabricated from the high thermal conductance alloy Al-1100 to facilitate heat flow through the material. These shields are wrapped in a 10 layer plastic backed aluminized mylar blanket222NRC-2 Cryolam-C manufactured by MPI Technologies. to further reduce the radiative load. When this blanket is installed, under typical operating conditions the inner surface of the radiation shield operates at K at the front of the experiment with a smooth gradient to K at the cryostat. The flight radiation shield is reinforced with three cylindrical Al-6061 ribs to damp excitational modes during vibration testing and launch, and hard black anodized on the interior surface to act as a near-IR absorber.
| Component | Optical Testing Configuration | Flight Configuration | ||
|---|---|---|---|---|
| Emissivity | Power (W) | Emissivity | Power (W) | |
| Radiative Loads | ||||
| Top of radiation shield | 0.04 | 2.6 | 0.9 | 0.5 |
| Rear bulkhead | 0.04 | 1.6 | 0.04 | 1.6 |
| Radiation shields (MLI) | 0.015 | 10.5 | 0.015 | 10.5 |
| Warm optical windowsa | 1.0 | 21.5 | - | - |
| Cold optical windows | 1.0 | 5.6 | - | - |
| Shutter door | - | - | 0.9 | 3.0 |
| Conducted Loads | ||||
| Upper GFRP suspension | 1.14 | 1.14 | ||
| Lower Ti suspension | 0.03 | 0.03 | ||
| Cryogenic service | 0.18 | 0.18 | ||
| Wiring harness | 0.16 | 0.16 | ||
| Total Power | 22.2 W | 17.1 W | ||
| Cryostat hold time | 11.9 h | 15.4 h | ||
| a Do not contribute to power incident on telescope apertures. | ||||
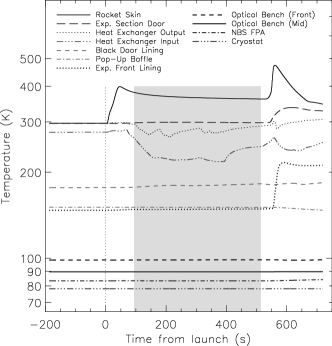
As shown in Figure 3, since the main radiation shields end at the top plate the thermal power falling on the front of the instrument assembly causes the temperature of the optical bench to range from K at the cryostat to K at the front plate. If the quiescent optical load from the skin and door sections of W were allowed to fall on the instruments and optical bench the detectors would warm up and have variable temperature which would lead to different characteristics in testing and flight configurations. For this reason, the thermal shunting system described in Section 5.1 is used when testing the optical properties of the instruments.
The cryostat itself must retain LN2 under five conditions: 1) while the experiment is horizontal during laboratory test under large thermal loads; 2) while vertical during laboratory tests and before launch; 3) when under positive acceleration during the initial and booster rocket firings; 4) while under negative gravity due to aerodynamic drag between stage firings; and finally 5) during ten minutes of while observing in space. Operation during the first three of these acceleration phases is made possible by placing the fill and vent lines at the upper outside corner of the cryostat. The negative gravity period lasts s. Though a small amount of liquid is lost during this period, it is evaporated in the heat exchanger and vents from the system as a gas. Operation in zero gravity is ensured by filling the cryostat with a coarse aluminum foam to which the LN2 adheres via surface tension.
The cryogenic vent system is designed to maintain a constant cryogen temperature both during laboratory testing operations when the external pressure is one atmosphere and in flight when the external pressure decreases to vacuum. This requirement is driven both by the need for small thermal drifts at the focal plane and to prevent air from freezing in the vent system after re-entry. The CIBER vent system achieves this and is shown schematically in Figure 4. Evaporated nitrogen from the cryostat is vented through a hermetic connection, then through a custom heat exchanger sunk to a rocket bulkhead to warm the vent gas to K, and then through a commercial absolute pressure valve333Tavco Inc. part number 2391243-2-9. which maintains a pressure of psia, i.e. just above one atmosphere. The output of the constant pressure valve is then vented through a balanced low-thrust vent situated at the center of mass of the rocket so that the vent gas does not disturb the attitude control system of the rocket while in flight.
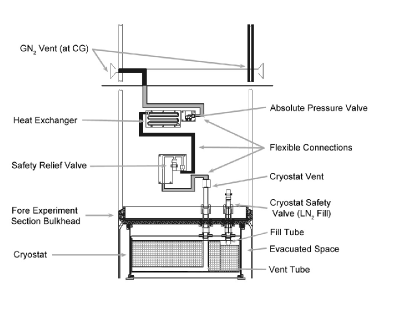
The lifetime of LN2 in the tank while ground testing is h. In practice, the cryogen tank is topped off about h before launch so there are liters of LN2 during flight. The temperature of various components in the experiment section immediately before launch and during the flight cycle is shown in Figure 3. There is no evidence of temperature change at the cryostat, so we infer that the foam retention and venting schemes work well.
2.3. Optical Baffling
The data acquired during CIBER’s first flight indicated that there was significant thermal radiation from the hot rocket skin scattering into the optics during astronomical observations. This increased the photo-current in the instruments, most prominently at the long wavelengths of the LRS, in the m Imager, and the NBS. During ascent, the rocket skin is frictionally heated by atmospheric drag to temperatures above K (see Figure 3), pushing the thermal emission peak to shorter wavelengths and leading to a large scattered signal at the detectors. The effects of this scattered radiation on, and the mitigation strategies for, the individual instruments are presented in the CIBER Instrument Companion papers; since it is common to all four instruments, the optical baffling employed in CIBER’s second flight is discussed here.
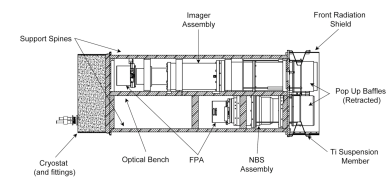
Post-flight investigation showed that light originating at the upper part of the skin and door can either directly, or via a single scatter off the static baffling, illuminate the first optic of the instrument, and from there scatter to the detector. The simplest way to combat this problem is to increase the height of the optical baffling and block all light paths from the inner surface of the baffles to the skin and door. For CIBER’s second flight, ‘pop-up’ baffles were installed on each of the four instruments (these are shown in detail in Figure 5). These baffles have a slightly larger diameter than their static counterparts and extend when the experiment door is open so that their top edge is beyond the lip of the rocket skin. The baffles themselves are constructed from Al 6061 and coated with Epner laser black444See http://www.epner.com/laser_black.ssi. on their interior surface and gold plated on their outer surface. These baffles ride on steel rods run through brass bushings and are either spring loaded or tied to the door with steel wire so they extend when the door is opened. Based on measurements of the specular and spectral reflectivity of optically black surface coatings the Epner laser black is % reflective. Measurements of the instruments’ sensitivity to light incident from angles have shown that the pop up baffles reduce the expected thermal pickup by at least a factor of (Tsumura et al., 2011).
The functionality of the pop-up baffles was tested with the experiment section in flight configuration using the vacuum box discussed in Section 5.4. In addition, the pop-up baffle assemblies underwent the same vibration qualification tests as the cold shutters as described in Section 3.1 at both the component and full assembly levels. These tests indicate that the baffles work well under conditions similar to the launch and flight environments.
In addition to the pop-up baffles, for CIBER’s second flight additional radiation shields were added to the front section of the payload extending beyond the front plate to within cm of the surface of the door. These shields block % of the solid angle to the skin as viewed by the instrument static baffles and are heat sunk to the cryostat via the optical bench, cooling to K. In addition, black caps utilized to cover the apertures of the baffles in the door closed configuration during the first flight were augmented to cover the entire K surface of the door in the second flight assembly. These covers are stood off from the door surface by Vespel posts and radiatively cool to K, at which point their thermal emission is undetectable. Similarly, the pop-up baffles are thermally separated from the front plate by the steel rods but radiatively cool to K due to their close proximity to the K static baffles.
3. Focal Plane Assembly
The CIBER detector arrays are common to all four instrument assemblies and require electrical readout, mechanical support at the focus of each instrument, and thermal control to ensure the dark current remains stable during testing and in flight. This section details the mechanical, electrical and thermal design and implementation of the focal plane assembly.
3.1. Focal Plane Mechanical Design
All four instruments employ a focal plane assembly (FPA), a model of which is shown in Figure 6. Beginning at the center of the FPA, each detector array is held in commercially available chip carrier555Part numbers AMP 641749-2 for the PICNIC arrays and AMP 643066-2 for the HAWAII-1 arrays.. This carrier is soldered into a focal plane board (FPB; see Section 3.2) which electrically interfaces and mechanically supports the detector assembly. The FPB itself is mounted into an inner light tight box which has a surface against which the frame of the detector chip is pressed by a spring loaded plunger assembly. This arrangement ensures the chip is precisely positioned against the metal reference surface with a calibrated force. The spring force is selected to produce firm pressure while also preventing mechanical stress on the detector chips, and is set to N through a displacement of mm.
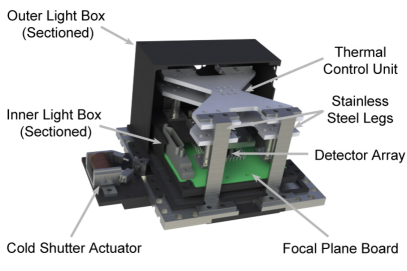
The inner light box is mounted to the instrument interface plate via an assembly which provides active thermal control of the entire inner light box. Active thermal control is required because the on-board detector amplifiers have a temperature dependent voltage of e-/K referred to the input (R. Smith, personal communication). The CIBER requirement is to stabilize detector current drifts at the level of es which leads to the specification on thermal fluctuation control of K/s, depending on the instrument. The inner light box is mounted on an Al-1100 structure which contains a thermal choke point (see Figure 6). A thermal control unit comprising an Al-1100 block with a heater element and platinum-thermometer bridge circuit are placed at this thermal choke and provide active control of the temperature of the inner light box (see Section 3.3 for a detailed presentation of this unit).
The thermal control unit is connected to the instrument interface plate via another Al-1100 plate and four stainless steel legs which serve to thermally isolate the inner light box assembly from the ambient thermal environment. An outer light box surrounds the entire assembly, ensuring that stray IR photons cannot directly couple to the detector array. This assembly is mechanically mounted to the instrument by mm long Vespel SP-1 posts and stainless steel screws, and strapped directly to the LN2 tank with custom built Cu-10100 copper straps. The straps comprise flexible braided wire which is electron beam welded into copper blocks at either end. The blocks are clamped to the FPA and cryostat to thermally connect them. The straps have sufficient slack to mechanically decouple the FPA from the experiment section, which is important during e.g. vibration testing or launch operations. This arrangement keeps the FPA at a constant temperature in testing configurations which cause the optical bench temperature to vary.
Each FPA also hosts a cold shutter assembly based on a flight-proven design (see e.g. Wildeman et al. 1993, Bock et al. 1998). The shutters are necessary because absolutely calibrated measurements require precise determination of the zero-point signal in the detector. Cold shutters situated just in front of the CIBER detector arrays will effectively block IR light incident on the active surface of the detector. The design of such a cold shutter is not trivial; it must be operable at cryogenic temperatures, fit in a highly constrained volume defined by the optics and detector arrays, operate under various loads and in vacuum, and survive the shock and vibration levels encountered in a sounding rocket flight.
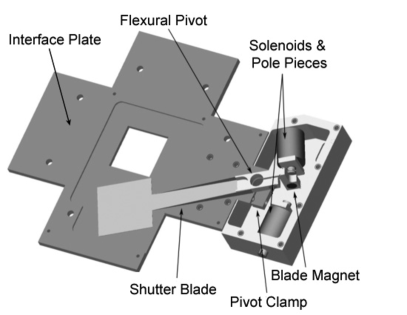
Figure 7 shows a model of the CIBER flight shutters. The CIBER shutters are composed of a thick hard black anodized Al-1145 blade mounted on a single ended flexural pivot and counter weighted with a small rare-earth magnet. The total weight of the blade assembly is g of which g is due to the fixed magnet and g to the blade. Flexural pivots666Flexural pivots are precision rotational spring bearings actuated by flexing blades held inside a rotating barrel; the parts used in CIBER are manufactured by Riverhawk Flexural Pivots Co. part number . are chosen as they are frictionless and so well-suited to cryogenic operation. The flexural pivot is mounted to a base plate which interfaces the shutter assembly to the focal plane assembly. The shutter is actuated using a permanent magnet attached to the rear of the shutter and an electromagnetic yoke mounted to the base plate. The yoke comprises two turn solenoids through which a high magnetic permeability mu-metal pole pieces are run, configured with one solenoid on either side of the shutter throw. When current passes through the solenoids, the pole pieces attract or repel the fixed magnet on the shutter in coordination, thereby actuating it. The magnets and yoke are configured to make the shutter bi-stable so that the blade remains either open or closed in the unpowered state.
To test the flight-worthiness of the assembly, the cold shutters flown on CIBER have undergone a rigorous component-level test regime including cryogenic life cycle testing and vibration qualification. The cryogenic lifetime test requires 5,000 open/close cycles on a test assembly held at K; no change in the performance of the shutter is observed. The vibration test sequence follows the standard NASA vehicle level 2 specification (see the NASA Sounding Rocket Handbook ) and involve random and sine vibration tests in the and axes. The tests have s duration with an amplitude of . During these tests the shutter is clamped in the open position by powering the electromagnet, which simulates launch conditions. These tests are important as the first CIBER cryogenic shutter design, which utilized a double-ended flexural pivot777Manufactured by Riverhawk Flexural Pivots Co. part number ., failed during vibration testing due to cracking of the vanes inside the pivot assembly. This cracking occurred during testing at modest vibration levels and was not anticipated based on engineering calculations, showing that the fatigue and maximum tolerable stress margins needed to be larger than a static stress calculation suggests. In the second (flight) design the shutter bearing mechanism was redesigned to use a single ended flexural pivot with a diameter as described above; this design was successfully qualified at component and payload level and have flown on both CIBER flights. Before and after each test the shutter assembly is actuated through an open/close cycle 5 times, and during each of the tests the test assembly is cooled to K and clamped in the open position by applying the appropriate current to the electromagnet. Finally, one of the second-generation shutter assemblies was tested to failure; this test showed that the flight shutters have a virtually indefinite life span in the acceleration environment encountered in flight and only failed at loads twice the launch vibration specification while unclamped and for a test duration times the requirement. Most importantly, the same four cold shutters have been flown twice in CIBER with no modification or repair required following flight, verifying that the design and implementation is sound.
3.2. Detectors and Cryogenic Electronic Systems
CIBER utilizes four Mercury-Cadmium-Telluride (HgCdTe) detector arrays in total; two engineering-grade HAWAII-1 detector arrays for the Imagers and two MBE-grown substrate removed PICNIC arrays for the Spectrometers (see Beletic et al. 2008 for details). The basic detector characteristics are given in Table 1. These detector types, fabricated by Teledyne Scientific & Imaging888See http://www.teledyne-si.com/., have a proven track record of low dark current, high quantum efficiency (QE), good uniformity across the array, and low noise. Both array types have similar intrinsic wavelength bandpasses with QE for m. CIBER’s HAWAII-1 and PICNIC arrays have m and m pixel pitches, respectively. The detector material is indium bump-bonded to the source-follower configured readout integrated circuit (multiplexer) which leads to typical full well depths of e- and readout noise e-. The CIBER Instrument Companion papers detail the design requirements leading to the choice of detector array type for each CIBER instrument.
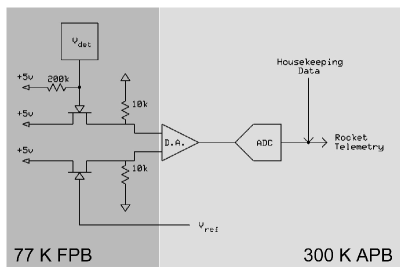
Figure 8 is a schematic representation of the CIBER detector readout chain, which is divided into cryogenic and ambient temperature sections. In order to reduce electroluminescence from the output amplifiers on the multiplexer, the output bus of the detector array is connected directly to an external preamplifier stage following the scheme of Hodapp et al. (1996); this replaces three MOSFET devices in the multiplexer with a single external JFET, which reduces the self-emission from the multiplexer. The CIBER readout scheme also employs a differential amplification step; a reference signal is generated in the warm electronics (see Section 4.1) and sent to the FPB, where it is connected to one of the inputs of a dual input JFET999CIBER uses a Vishay SST406-E3 dual N-channel JFET switch.; the output bus from the array is connected to the other. This scheme provides common-mode rejection to noise and pickup on the wiring between the FPA and warm electronics, and reduces any thermal dependence on the JFET.
Both the HAWAII-1 and PICNIC detectors have four quadrants and four independent output buses, so a FPB contains four of the unit cell preamplification circuits shown in Figure 8 to service each detector. In addition, the FPB provides the electrical interface to the various clock signals required by the multiplexer for the warm electronics where the clock signals are generated. Each quadrant in the HAWAII-1 arrays acts as an independent unit, meaning that the clock signals must be generated for each quadrant, while in the PICNIC arrays the clocking is common to all four quadrants. A second, and more important, difference between the HAWAII-1 and PICNIC FPBs is the detector substrate in a PICNIC array is not held to ground so its voltage must be optimized to minimize the dark current. Lee et al. (2010) give a detailed account of the bias settings of CIBER’s PICNIC arrays.
3.3. FPA Thermal Control
As discussed in Section 3.1, the temperature of the focal plane assembly and detector is actively controlled using a two-stage thermal guard design. The NBS has the most stringent dark current stability requirement of es, which leads to a temperature fluctuation stability requirement of K/s. To meet this requirement, the CIBER thermal control unit consisting of a cryogenic thermometer/heater pair connected to a room temperature readout and proportional-integral-derivative (PID) controller is used. The cryogenic thermometer/heater pair is contained on a unit mounted to an mm3 Al-1100 block. We use a Platinum resistive thermometer101010Manufactured by Sensor Scientific part number P200BMD is used. with resistance at C coupled to a preamplifier111111Analog devices part number AD8630. with nV/ input noise on minute time scales to measure the temperature of the block. The thermometer is read in a Wheatstone bridge designed to balance at K; the bridge is biased by a V low noise reference, which leads to a thermal sensitivity at balance of mV/K. The heater is a standard thin film resistor with a value of .
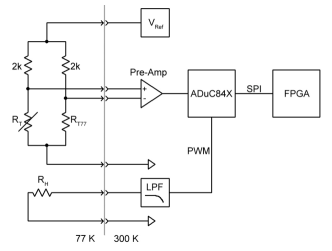
The bridge readout and PID control are handled by a single device 121212Analog Devices ADuC84X series controllers are used. chosen for its 24-bit ADC and 16-bit DAC resolution, chop-stabilized gain stage, and compact, integrated functionality. The micro controller is programmed to implement the Takahashi-type PID; the parameter settings are optimized using the Zeigler-Nichols criteria by determining the critical gain and oscillation frequency of the proportional control loop. Each CIBER FPA uses two such temperature control units, one which monitors the focal plane temperature and one which regulates the temperature control point (TCP; see Section 3.1). As running both units in control mode could induce feedback effects in the temperature of the FPA unit, only the TCP unit is run in PID-mode; the focal plane unit is programmed to pre-heat the light box to within K of the set point and simply monitor its temperature stability following that. Since the temperature set point must be larger than the highest normal bath temperature, the set point of each FPA is optimized independently; all lie between and K. The PID loop parameter tuning and pre-heating cycle were optimized and tested in the lab prior to instrument deployment.
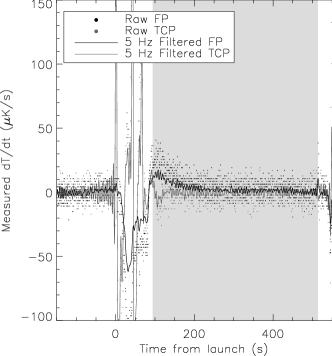
On flight day, the focal plane temperature control system is powered on several hours before flight to ensure that each focal plane is controlling at its set point at launch. Due to its mass, the heating time of the FPA is quite long; typically h are required for the heaters to raise the temperature of the focal plane by the required K. Figure 10 shows the derivative of both focal plane thermometers for the NBS instrument just prior to launch and during flight. These data show that, though large thermal impulses are visible, the thermal drift during flight is K/s, corresponding to a dark current drift of es, which meets our requirements.
3.4. Calibration Lamp Assembly
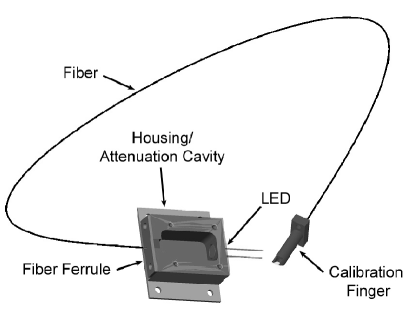
Calibration lamp assemblies are used to monitor the response of the detectors to a known light input before and during flight. Each of the four assemblies, an example of which is shown schematically in Figure 11, consists of an LED coupled to an optical fiber which routes the light to an instrument. The LEDs are selected to have operating temperature-adjusted wavelength outputs which peak close to the operating wavelengths of the instruments, namely m for the short wavelength Imager and NBS and m for the long wavelength Imager and LRS131313These lamps are part numbers L7866 and L8245 from Hamamatsu Photonics, respectively; our testing verifies that the light output of these devices is stable over hundreds of cryogenic cycles.. For normal lamp power outputs of mW the lamps are as much as a factor of too bright to be directly coupled to the instruments at the goal photo-current of es per detector pixel, which would provide a signal to noise ratio of 100 in s of integration. Geometric attenuation is established at the lamp housing and is tuned for each instrument using the distance between the LED and the fiber ferrule. The housing itself is attached to the optical bench spine, while the output side of the fiber is coupled to the instrument’s optics by means of a small finger with a mirror mounted at its exit aperture. Light emitted by the LED is fed through the fiber and finger and illuminates the detector array in a non-uniform, but repeatable, way.
4. Warm Electronics
CIBER’s electronic system is responsible for three main functions: 1) it biases and reads out the detector arrays; 2) it digitizes the analog detector outputs, incorporates the housekeeping data, and passes the resulting data stream to the rocket telemetry system; and 3) it receives the telemetered data and stores it to disk. Additionally, the electronics drive functionality for thermal control, cold shutters and calibration lamps and incorporate the status of payload systems into the housekeeping data.
4.1. Warm Payload Electronics
CIBER’s warm electronic system has several functions which can be broken down into three main categories: 1) clocking and reading out the detector array; 2) actuating systems inside the experiment section, and 3) monitoring and reporting the status of the payload. These are accomplished using a combination of two types of boards, array processor boards (APB) and housekeeping boards (HKB). Each instrument requires two APBs and one HKB to operate, so that the payload requires four HKBs and eight APBs in total. These boards are all housed in a single electronics box which is attached to the non-evacuated side of the forward vacuum bulkhead. When the payload is fully assembled, this means that the electronics box protrudes into the star tracker section (see Section 6 for details), which imposes stringent constraints on the size of the electronics box. The overall dimensions of the electronics box are cm; the electronics boards are restricted to a footprint of cm with a maximum height of cm as a result.
Instrument power from the rocket batteries is supplied at a nominal rating of V. Since a variety of voltages are required by various subsystems in the CIBER electronics, the input power must be regulated on both the APBs and HKBS. An additional complication is that the battery power varies from V when the payload switches to internal power at T minutes to V at the T minutes experiment power off command. We have verified that the CIBER electronics system operates normally for V.
The CIBER boards are interfaced to the cryogenic electronics by customized cabling. The warm cabling141414Manufactured by Stonewall Cables. comprises shielded copper wire connecting standard D-subminiature connectors on the board side and 66-way circular connectors on the hermetic side. The cryogenic cabling151515Manufactured by Tekdata Interconnect Systems. comprises twisted pair maganin wire woven into a Nomex braid connecting a 66 way circular hermetic connector and D-microminiature connectors at the FPA and housekeeping service connections. The cables harnesses are m long measured from the electronics box to FPB.
4.1.1 Array Processor Boards
The APBs have three functions: 1) generation of detector clocking signals synchronized with the serial clocks sent from the rocket telemetry (TM) system; 2) generation of detector bias voltages; and 3) amplification and digital conversion of the signals from the detector array. The first function is handled by a complex programmable logic device161616Lattice part number M4A5-192/96 is used. (CPLD) which clocks the detector array based on synchronization clock pulses from the rocket TM. For the Imagers, the two APBs which service the detector create clocks independently from the same synchronization pulses, while for the Spectrometers only a single board handles the array clocking.
The generation of the array bias signals is handled by voltage followers171717AD8629 operational amplifiers coupled to the V power supply are used in CIBER.; these have variable levels which are set to values which minimize the amplification noise while maximizing the dynamic range by setting the value of fixed resistors. The specific choices of these bias signal voltages can be found in Lee et al. (2010) and the CIBER Companion Instrument papers.
The detector array output conditioning is shown schematically in Figure 8. The amplification is handled by a instrumentation amplifier circuit with a gain of 10.5, a bandwidth of MHz and a settling time of ns. Both the array output and voltage reference are amplified in the same way with equivalent circuits. These signals are input to a 16-bit, sample-per-second differential analog to digital (A/D) converter181818Analog Devices part number AD7688 is used. which converts the difference of the array signal and reference voltages to digital levels. The digitized signals are then formatted into the output data stream by the APB CPLD and passed on to the rocket TM system for transmission.
The data transmission rate, and thus the clock rate of the detector, is set by the rocket TM system’s 10 Mbps serial data transfer rate. This maximum data transmission rate leads to a single clock cycle period of ns; each pixel is 16 bits so the pixel visit time is s. The main synchronization pulses occur at kHz for the Imagers and kHz for the Spectrometers. In each interval, either sixteen pixels for each of the four quadrants from a single instrument (for the Imagers) or eight pixels from each of the four quadrants from both instruments (for the Spectrometers) are addressed. Table 3 accounts for the various readout clock cycles to lead to a master read rate of s/frame for the Imagers and s/frame for the Spectrometers.
| Imagers | Spectrometers | |||
| Data Size | Read Time | Data Size | Read Time | |
| 1 Pixel | 16 Bits | s | 16 Bits | s |
| 1 Packet | Pixels | s | Pixels | s |
| 1 Line | 32 Packets | s | 16 Packets | s |
| 1 Frame | Lines | s | Lines | s |
| aNumbers appearing in brackets denote equivalent data breadths for | ||||
| rocket and experiment housekeeping data; these are interleaved | ||||
| into the transmitted time streams. | ||||
4.1.2 Housekeeping Boards
In addition to a master/slave APB pair, each instrument is serviced by a Housekeeping board (HKB). Again, the hardware design of these boards is common to all the instruments, though the firmware programming is different for the Imagers and Spectrometers. The CIBER HKB has five functions: 1) detector array reset signal and housekeeping data generation; 2) cold shutter control; 3) calibration lamp control; 4) temperature monitoring of components in the experiment section; and 5) temperature monitoring and control for the FPAs. The last of these is discussed in Section 3.3; we present the other four functions below.
The heart of the CIBER HKB is a mid-capacity field programmable gate array191919Lattice part number LCMXO2280. (FPGA). This device receives the synchronization pulses from the rocket TM and is programmed to respond to asynchronous external events by driving hardware and sending asynchronous reset pulses to the APBs. Array reset commands are asserted to the APBs on open or close shutter commands, calibration lamp enable or disable commands, or in response to the attitude control system (ACS) computer inputs. The ACS system (discussed in detail in Section 6) has two lines to communicate with the CIBER HKBs corresponding to ‘close to target’ and ‘on target’. The ‘close to target’ status is triggered when the ACS computer determines that the errors are less than 100 arcsec in , for 1 second. The ‘on target’ status is triggered 3 seconds after ‘close to target’ is asserted; this is the typical time required for the ACS to settle to within 1 arcsec of the target position. The arrays are not reset while ‘on target’ is asserted (except in response to hardware interrupts like a shutter close command; see Section 6).
In addition, the experiment section door status is sent to the HKBs; the FPGA logic is programmed to respond to this signal in the following way. On the ground (in the laboratory, pre-launch, or on ascent), resetting based on the ACS ‘close to target’ and ‘on target’ signals is disabled. The experiment ‘door open’ signal is received roughly s into the flight when the payload has separated from the motor stages and is ready for observation. Upon receiving the ‘door open’ status, the HKBs enter a state where the detector arrays are reset every other frame unless the ‘on target’ status is asserted. This scheme ensures that during slews the array is reset frequently to erase bright star trails falling across the image. During integration no resets are asserted. As a fail safe, the APBs are hard coded to reset every s if a reset command has not been asserted more recently, which provides useful data acquisition in the situation that communication with the HKB is broken.
Additionally, the CIBER HKBs generate housekeeping status data which is inserted in the 513th (Imagers) or 129th (Spectrometers) data line as shown in Table 3. These data include the status of the cold shutters, experiment door, ACS signals, rocket event timer, reset status, thermometry and time information. The housekeeping data are parsed out of the data stream on the ground and provide checks of the status of the experiment for each frame.
The shutter and calibration lamp drivers are controlled by external events via the FPGA, providing asynchronous control of the state of the cold shutters and on-board calibration lamps (see Section 2.1). The calibration lamp driver is simply a constant current source, the value of which is mA but varies by a factor of two between instruments. This current source is designed to be stable and has peak to peak variation per hour. The shutter driver circuit provides active differential V to the shutter electromagnet such that in quiescent operation these cancel at the solenoid. When the ‘shutter open’ or ‘shutter close’ command is received, the corresponding voltage is dropped to zero and the shutter actuates. The calibration lamp power and shutter commands are monitored and transmitted in the housekeeping data for each frame.
The CIBER HKBs provide six channels of thermometry each, for a total of 24 diode devices on board. The most important of these are plotted in Figure 3 for CIBER’s second flight. The diodes are biased at a constant A with a constant current source and the voltage drop over them is measured to determine the temperature. The A/D conversion is performed by a controller which can handle all six devices simultaneously202020Analog Devices ADuC84X series.. This chip also handles the asynchronous communication with the HKB FPGA, which then inserts the thermometry data into the housekeeping data stream.
4.2. Telemetry & Ground Station Electronics
The telemetry (TM) system used on CIBER is custom-built from components designed and fabricated in-house at NSROC. The TM system takes the data generated by the CIBER warm electronics as input, populates the extra 4 (Imagers) or 16 (Spectrometers) words identified in the second row of Table 3 with rocket payload status data, and transmits it to the ground station. The CIBER payload’s TM section utilizes three Mbps down links, one for each Imager and one for the combination of both Spectrometers. The encoded data streams are transmitted over wrap-around antennas fitted in recesses on the rocket skin. The NASA ground station decodes the data stream and stores it to tape; the experiment data can additionally be passed to the experimenter real time.
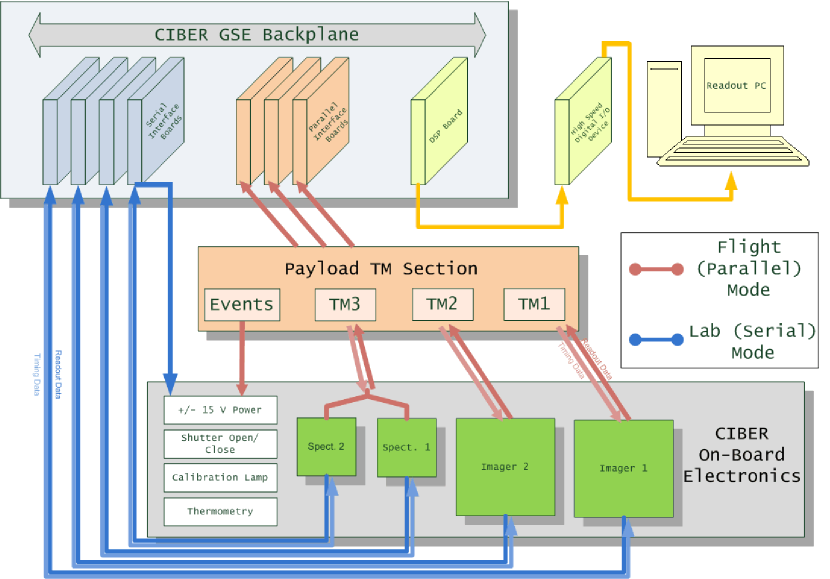
CIBER requires its own ground station electronics (GSE) system to parse, display and store the data. Importantly, this system does double-duty as a data acquisition system for ground testing when the experiment is not connected to the rocket TM. The GSE system is graphically summarized in Figure 12. It comprises customized data acquisition (DAQ) cards featuring mid-capacity FPGAs which parse the incoming data; these communicate to digital signal processing (DSP) board over a VMEbus back plane. The front bus of the DSP board is in turn connected to a commercial high speed digital I/O PCI card212121National Instruments part number PCI-6534. installed in a readout PC. The PC runs customized software to store the data stream to files and display it in a graphical interface in real time.
In order to facilitate both of its roles, the GSE operates in two modes called ‘Parallel Mode’ and ‘Serial Mode’ which are shown schematically in Figure 12. These correspond to a passive mode where the data stream input from the NASA ground station is both displayed real time and stored to disk, and an active mode which simulates the functionality of the payload TM section in addition to its normal display and data storage functionality. In serial mode it is necessary for the GSE DAQ cards to simulate the rocket serial interfaces for the three TM channels, including power interface and command of the various event and status input channels, for laboratory testing without the TM.
5. Laboratory Characterization & Equipment
The CIBER instrumentation is fully characterized in the lab before flight using equipment described in this section. Tests unique to individual instruments are described in the CIBER Instrument Companion papers.
5.1. CIBER Optical Testing Configuration
In flight the payload door opens directly to space and so does not use a window; however, in the lab some means of introducing light into the telescopes is necessary. We use a customized window bulkhead for optical testing in the lab with openings on which circular glass windows are installed on o-ring seals, one for each instrument. The BK7 glass windows are measured to have transmittance over the range nm.
Calculations show that, due to the temperature difference between the cryogenic insert and the outer envelope of the experiment section, the radiative loading on the telescope apertures and front plate in lab testing configuration is W. Due to the finite thermal conduction of the telescope lenses, under thermal loading the center of a lens is significantly warmer than its edge so that the focus of the instrument changes as a function of the loading. Because in flight configuration the loading on the first optic is W, if left uncorrected the best focus position measured in the laboratory would be significantly different than the best focus position in flight. To mitigate this, during optical tests an aluminum cold window plate holding BK7 glass, thick windows for each instrument is installed. If the cold window plate were to be thermally sunk through the front plate and optical bench it would cause the front of the optical bench to run at a higher temperature. The cold window plate is therefore mechanically attached to the front plate and thermally strapped to the radiation shield. This configuration allows the power from the warm skin to illuminate the window plate and be sunk directly to the cryostat via the thermally conductive radiation shields rather than through the instrument apertures and optical bench. In this testing configuration W of power falls on the telescope optics, which is close enough to flight levels to allow good focus determination. The cold window design is successful as all four instruments were in good focus during both of CIBER’s flights.
5.2. Collimators
The optical focus of the instruments is characterized using a collimating telescope to mimic an astronomical point source. Light from a either a quartz-halogen lamp or monochromator (the latter is discussed in Section 5.3) shines through a pinhole placed at the collimating telescope’s focus, resulting in a collimated beam. Due to the different optical properties of the instruments, we use two different collimating telescope systems. For the Spectrometers, the collimating telescope is a Parks (91 cm focal length) Newtonian telescope222222Manufactured by Parks Optical., while for the Imagers we use an (172 cm focal length) off-axis Newtonian telescope232323Fabricated in house using a primary mirror ground by DGM Optics.. An auto-collimating microscope is used to set the focus of the collimators. The best focus position of the CIBER instruments is determined by moving the collimating telescope’s pinhole through its best focus position. Using the thin lens approximation and given the focal lengths of the instrument and collimating telescope , the relation between shifts along the optical axis at the position of the pinhole and the equivalent shift at the detector can be calculated by:
| (1) |
where the smallest CIBER PSF is measured at .
Because each of the CIBER FPAs are mechanically fixed to their respective instruments and it is not possible to determine the best focus position of the focal planes a priori, the flight position of the focal planes must be set experimentally. This is done iteratively by measuring the focus performance of the instrument thereby determining the offset from best focus, warming the experiment, shimming the focal plane in question to the revised focus position, cooling back to LN2 temperature, and remeasuring the focus performance. After several such cycles the design focus performance of the instruments is achieved.
5.3. Monochromator
The spectral performance of each of the instruments must be characterized in the lab prior to launch. A commercial monochromator system242424Newport Corporation Oriel Monochromator and Spectrograph model number MS257 coupled to a Newport Corporation Apex 50 W quartz-tungsten-halogen lamp light source. is used to measure the spectral properties of the instruments. The monochromator utilizes two prisms with blaze wavelengths of and nm and rulings of lines/mm and 400 lines/mm, respectively. Together these gratings allow spectral coverage from nm to nm. For a particular test the spectral band is defined by selecting a fixed slit from a set of varying widths, and the wavelength is selected by tuning the angle of incidence of the light source on the grating. The monochromator is calibrated at the factory, and control software is provided by the manufacturer with the calibration pre-loaded. The calibration is checked periodically, usually after shipping to or from the field, using a Ne lamp to confirm the position of Ne emission lines matched with known spectra. Absolute wavelength accuracies nm and repeatabilities nm are readily achieved with this system. The output port of the monochromator can be coupled to the pinhole of a collimating telescope if a monochromatic, quasi-point point source is desired, or coupled to the optical fiber input of an integrating sphere if a monochromatic field-filling source is necessary: both configurations are used for CIBER testing. The brightness of the monochromator output can be attenuated using any combination of filters and geometric techniques as required.
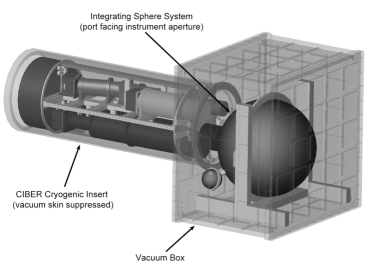
5.4. Integrating Sphere & Vacuum Box
An integrating sphere is used to measure the CIBER instrument response to diffuse sources which illuminate the entire of the telescopes such as the CIRB or Zodiacal light. We employ a commercial integrating sphere system252525Manufactured by Labsphere, Inc. with a diameter and an exit port which can be stopped down with port reducers if desired. The interior of the sphere is coated with a barium sulfate paint and the sphere assembly is attached to a frame mount for ease of positioning. The light source for the sphere is a quartz tungsten halogen lamp262626Manufactured by Schott North America, Inc. in a housing with a customized filter designed to produce an approximately solar spectrum at the sphere’s output. Figure 13 shows the measured spectrum of the integrating sphere system compared to a solar spectral shape.

The output of the light source is coupled to the sphere using a 6’ long optical fiber bundle. By adjusting the diameter of a pinhole at the light source, the absolute radiance presented by the large sphere can be modified without changing the output spectrum. In addition, a smaller diameter injection integrating sphere is coupled to the larger sphere and illuminates the pinhole with its output port, attenuating the input radiance and improving the larger sphere’s output uniformity. A monitor detector272727This detector is either an Si or InGaAs photodiode, depending on the instrument under test. is attached to the injection sphere and is readout using a commercial pre-amplifier and display system282828Manufactured by Labsphere Inc.. The integrating sphere system is measured to have output radiance uniform to % at angles up to from the center line of the output port and its spectral radiance can be adjusted continuously from to W/m2/sr/m using the injection sphere and a selection of pinhole attenuators.
Laboratory measurements of the instruments’ flat field responsivity are complicated both by the presence of the warm vacuum windows and by absorption by water in the atmosphere. The former is a potentially complex spatial and spectral correction while the latter can attenuate the near-IR spectrum in broad regions around and m. To remove these effects it is necessary to perform the flat field measurements in vacuum. To this end, a cubic inch vacuum sphere was made. It is constructed of thick Al-2024 plates292929The box was fabricated at the Korea Basic Science Institute in Daejeon, Korea. and is shown schematically in Figure 14. The interior of the vacuum box is painted with Aeroglaze Z306303030Manufactured by the Lord Corporation. to absorb scattered light. The box can be pumped out independently of the experiment section if required, and a hermetic electrical interface allows electrical signals to be passed to the interior of the box. In addition, a separate hermetic optical fiber bundle is used to couple an external light source into the integrating sphere. This allows real time control of the input light entering the sphere from outside of the vacuum box.
5.5. Calibration
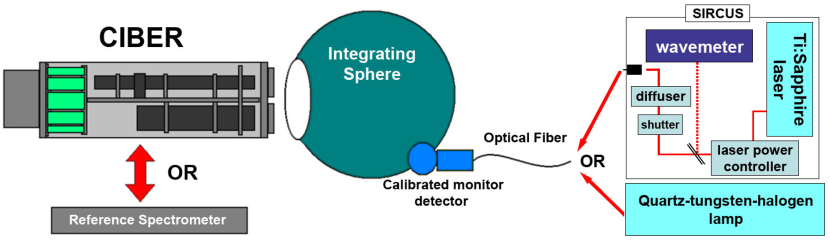
Both Spectrometers require a calibration of their absolute responsivity to extended emission. We opt to measure a calibrated extended source in the laboratory to calibrate the CIBER instruments using instruments developed at the National Institute of Standards and Technology.
A schematic diagram of the CIBER calibration apparatus is shown in Figure 15. Depending on the desired calibration product, two measurements using different light sources are available: the first uses the Spectral Irradiance and Radiance Calibrations using Uniform Sources (SIRCUS) facility (Brown et al., 2006) while the second a standard quartz-tungsten-halogen lamp. The SIRCUS facility utilizes a Nd:Vanadate-pumped Ti:sapphire tunable laser for monochromatic measurements. In both cases, the light source is coupled to a diameter integrating sphere whose port is viewed by CIBER through the vacuum window bulkhead. The transfer standard detectors are different for the two sets of measurements: a NIST-calibrated Si radiance meter is used for the laser measurements, and the NIST Remote Sensing Laboratory’s Analytical Spectral Devices (ASD) FieldSpec3 spectroradiometer is used for the white light measurements. These measurements are used to accurately calibrate both the absolute and relative (i.e. pixel-to-pixel) responsivity; specific details can be found in the CIBER Instrument Companion papers.
6. CIBER in Flight
The CIBER experiment section is designed to launch on the Black Brant IX vehicle (NASA Sounding Rockets Program Office 2005, Krause 2005). From aft to forward, the CIBER payload stack consists of the Terrier booster, the Black Brant sustainer, the ignitor for the motors, a spring loaded separation section, the experiment section as described in this paper, the star tracker housing, the telemetry section, the active guidance section, the celestial attitude control system, and finally the recovery system in the nose cone. Each section is housed in its own modular section, and the payload is a uniform inch diameter along its length. Together, these systems provide launch and separation capability, active pointing while in flight, real time telemetry, and parachute recovery. Except for the telemetry (discussed in Section 4.2) and star tracker sections, which are customized for the experiment, the sections are all standardized and can be swapped with spares as required. At launch, the fully integrated CIBER payload is m long and weighs kg313131The weight of the payload may vary by kg depending on the balancing weights required in a given flight..
The star tracker section uses a University of Wisconsin developed model ST-5000 side-looking star tracker (Percival et al., 2008). The CIBER payload is the first deployment of this system, whose advantage is that it need not be co-mounted at the instrument aperture (and thus take aperture space from the science instruments). The side-looking star tracker is aligned with the instruments using a secondary, temporarily installed ST-5000 system which is co-mounted to the aft bulkhead. This temporary tracker is optically aligned to the instruments using a collimator, and the resulting pointing solution is transferred to the side-looking tracker by measuring star positions in both trackers simultaneously. Stack-up tolerance, and heating and vibrational effects at launch can lead to error in the absolute pointing model of .
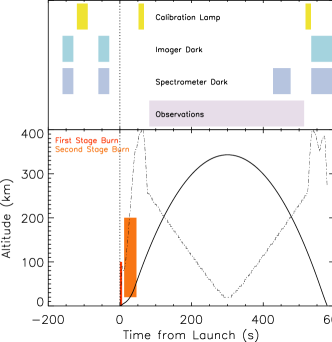
The CIBER flight profile is summarized in Figure 16. At launch, the rocket burns its Mark 70 Terrier first stage; the burn lasts for approximately s and then the motor is drag-separated from the second stage. Guide fins at the base of the Terrier motor are canted by a small angle to give the rocket an Hz roll rate, stabilizing the rocket along its long axis. The second stage sustainer, a Black Brant mod 2, burns for approximately s. Immediately following the second burn, most of the angular momentum acquired during the Terrier burn is shed by utilizing two cables with weights at their ends to de-spin the payload. These are released and, when the cables reach their full extent, are cut to cast off angular momentum, following which the payload is spinning at Hz. Next, the spent sustainer is pushed away from the payload by the high velocity spring section attached to the top of the motor housing. This ensures that the motor and payload are separated by a large distance when data acquisition commences, as previous experiments have become contaminated with residual motor exhaust at altitude (see Matsuura et al. 1994, Yost et al. 2000 for a discussion of this problem). The experiment is then fully despun to Hz by pressurized gas controlled by the ACS, the shutter door opens, and scientific observations begin. The payload pointing slews from field to field by the ACS-controlled pressurized gas jets, achieving a maximum slew rate of /s. Fine pointing is governed by gyroscopes. At the end of the flight prior to re-entry, the experiment door is closed and gas jets are used to spin the payload back up to Hz to reduce the frictional heating on any single area of the payload. The parachute deploys at an altitude of ft and the payload impacts the ground at about ft/s. The payload is tracked along its entire trajectory and a recovery team is deployed the following morning to retrieve the payload.
The choice of our science fields was the same in both of the first two flights (and is discussed in detail in Tsumura et al. 2010), but is in principle entirely flexible based on requirements of the science team’s choosing. Fields covered by large area optical and near IR surveys are chosen for the extragalactic fluctuation science while fields at a variety of ecliptic latitudes are chosen for the Zodiacal light characterization. This leads to a flight profile for which % of the observation time is spent on Zodiacal light science and the remainder on deep cosmological fields.
A set of four criteria define CIBER’s flight windows based on astronomical considerations. Firstly, every field must have ZA to reduce the possibility for Earth-shine contamination. Secondly, the zenith angle (ZA) of the Sun must be so that the Sun is below the depressed horizon. Thirdly, the ZA of the moon must be so that the moon is below the depressed horizon. Finally, to ensure that the CIBER data matches the conditions under which the DIRBE data was taken, the solar elongation (SE) to each of the fields must be in the range . Together, these conditions tend to restrict CIBER flight windows to a few day periods clustered in the middle of winter and early summer months from North American launch sites.
CIBER has undertaken two successful flights using a Terrier-Black Brant IX rocket launched from White Sands Missile Range, first on 25 February, 2009 and then on 10 July, 2010. In both cases the payload had a remarkably similar flight, achieving an apogee of km and providing s of astronomical data. In both flights the calibration lamps and cold shutters were successfully operated during the ascent and descent phase to monitor the performance of the detectors under flight conditions. The payload pointing stability was over s integrations in a given field. In both cases, the instrument was successfully recovered for future flights. Tsumura et al. (2010) presents initial results from the first flight; analysis of the second flight data is currently underway and scientific results are expected soon. As the data quality from the second flight appears excellent, no major hardware modifications are expected for future CIBER-1 flights. Beyond that, CIBER-2, a completely redesigned follow-on payload to CIBER-1 optimized for reionization fluctuation science, is in its design phase and is expected to fly in 2014.
Acknowledgments
This work was supported by NASA APRA research grants NNX07AI54G, NNG05WC18G, NNX07AG43G, NNX07AJ24G, and NNX10AE12G. Initial support was provided by an award to J.B. from the Jet Propulsion Laboratory’s Director’s Research and Development Fund. Japanese participation in CIBER was supported by KAKENHI (2034, 18204018, 19540250, 21340047 and 21111004) from Japan Society for the Promotion of Science (JSPS) and the Ministry of Education, Culture, Sports, Science and Technology (MEXT). Korean participation in CIBER was supported by the Pioneer Project from Korea Astronomy and Space science Institute (KASI).
We would like to acknowledge the dedicated efforts of the sounding rocket staff at the NASA Wallops Flight Facility and the White Sands Missile Range. We also acknowledge the work of the Genesia Corporation for technical support of the CIBER optics, and M.C. Runyan and an anonymous referee for helpful comments on this manuscript. M.Z. acknowledges support from a NASA Postdoctoral Fellowship, A.C. acknowledges support from an NSF CAREER award, B.K. acknowledges support from a UCSD Hellman Faculty Fellowship, and K.T. acknowledges support from the JSPS Research Fellowship for Young Scientists.
References
- Beletic et al. (2008) Beletic, J. W., et al. 2008, in Society of Photo-Optical Instrumentation Engineers (SPIE) Conference Series, Vol. 7021, Society of Photo-Optical Instrumentation Engineers (SPIE) Conference Series
- Bock et al. (2011) Bock, J., et al. 2011, In Prep.
- Bock et al. (2006) —. 2006, New Astronomy Review, 50, 215
- Bock et al. (1998) Bock, J. J., et al. 1998, in Society of Photo-Optical Instrumentation Engineers (SPIE) Conference Series, Vol. 3354, Society of Photo-Optical Instrumentation Engineers (SPIE) Conference Series, ed. A. M. Fowler, 1139–1149
- Brown et al. (2006) Brown, S. W., Eppeldauer, G. P., & Lykke, K. R. 2006, Appl. Opt., 45, 8218
- Cooray et al. (2004) Cooray, A., Bock, J. J., Keatin, B., Lange, A. E., & Matsumoto, T. 2004, ApJ, 606, 611
- Eather & Reasoner (1969) Eather, R. H., & Reasoner, D. L. 1969, Appl. Opt., 8, 227
- Hauser & Dwek (2001) Hauser, M. G., & Dwek, E. 2001, ARA&A, 39, 249
- Hodapp et al. (1996) Hodapp, K., et al. 1996, New Astronomy, 1, 177
- Krause (2005) Krause, D. J. 2005, in ESA Special Publication, Vol. 590, 17th ESA Symposium on European Rocket and Balloon Programmes and Related Research, ed. B. Warmbein, 305–310
- Lee et al. (2010) Lee, D. H., et al. 2010, Journal of Astronomy and Space Sciences, 27, 401
- Matsuura et al. (1994) Matsuura, S., Kawada, M., Matsuhara, H., Matsumoto, T., Noda, M., Tanaka, M., & Bock, J. J. 1994, PASP, 106, 770
- NASA Sounding Rockets Program Office (2005) NASA Sounding Rockets Program Office. 2005, The NASA Sounding Rocket Program Handbook, NASA
- Percival et al. (2008) Percival, J. W., Nordsieck, K. H., & Jaehnig, K. P. 2008, in Society of Photo-Optical Instrumentation Engineers (SPIE) Conference Series, Vol. 7010, Society of Photo-Optical Instrumentation Engineers (SPIE) Conference Series
- Renbarger et al. (2011) Renbarger, T., et al. 2011, In Prep.
- Tsumura et al. (2010) Tsumura, K., et al. 2010, ApJ, 719, 394
- Tsumura et al. (2011) —. 2011, ApJS (Submitted)
- Wildeman et al. (1993) Wildeman, K. J., et al. 1993, Cryogenics, 33, 402
- Yost et al. (2000) Yost, S. A., Bock, J. J., Kawada, M., Lange, A. E., Matsumoto, T., Uemizu, K., Watabe, T., & Wada, T. 2000, ApJ, 535, 644
- Zemcov et al. (2011) Zemcov, M., et al. 2011, Proceedings of Science, Cosmic Radiation Fields 2010, 38