High resolution spectroscopy of the high velocity hot postAGB star LS III +52∘24 (IRAS 22023+5249)
Abstract
The first high-resolution (R50,000) optical spectrum of the Btype star, LS III +52∘24, identified as the optical counterpart of the hot postAGB candidate IRAS 22023+5249 (I22023) is presented. We report the detailed identifications of the observed absorption and emission features in the full wavelength range (42909015 Å) as well as the atmospheric parameters and photospheric abundances (under the Local Thermodinamic Equilibrium approximation) for the first time. The nebular parameters (Te, Ne) are also derived. We estimate Teff=24,000 K, log g=3.0, =7 kms-1 and the derived abundances indicate a slightly metal-deficient evolved star with C/O1. The observed PCygni profiles of hydrogen and helium clearly indicate on-going postAGB mass loss. The presence of [N II] and [S II] lines and the nondetection of [O III] indicate that photoionisation has just started. The observed spectral features, large heliocentric radial velocity, atmospheric parameters, and chemical composition indicate that I22023 is an evolved postAGB star belonging to the old disk population. The derived nebular parameters (Te=7000 K, Ne=1.2104 cm-3) also suggest that I22023 may be evolving into a compact, young low-excitation Planetary Nebula. Our optical spectroscopic analysis together with the recent Spitzer detection of double-dust chemistry (the simultaneous presence of carbonaceous molecules and amorphous silicates) in I22023 and other B-type post-AGB candidates may point to a binary system with a dusty disk as the stellar origin common to the hot post-AGB stars with O-rich central stars.
keywords:
Stars: AGB and postAGB – Stars: earlytype – Stars: abundances – Stars: evolution1 Introduction
The discovery of high Galactic latitude cool (F, G, K) and hot (O,B) post Asymptotic Giant Branch (post-AGB) supergiants - e.g., HD 161796 (Parthasarathy & Pottasch 1986) and LSII +34∘26 (Parthasarathy 1993) - indicated that K, G, F, A, O, B postAGB supergiants form an evolutionary sequence in the transition region from the tip of the AGB into the early stages of Planetary Nebulae (PNe). Since then, several cool and hot postAGB candidates have been identified (Pottasch & Parthasarathy 1988; Parthasarathy & Pottasch 1989; GarcíaLario et al. 1997a; Parthasarathy et al. 2000a). Gauba & Parthasarathy (2003, 2004) analysed the UV spectra and circumstellar dust envelopes of several hot postAGB stars from the above lists, including LS III +52∘24. Yet to date, the high-resolution (R30,000) optical spectra of only a few hot postAGB stars have been studied (Sarkar et al. 2005 and references therein). In order to unveil the evolutionary origins, atmospheric parameters, and chemical compositions of hot post-AGB stars, there is a clear need to carry out detailed spectroscopic studies of more examples of this exotic class of post-AGB stars.
The optically bright Btype star, LS III +52∘24 identified with the IR source IRAS 22023+5249 (hereafter, I22023) has farIR colors similar to PNe (see Table 1). It is listed in Wackerling’s (1970) Catalog of earlytype emissionline stars. Recent groundbased high spatial resolution images in the near-IR have shown H2 emission arising close to the central star, possibly in an incipient bipolar morphology (Volk et al. 2004). Indeed, Kelly & Hrivnak (2005) show that the excitation mechanism of the H2 emission in I22023 is a combination of radiative (fluorescence) and thermal (shock) excitation. Gauba & Parthasarathy (2004) reported the presence of weak amorphous (10.8m) and crystalline (33.6m) silicate features in the I22023’s Infrared Space Observatory (ISO) spectrum and classified the object as O-rich. However, more recent and higher sensitiviy Spitzer/IRS spectra show that I22023 display a mixed-chemistry (both C-rich and O-rich dust features) with the presence of the classical aromatic infrared bands (AIBs; e.g., those at 6.2, 7.7, 8.6, and 11.3 m) together with broad 10 m amorphous silicate emission and a strong IR excess (Cerrigone et al. 2009).
In this paper, we explore the first high-resolution (R50,000) optical spectrum of I22023 in order to unveil its evolutionary status and chemical composition and to learn about the stellar origins of this peculiar type of hot post-AGB stars. In Sect. 2 we briefly describe the optical observations of I22023 and the data reduction process. A detailed analysis of the optical spectrum is presented in Sect. 3 while the photospheric and nebular analysis performed are shown in Sect. 4. We finish with a discussion and conclusions in Sect. 5.
2 Observations and data reduction
I22023 was observed on 14 July 2001 using the Utrecht Echelle Spectrograph (UES) on the 4.2m William Herschel Telescope (WHT) at the Roque de los Muchachos Observatory in La Palma (Spain). The observations were made with the 31.6 lines/mm echelle grating (E31), SITe1 CCD (2048 2048 pixels of 24 m), a slit width of 1″on the sky and a central wavelength of 5500 Å, resulting in a resolving power of R50,000. The wavelength coverage was 42904735 Å , 47605553 Å and 56079015 Å. A ThAr comparison lamp was used for wavelength calibration.
The one-dimensional spectrum was extracted using standard reduction procedures for echelle spectroscopy in the IRAF package. The data reduction steps included bias and scattered light subtraction, flat-field correction, order extraction, and wavelength calibration. The reduced spectrum was continuumnormalised. The final signal-to-noise (S/N) ratio varied from 30 in the blue to more than 60 towards the red end of the spectrum.
| IRAS | Name | RA | DEC | l | b | Sp. Type | V | BV | IRAS Fluxes (Jy) | |||
| 2000 | 2000 | Optical | 12 m | 25 m | 60 m | 100 m | ||||||
| 22023+5249 | LSIII +52 24 | 22:04:12.30 | +53:04:01.4 | 99.30 | 1.96 | Ba | 12.52b | 0.69b | 1.02 | 24.69 | 14.52 | 3.93L |
aSpectral type is from the SIMBAD database. bPhotometry is from Hog et al. (2000). L flag indicates that the quoted IRAS flux density is an upper limit.
3 Analysis of the optical spectrum
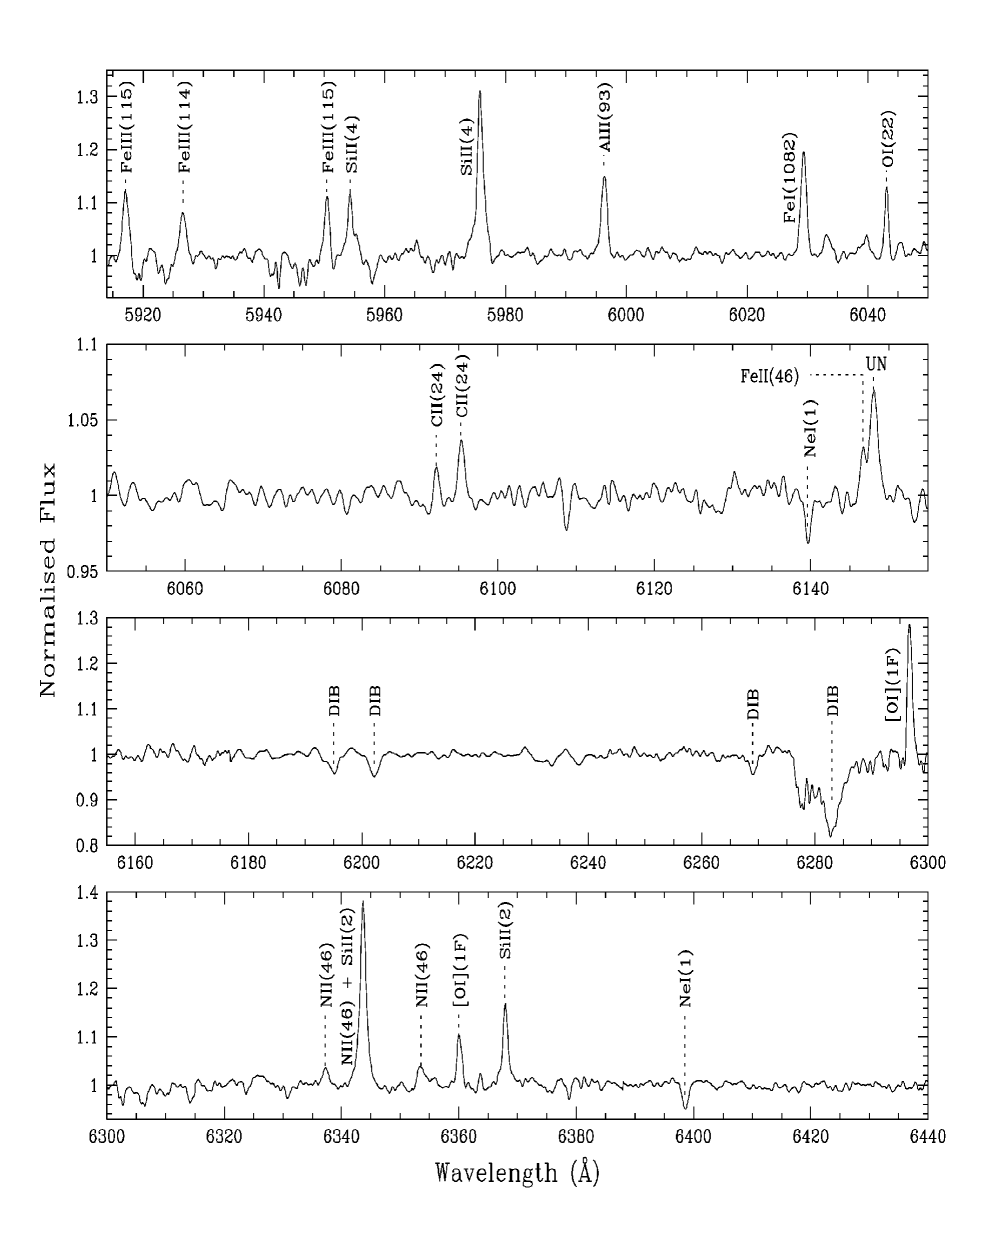
Equivalent widths (Wλ) of the absorption and emission lines were measured. Deblending was done whenever required to obtain Gaussian fits to the blended line profiles. The complete continuumnormalised spectrum of I22023 is presented in the appendix (Figure 4). This spectrum would be useful for future observers since postAGB stars show both short and longterm variability in the absorption and emission line strengths and profiles. PCygni profiles detected in these stars are also expected to vary as the stellar wind and postAGB mass loss rates may show variations as the star evolves. The line identifications are presented in Tables 2 to 5 and are based on the Moore multiplet table (1945) and the linelists of Parthasarathy et al. (2000b), Klochkova et al. (2002) and Sarkar et al. (2005). Unidentified lines are denoted by “UN”. Night sky emission lines denoted by “atmos.” were identified from Osterbrock et al. (1996). The laboratory wavelengths, log (gf) values, and excitation potentials () have been extracted from the Kurucz (CDROM 23) linelist GFALL (Moore 1945). Ivan Hubeny and Thierry Lanz have compiled the Kurucz linelists with improved oscillator strengths from the NIST Atomic Spectra Database. For wavelengths below 7500 Å we have used their data which may be retrieved from http://nova.astro.umd.edu/Synspec43/synspecframesdata.html. Note also that in Table 2 the rest wavelengths from Hobbs et al. (2008) are given for the diffuse interstellar bands (DIBs) identified in I22023.
| Ident. | Wλ | log (gf) | Vr | ||||
|---|---|---|---|---|---|---|---|
| (Å ) | (Å ) | (Å ) | (eV) | (Å ) | km s-1 | ||
| 4314.874 | 4317.139 | OII(2) | 0.1609 | 0.386 | 22.9525.82 | 2.265 | 142.53 |
| 4317.277 | 4319.630 | OII(2) | 0.2197 | 0.380 | 22.9625.83 | 2.353 | 148.55 |
| 4343.245 | 4345.560 | OII(2) | 0.1448 | 0.346 | 22.9625.81 | 2.315 | 144.95 |
| 4345.141 | 4347.413 | OII(16) | 0.0480 | 0.024 | 25.6428.49 | 2.272 | 141.91 |
| 4347.137 | 4349.426 | OII(2) | 0.2489 | 0.060 | 22.9825.83 | 2.289 | 143.01 |
| 4348.903 | 4351.260 | OII(16) | 0.0483 | 0.227 | 25.6428.49 | 2.357 | 147.64 |
| 4364.653 | 4366.895 | OII(2) | 0.1130 | 0.348 | 22.9825.82 | 2.242 | 139.15 |
| 4385.301 | 4387.929 | HeI(51) | 0.3722 | 0.883 | 21.2024.03 | 2.628 | 164.80 |
| 4412.525 | 4414.899b | OII(5) | 0.172 | 23.4226.23 | blend | ||
| 4414.702 | 4416.975c | OII(5) | 0.1319 | 0.077 | 23.4026.21 | 2.384 | blend |
| 4435.158 | 4437.551 | HeI(50) | 0.0786 | 2.034 | 21.2023.99 | 2.393 | 146.91 |
| 4478.638 | 4479.885 | AlIII(8) | 0.0524 | 0.900 | 20.7723.53 | ||
| 4479.971 | AlIII(8) | 1.020 | 20.7723.53 | ||||
| 4481.126 | MgII(4) | 0.740 | 8.8611.62 | 2.488 | 151.70 | ||
| 4550.109 | 4552.622 | SiIII(2) | 0.3600 | 0.181 | 19.0021.72 | 2.513 | 150.73 |
| 4565.371 | 4567.840 | SiIII(2) | 0.3225 | 0.039 | 19.0021.72 | 2.469 | 147.28 |
| 4572.278 | 4574.757 | SiIII(2) | 0.1638 | 0.509 | 19.0021.71 | 2.479 | 147.70 |
| 4588.513 | 4590.974 | OII(15) | 0.1206 | 0.350 | 25.6428.34 | 2.461 | 145.95 |
| 4593.736 | 4596.177 | OII(15) | 0.1507 | 0.200 | 25.6428.34 | 2.441 | 144.46 |
| 4627.829 | 4630.539 | NII(5) | 0.0983 | 0.094 | 18.4721.14 | 2.710 | 160.70 |
| 4636.365 | 4638.856 | OII(1) | 0.1682 | 0.332 | 22.9525.62 | 2.491 | 146.23 |
| 4639.279 | 4641.810 | OII(1) | 0.3179 | 0.055 | 22.9625.63 | 2.531 | 148.71 |
| 4644.997 | 4647.418 | CIII(1) | 0.1181 | 0.070 | 29.5132.18 | 2.421 | 141.41 |
| 4646.569 | 4649.135 | OII(1) | 0.3387 | 0.308 | 22.9825.65 | 2.566 | 150.71 |
| 4648.297 | 4650.16 | CIII(1) | 0.2709 | blend | |||
| 4650.841 | OII(1) | ||||||
| 4651.35 | CIII(1) | ||||||
| 4659.126 | 4661.632 | OII(1) | 0.2431 | 0.278 | 22.9625.62 | 2.506 | 146.40 |
| 4671.265 | 4673.733 | OII(1) | 0.0644 | 1.090 | 22.9625.61 | 2.468 | 143.55 |
| 4673.706 | 4676.235 | OII(1) | 0.1598 | 0.394 | 22.9825.63 | 2.529 | 147.38 |
| 4693.804 | 4696.353 | OII(1) | 0.0346 | 1.380 | 22.9825.62 | 2.558 | 148.53 |
| 4696.824 | 4699.218 | OII(25) | 0.0944 | 0.270 | 26.2128.84 | 2.394 | 137.96 |
| 4702.873 | 4705.346 | OII(25) | 0.0621 | 0.477 | 26.2328.86 | 2.473 | 142.80 |
| 4817.027 | 4819.712 | SiIII(9) | 0.0556 | 0.750 | 25.9628.53 | 2.685 | 152.26 |
| 4826.346 | 4828.951 | SiIII(9) | 0.0344 | 1.090 | 25.9728.53 | 2.605 | 146.97 |
| 4904.197 | 4906.830d | OII(28) | 0.161 | 26.2928.81 | 2.633 | 146.11 | |
| 4918.616 | 4920.35 | HeI(49) | 0.4414 | 21.1323.64 | blend | ||
| 4921.931 | HeI(48) | 0.435 | 21.2023.72 | ||||
| 4921.878 | 4924.529 | OII(28) | 0.0851 | 0.074 | 26.2928.80 | 2.651 | 146.63 |
| 4940.268 | 4943.005 | OII(33) | 0.0825 | 0.239 | 26.5429.05 | 2.737 | 151.24 |
| 5000.141 | 5002.703 | NII(4) | 0.0328 | 1.022 | 18.4520.92 | 2.562 | 138.77 |
| 5002.414 | 5005.150 | NII(19) | 0.0336 | 0.594 | 20.6523.13 | 2.736 | 149.12 |
| 5007.895 | 5010.621 | NII(4) | 0.0851 | 0.607 | 18.4520.92 | 2.726 | 148.34 |
| 5042.253 | 5044.8 | CII(35) | 0.1148 | blend | |||
| 5045.098 | NII(4) | ||||||
| 5044.65 | 5047.2 | CII(35) | 0.0825 | blend | |||
| 5047.736 | HeI(47) | ||||||
| 5130.277 | 5132.947 | CII(16) | 0.0376 | 0.211 | 20.6923.10 | blend | |
| 5133.282 | CII(16) | 0.178 | 20.6923.10 | ||||
| 5140.722 | 5143.495 | CII(16) | 0.0640 | 0.212 | 20.6923.10 | blend | |
| 5142.407 | 5145.165 | CII(16) | 0.0523 | 0.189 | 20.7023.10 | blend | |
| 5148.32 | 5151.085 | CII(16) | 0.0446 | 0.179 | 20.7023.10 | 2.765 | 146.16 |
| 5216.486 | UN | 0.0471 | |||||
| 5486.97 | 5487.69 | DIB | 0.0343 | 0.460 | 10.28 | ||
| 5663.356 | 5666.630 | NII(3) | 0.1400 | 0.045 | 18.4520.64 | 3.274 | 158.46 |
| 5672.88 | 5676.02 | NII(3) | 0.1433 | 0.367 | 18.4520.63 | 3.14 | 151.09 |
| 5676.262 | 5679.56 | NII(3) | 0.2223 | 0.250 | 18.4720.65 | 3.298 | 159.33 |
| 5682.922 | 5686.21 | NII(3) | 0.0382 | 0.549 | 18.4520.63 | 3.288 | 158.60 |
| Ident. | Wλ | log (gf) | Vr | ||||
|---|---|---|---|---|---|---|---|
| (Å ) | (Å ) | (Å ) | (eV) | (Å ) | km s-1 | ||
| 5693.475 | 5695.920 | CIII(2) | 0.1418 | 0.017 | 32.0834.26 | ||
| 5696.604 | AlIII(2) | 0.230 | 15.6317.81 | 3.129 | 149.91 | ||
| 5707.504 | 5710.770 | NII(3) | 0.0552 | 0.518 | 18.4720.64 | 3.266 | 156.70 |
| 5719.637 | 5722.730 | AlIII(2) | 0.0786 | 0.070 | 15.6317.80 | 3.093 | 147.27 |
| 5736.688 | 5739.734 | SiIII(4) | 0.2575 | 0.160 | 19.7121.87 | 3.046 | 144.34 |
| 5779.728 | 5780.480 | DIB | 0.3405 | 0.682 | 20.52 | ||
| 5796.444 | 5797.060 | DIB | 0.0440 | 0.586 | 15.46 | ||
| 6139.673 | 6143.063 | NeI(1) | 0.0282 | 0.350 | 16.6118.62 | 3.39 | 150.68 |
| 6195.200 | 6195.980 | DIB | 0.0756 | 0.790 | 23.38 | ||
| 6202.191 | 6203.050 | DIB | 0.0966 | 0.869 | 27.16 | ||
| 6269.073 | 6269.850 | DIB | 0.0691 | 0.777 | 22.50 | ||
| 6282.734 | 6283.840e | DIB | 0.7319 | 1.126 | 38.89 | ||
| 6398.61 | 6402.246 | NeI (1) | 0.0543 | 0.360 | 16.6118.54 | 3.636 | 155.48 |
| 6612.857 | 6613.620 | DIB | 0.1268 | 0.773 | 20.19 | ||
| 6637.522 | 6641.031 | OII(4) | 0.0238 | 0.884 | 23.4025.27 | 3.509 | 143.64 |
| 6717.943 | 6721.388 | OII(4) | 0.0963 | 0.610 | 23.4325.27 | 3.445 | 138.89 |
| 7766.623 | 7771.944 | OI(1) | 0.576 | 0.320 | 9.1410.74 | blend | |
| 7769.416 | 7774.166 | OI(1) | 0.434 | 0.170 | 9.1410.74 | blend | |
| 7775.388 | OI(1) | 0.050 | 9.1410.74 | ||||
| 8592.524 | UN | 0.265 | |||||
| 8646.868 | 8648.280 | DIB | 0.466 | 1.412 | 34.11 |
a Note that the rest wavelengths from Hobbs et al. (2008) are given for the DIBs. bOII(5) 4414.899Å is blended with FeII(32) Å emission. cOII(5) 4416.975Å is blended with the absorption component of FeIII(114) 449.596 PCygni profile. dOII(28) 4906.88 Å is blended with [FeII](20F) 4905.35 Å emission. eDIB 6283.84Å is blended with telluric absorption lines in this region.
| Ident. | Wλ | log (gf) | Vr | ||||
|---|---|---|---|---|---|---|---|
| (Å ) | (Å ) | (Å ) | (eV) | (Å ) | km s-1 | ||
| 4411.134 | 4413.601a | FeII(32) | 0.0600 | 3.870 | 2.675.48 | blend | |
| 4811.856 | 4814.55 | [FeII](20F) | 0.0409 | 2.694 | 153.00 | ||
| 4902.59 | 4905.35b | [FeII](20F) | 0.0287 | blend | |||
| 5038.313 | 5041.024 | SiII(5) | 0.1095 | 0.291 | 10.0612.52 | 2.711 | 146.47 |
| 5053.306 | 5055.984 | SiII(5) | 0.2758 | 0.593 | 10.0712.52 | blend | |
| 5056.317 | SiII(5) | 0.359 | 10.0712.52 | ||||
| 5088.76 | UN | 0.0244 | |||||
| 5155.834 | 5158.81 | [FeII](19F) | 0.0985 | blend | |||
| 5191.418 | 5193.909 | FeIII(5) | 0.0594 | 2.852 | 8.6511.04 | blend | |
| 5194.384 | FeIII(5) | 8.6511.04 | |||||
| 5195.026 | 5197.929 | FeI(1091) | 0.1135 | 1.640 | 4.306.68 | 2.903 | 152.68 |
| 5197.427 | UN | 0.084 | |||||
| 5232.982 | UN | 0.0412 | |||||
| 5240.659 | 5243.306 | FeIII(113) | 0.0997 | 0.405 | 18.2620.62 | blend | |
| 5243.773 | FeI(1089) | 1.150 | 4.256.62 | ||||
| 5258.712 | 5261.61 | [FeII](19F) | 0.0520 | 2.898 | 150.36 | ||
| 5270.327 | 5273.38 | [FeII](18F) | 0.0481 | 3.053 | 158.81 | ||
| 5273.648 | UN | 0.0487 | |||||
| 5279.665 | UN | 0.0756 | |||||
| 5282.071 | UN | 0.0277 | |||||
| 5286.85 | UN | 0.0632 | |||||
| 5296.105 | 5299.044 | OI(26) | 0.1163 | 2.140 | 10.9813.32 | blend | |
| 5297.325 | UN | 0.0366 | |||||
| 5299.853 | UN | 0.0368 | |||||
| 5751.43 | 5754.8 | [NII](3F) | 0.0436 | weak | |||
| 5830.998 | 5834.06 | FeII(165) | 0.0705 | 3.738 | 5.577.69 | 3.062 | 142.58 |
| 5917.114 | 5920.124 | FeIII(115) | 0.1332 | 0.034 | 18.7820.87 | 3.01 | 137.66 |
| 5926.609 | 5929.685 | FeIII(114) | 0.0964 | 0.351 | 18.5020.59 | 3.076 | 140.75 |
| 5950.424 | 5953.613 | FeIII(115) | 0.0989 | 0.186 | 18.7820.86 | 3.226 | 147.69 |
| 5954.336 | 5957.559 | SiII(4) | 0.1449 | 0.301 | 10.0612.14 | 3.223 | 147.43 |
| 5975.851 | 5978.930 | SiII(4) | 0.4134 | 0.004 | 10.0712.14 | 3.079 | 139.62 |
| 5996.369 | 5999.70 | AlII(93) | 0.1843 | 15.5217.57 | blend | ||
| 5999.83 | AlII(93) | 15.5217.57 | |||||
| 6029.382 | 6032.67 | FeI(1082) | 0.2320 | 4.206.25 | 3.288 | 148.64 | |
| 6043.111 | 6046.233 | OI(22) | 0.0968 | 1.895 | 10.9813.03 | blend | |
| 6046.438 | 1.675 | 10.9813.03 | |||||
| 6092.139 | 6095.290 | CII(24) | 0.0131 | 0.029 | 22.5524.58 | 3.151 | 140.22 |
| 6095.324 | 6098.510 | CII(24) | 0.0344 | 0.226 | 22.5624.59 | 3.186 | 141.86 |
| 6146.784 | 6150.10 | FeII(46) | 0.0292 | 3.215.21 | blend | ||
| 6148.099 | UN | 0.0828 | |||||
| 6296.769 | 6300.23 | [OI](1F) | 0.2832 | 3.461 | 149.93 | ||
| 6337.276 | 6340.58 | NII(46) | 0.0479 | 0.192 | 23.2325.18 | 3.304 | 141.46 |
| 6343.686 | 6346.86 | NII(46) | 0.5132 | 0.901 | 23.2225.18 | blend | |
| 6347.109 | SiII(2) | 0.297 | 8.1210.07 | ||||
| 6353.584 | 6357.0 | NII(46) | 0.0511 | 23.2325.18 | 3.416 | 146.34 | |
| 6360.279 | 6363.88 | [OI](1F) | 0.0677 | 3.601 | 154.89 | ||
| 6367.944 | 6371.371 | SiII(2) | 0.1989 | 0.003 | 8.1210.06 | 3.427 | 146.49 |
| 6458.428 | UN | 0.1059 | |||||
| 6544.492 | 6548.1 | [NII](1F) | 2.817 | 3.608 | 150.43 | ||
| 6579.838 | 6583.6c | [NII](1F) | 8.534 | blend | |||
| 6712.772 | 6717.0 | [SII](2F) | 0.5017 | 4.228 | 173.96 | ||
| 6727.154 | 6731.3 | [SII](2F) | 1.007 | 4.146 | 169.91 | ||
| 6848.05 | 6851.634 | FeI(34) | 0.1321 | 5.320 | 1.613.41 | 3.584 | 142.06 |
| 6998.28 | 7001.93 | OI(21) | 0.0786 | 10.9412.70 | blend | ||
| 7002.22 | OI(21) | 10.9412.70 | |||||
| 7231.330d | CII(3) | 0.043 | 16.3218.03 | blend | |||
| 7236.420d | CII(3) | 0.299 | 16.3218.03 | blend | |||
| 7316.282d | atmos. | ||||||
| 7373.821 | UN | 0.1893 |
| Ident. | Wλ | log (gf) | Vr | ||||
|---|---|---|---|---|---|---|---|
| (Å ) | (Å ) | (Å ) | (eV) | (Å ) | km s-1 | ||
| 7458.676 | UN | 0.1119 | |||||
| 7462.426 | UN | 0.1229 | |||||
| 7464.227 | UN | 0.122 | |||||
| 7892.292 | UN | 0.134 | |||||
| 7993.283 | 7993.332 | atmos. | 0.0534 | ||||
| 8218.700 | 8223.128d | NI(2) | 0.390 | 10.3211.83 | blend | ||
| 8237.897 | 8242.389d | NI(2) | 0.380 | 10.3311.83 | blend | ||
| 8283.265 | UN | blend | |||||
| 8441.864 | 8446.359 | OI(4) | 3.097 | 0.170 | 9.5110.98 | blend | |
| 8446.758 | OI(4) | 0.050 | 9.5110.98 | ||||
| 8745.796d | UN | ||||||
| 8857.744d | UN |
aFeII(32) 4413.601Å is blended with OII(5) 4414.899Å absorption feature. b[FeII](20F) 4905.35Å is blended with OII(28) 4906.88Å absorption feature. c[NII](1F) 6583.6Å is blended with the emission component of CII(2) 6582.88Å PCygni profile. dThese emission lines are weak and are blended with the atmospheric absorption lines in this region.
3.1 Description of the spectrum
The absorption and emission lines in the spectrum of I22023 are similar to those detected in other hot postAGB stars (Parthasarathy et al. 2000b, Klochkova et al. 2002 and Sarkar et al. 2005). In addition to the O I triplet, absorption lines of He I, C II, C III, N II, O II, Ne I, Mg II, Al III, Si III were identified. Emission lines of C II, N II, O I, [O I], Al III, Si II, Fe I, Fe II, [Fe II] and Fe III were also identified in the spectrum of the star. The NaI D1 and D2 lines show a complex structure. The presence of low excitation nebular lines of [N II] and [S II] and the absence of [O III] 5007Å suggest that photoionization has just started, although shock excitation may also be playing a role as indicated by the 40% thermal (shock) excitation to the observed H2 emission (Kelly & Hrivnak 2005). Balmer lines of Hα, Hβ and Hγ show PCygni profiles indicating ongoing postAGB mass loss. Some He I, C II and Fe III lines were also found to have PCygni profiles.
3.2 Radial velocity
Heliocentric radial velocities have been derived from wavelength shifts of the well defined absorption and emission lines (Tables 2, 3, 4, and 5). The mean heliocentric radial velocities from the absorption and emission lines (Tables 2 and 3) are 148.31 0.60 kms-1 and 144.13 0.72 kms-1, respectively. Radial velocity measurements of the forbidden lines have been excluded in estimating the mean. The quoted errors refer to the probable errors of estimation. Figure 1 shows the radial velocity trends with respect to the equivalent widths (Wλ) and lower excitation potentials (LEP) of the absorption and emission lines, respectively.
The mean heliocentric radial velocity of the [N II], [O I] and [Fe II] lines is 152.90 0.96 kms-1. [S II] 6717.0Å and 6731.3Å lines in I22023 have a markedly different heliocentric velocity corresponding to 171.93 1.36 kms-1. The different radial velocities argue for a non-spherical nebula.

3.3 Wind velocities and mass loss rate from the PCygni profiles
The Balmer lines, Hα, Hβ, Hγ, a few He I, C II and Fe III lines in I22023 show PCygni behaviour (see the appendix and Table 4) indicating ongoing massloss. Wind velocities were estimated from the blue absorption edges of the well defined and unblended PCygni profiles (Table 4). The wind velocities of the Fe III(5) lines are markedly different from those of the other species. However, the wind velocities do not show any obvious trend with the lower excitation potentials or ionization potentials of the species. The mean wind velocity from the Balmer, He I and C II lines is 187.48 kms-1 and that from the Fe III(5) lines is 149.26 kms-1. This difference in velocities indicates a deviation from spherical symmetry – possibly a bipolar morphology and the presence of a dense equatorial torus (e.g., Welch et al. 1999; Sahai et al. 2005). Only very high-spatial resolution (FWHM0.15”) images (e.g., using the Hubble Space Telescope) may reveal the true morphology of the object.
The Balmer lines Hα, Hβ, and Hγ in I22023 are shown in Figure 2 where the velocities are in the heliocentric frame. A more detailed modelling of these lines to derive the mass loss rate is out of the scope of this paper. The equivalent widths of the Hα emission components are related to the mass loss rates in OB stars (Leitherer 1988). The Hα emission component in I22023 has an equivalent width (Wλ=37.8Å) comparable to that of the O8I star, HD152408 (Wλ=34.7Å). From this, we estimate a mass loss rate of 1.2310-5 M⊙yr-1 (Leitherer 1988). However, the Leitherer (1988)’s method is valid for massive stars and it may be not applicable for hot post-AGB supergiants. Therefore the mass loss rate estimated for I22023 may be not correct and hence it should be used with caution. Also, in I22023, the large equivalent width of the Hα emission component may be due to a large amount of gas in its circumstellar envelope or to the presence of a possible bipolar envelope (Volk et al. 2004) and may not be directly related to the mass loss rate.
| Ident. | Wλ (absorption) | Wλ (emission) | log (gf) | Wind Velocity | ||
|---|---|---|---|---|---|---|
| (Å ) | (Å ) | (Å ) | (eV) | km s-1 | ||
| 4340.462 | Hγ | 0.4908 | 1.915 | 0.447 | 10.1913.04 | 187.81 |
| 4419.596a | FeIII(4) | 0.0991 | 0.0987 | 2.218 | 8.2311.04 | blend |
| 4431.019 | FeIII(4) | 0.0429 | 0.0506 | 2.572 | 8.2411.04 | weak |
| 4471.477 | HeI(14) | 0.3398 | 0.0828 | 20.9523.72 | blend | |
| 4471.682c | HeI(14) | 0.898 | 20.9523.72 | |||
| 4861.323b | Hβ | 0.1235 | 6.779 | 0.020 | 10.1912.74 | 192.63 |
| 5015.678 | HeI(4) | 0.3955 | 0.5047 | 0.820 | 20.6023.07 | 185.39 |
| 5073.903 | FeIII(5) | 0.1361 | 0.0426 | 2.557 | 8.6511.09 | weak |
| 5086.701 | FeIII(5) | 0.0319 | 0.0338 | 2.590 | 8.6511.09 | weak |
| 5127.387 | FeIII(5) | 0.1048 | 0.1684 | 2.218 | 8.6511.07 | 149.39 |
| 5156.111 | FeIII(5) | 0.1105 | 0.1964 | 2.018 | 8.6411.04 | 149.14 |
| 5875.618 | HeI(11) | 0.5500 | 1.8790 | 20.8722.97 | blend | |
| 5875.650c | HeI(11) | 20.8722.97 | ||||
| 5875.989c | HeI(11) | 20.8722.97 | ||||
| 6562.797b | Hα | 0.0443 | 37.86 | 0.710 | 10.1912.08 | 185.36 |
| 6578.050 | CII(2) | 0.1977 | 0.2779 | 0.026 | 14.4416.32 | 191.55 |
| 6582.880d | CII(2) | 0.327 | 14.4316.32 | blend | ||
| 6678.154 | HeI(46) | 0.6693 | 0.8538 | 0.329 | 21.2023.06 | 182.16 |
| 7065.176 | HeI(10) | 0.3406 | 1.3600 | 0.460 | 20.9522.70 | blend |
| 7065.707c | HeI(10) | 1.160 | 20.9522.70 |
aThe absorption component of FeIII(114) 4419.596Å is blended with OII(5) 4416.975 absorption feature. bThe emission components of the Hβ and Hα profiles have broad wings. Gaussian fits to the absorption and emission components of these profiles could not be obtained. Using IRAF, the equivalent widths of these components were estimated by subtracting the linear continuum between the points of interest and summing the pixels with partial pixels at the ends. c CII(2) 6582.88Å PCygni profile is blended with [NII](1F) 6583.6Å .

3.4 Diffuse interstellar bands (DIBs)
Diffuse interstellar bands (DIBs) at 5487.69 Å, 5780.48 Å, 5797.06 Å, 6195.98 Å, 6203.05 Å, 6269.85 Å, 6283.84 Å, 6613.620 Å, etc. (Hobbs et al. 2008) were identified in the spectrum of the star (see Table 2). DIBs were also detected in the spectra of several other hot postAGB stars such as IRAS 010057910 (Klochkova et al. 2002), IRAS 132665551, and IRAS 173114924 (Sarkar et al. 2005). Some of us presented a detailed analysis of the most famous DIBs in the spectrum of I22023 and in the spectra of several other post-AGB stars (Luna et al. 2008). Luna et al. (2008) found that the DIBs’ strength in post-AGB stars is consistent with the insterstellar extinction toward these sources. This implies that DIBs are not originated in the circumstellar shells of post-AGB stars. Thus, we estimate an interstellar E(BV)=0.67 from the measured equivalent width of 0.3405 Å for the 5780 Å DIB and the correlation measured by Friedman et al. (2011). As we have mentioned before, a more detailed analysis of DIBs in post-AGB stars can be found in the paper by Luna et al. (2008).
3.5 Na I D2 and Na I D1 lines
Six components were identified in the Na I D2 and Na I D1 lines (see Figure 3 and Table 5). The velocities of absorption component 1 and emission component 2 are comparable with the mean heliocentric radial velocities of the absorption and emission lines in the star (Sect. 3.2) suggesting that component 1 is of photospheric origin and component 2 arises in an extended envelope around the central star. Comparing the heliocentric velocities of absorption components 3, 4, and 5 with those of DIBs observed in the spectrum of the star we may infer that these components originate in the interstellar medium. Component 6 is observed in emission with a velocity very different from the envelope velocity. This component may arise in a disk or in outflows around the central star. The velocity of this component is comparable with the expansion velocity estimated from the nebular lines (Sect. 4.2).
| IRAS22023+5249 | |||||||
| Na I D2 | Na I D1 | ||||||
| Component | Wλ | Vr | Wλ | Vr | |||
| (Å ) | (Å ) | (km s-1) | (Å ) | (Å ) | (km s-1) | ||
| 1. | a | 5886.341 | 0.0559 | 169.10 | 5892.323 | 0.0529 | 168.31 |
| 2. | e | 5886.811 | 0.1314 | 145.17 | 5892.763 | 0.0277 | 145.92 |
| 3. | a | 5888.530 | 0.1395 | 57.61 | 5894.500 | 0.1355 | 57.54 |
| 4. | a | 5888.903 | 0.5054 | 38.61 | 5894.881 | 0.3684 | 38.15 |
| 5. | a | 5889.500 | 0.6384 | 8.20 | 5895.455 | 0.6241 | 8.94 |
| 6. | e | 5889.918 | 0.1221 | 13.09 | 5895.902 | 0.1471 | 13.8 |

4 Analysis of the absorption and emission line spectra
4.1 Atmospheric parameters and abundances from absorption line spectrum
The detection of He I and Si III absorption lines in addition to the C III lines and the absence of He II absorption lines, indicates a B0 B1 supergiant spectral type for the central star. A previous comparison of the UV(IUE) spectrum of I22023 with standard stars suggested that the star was similar to a B2supergiant (Gauba & Parthasarathy 2003). Similarly to our previous analysis of the high-resolution optical spectrum of the hot postAGB star IRAS 132665551 (Sarkar et al. 2005), we have used the Kurucz’s WIDTH 9 program and the spectrum synthesis code SYNSPEC (Hubeny et al. 1985) together with solar metallicity Kurucz (1994) model atmospheres to derive the atmospheric parameters and elemental abundances of I22023 under the Local Thermodynamic Equilibrium (LTE) approximation.
The largest number of absorption lines in I22023 are those of O II and N II. We derived the oxygen and nitrogen abundance with the WIDTH 9 program for various combinations of effective temperature (Teff), gravity (log g), and microturbulence (). We covered 18,000 K Teff 25,000 K and 5 10 kms-1. From the Kurucz (1994) model atmospheres, the log g value was limited to a minimum of 3.0. For each combination of these parameters, we then synthesised the spectrum using SYNSPEC. The best fit to the observed spectrum was obtained for Teff = 24,000 1000 K, log g = 3.0 0.5, = 7 1 kms-1. Since strong lines are usually affected by microturbulence, the use of these lines in determining the atmospheric parameters of the star may contribute to systematic errors. Thus, we excluded lines with Wλ 200 mÅ in our estimation of the atmospheric parameters and abundances. Line blends were also excluded from our analysis. Final abundances for He, C, N, O, Ne, and Si are summarized in Table 6. The estimated errors in the derived abundances taking into account typical variations in the atmospheric parameters are listed in Table 7.
| IRAS22023+5249 | Main sequence | |||||
|---|---|---|---|---|---|---|
| (=24000 K, log =3.0, =7 km s-1) | Bstars, Ori OB1 | |||||
| X | n | log | [X/H] | log (X)⊙ | log (X) | |
| He I | 1 | 11.04† | – | 0.11 | 10.93 | 11.04 |
| C II | 4 | 8.58† | – | 0.19 | 8.39 | 8.23 |
| N II | 7 | 8.36 | 0.33 | 0.44 | 7.92 | 7.72 |
| O II | 18 | 8.90 | 0.42 | 0.21 | 8.69 | 8.60 |
| Ne I | 2 | 9.02 | 0.14 | 0.94 | 8.08 | – |
| Al III | 1 | 6.79† | 6.47 | – | ||
| Si III | 3 | 7.43 | 0.59 | 0.12 | 7.55 | – |
The abundances were derived using Kurucz’s WIDTH9 program.
†These values were derived from spectrum synthesis analysis using the SYNSPEC code.
| Element | Teff | log g | ||
|---|---|---|---|---|
| 1000K | 0.5 | 1 km s-1 | ||
| N | 0.14 | 0.18 | 0.05 | 0.23 |
| O | 0.05 | 0.08 | 0.08 | 0.12 |
| Ne | 0.15 | 0.26 | 0.01 | 0.30 |
| Si | 0.04 | 0.06 | 0.07 | 0.10 |
4.1.1 He I lines
Several absorption and PCygni type He I lines were identified in the spectrum of I22023. The absorption lines are blends with the exception of the strong 4387.929 Å He I(51) (Wλ=372.2 mÅ) line and the He I(50) 4437.551 Å line (Wλ=78.6 mÅ). For the derived atmospheric parameters of the star, and by using spectrum synthesis, we estimated the helium abundance from the He I(50) line (see Table 6).
4.1.2 C II and C III lines
Both C II and C III absorption lines were detected in the spectrum of the star. However, the number of these lines in I22023 is low. Furthermore, all the identified carbon lines are blends with the exception of the C II(16) line at 5151.085 Å. The carbon abundance was therefore estimated using spectrum synthesis only. The region of the C II(16) lines ( 51325151 Å) was used for this purpose.
4.1.3 O II lines and the O I triplet
The largest number of absorption lines in the I22023’s spectrum are those of O II. The O II lines with Wλ 200 mÅ may be sensitive to non-LTE effects and such strong O II lines were not considered in our oxygen abundance estimation by using the WIDTH9 program. For the derived atmospheric parameters and the oxygen abundance of log =8.90, we could not obtain a perfect fit to the stronger O II lines with the SYNSPEC code.
On the other hand, the (total) equivalent width of the O I triplet in the spectrum of I22023 is 1.01 Å. This is comparable to the 0.95 Å equivalent width of the O I triplet in the spectrum of the B1.5Ia hot postAGB star, LSII34∘26 (GarcíaLario et al. 1997b; Arkhipova et al. 2001). The O I triplet at 7773Å is known to be sensitive to non-LTE effects. Indeed, we could not obtain a good fit to the O I triplet by assuming the oxygen abundance (log (O)=8.90) derived from the O II lines (Table 6).
4.1.4 N II and Ne I lines
Several N II and two Ne I lines were identified in I22023. The abundances of these lines were estimated using WIDTH9. Again, the stronger N II lines with Wλ 200mÅ were not taken into account in our estimation (log (N)=8.36) of the nitrogen abundance in I22023.
4.1.5 Metallic lines
Only one Mg II line could be identified in the spectrum of the star. This line is blended with Al III(8). Since the Al III abundance in I22023 is uncertain (see below), we did not attempt to estimate the magnesium abundance from the blended 4481.126Å Mg II(4) line. Also, four Al III lines could be identified in I22023. Three of these lines are clear blends with other atomic species. Therefore, we estimated the aluminium abundance from the single 5722.730 Å Al III(2) line by using spectrum synthesis and we derived log (Al)=6.79. This abundance from a single line with Wλ=78.6 mÅ may be treated as an upper limit. The silicon abundance ([Si/H]=0.12) was derived by using three Si III line and suggests that I22023 may be slightly metal deficient. Finally, it is to be noted here that the iron abundance could not be estimated since the iron lines in I22023 appear only in emission or show PCygni profiles.
4.1.6 Uncertainties in the abundance determinations
The standard deviation () which measures the scatter in the abundances due to individual lines of a particular species was estimated using WIDTH9 (Table 6). The true error, /, would be smaller for species with a greater number of lines (n). Table 7 gives the uncertainties in the abundances due to typical uncertainties in the model atmospheric parameters taken for the modelling: Teff=1000K, log g=0.5, and =1 kms-1. Thus, the formal error (always 0.3 dex) in the derived abundances is the quadratic sum of the uncertainties introduced by typical variations of the atmospheric parameters and it is given by in Table 7.
4.2 Analysis of the emission line spectrum
Several permitted and forbidden emission lines were identified in the spectrum of the star and are listed in Table 3. Nebular parameters and expansion velocities were determined using the forbidden lines (see below).
4.2.1 Nebular parameters
In the absence of a flux calibrated spectrum for I22023, it is not possible to obtain the absolute fluxes in the observed emission lines. However, reliable emission line flux ratios may be deduced by combining the observed equivalent widths (Table 3) with estimates of the stellar continuum flux distribution in the regions of the emission lines. The latter were obtained for the derived atmospheric parameters of the star (Sect. 4.1) by using the SYNSEPC code and the Kurucz model atmospheres. The emission line fluxes thus estimated are free from the effects of both interstellar and circumstellar reddening.
The [S II] /6731 line ratio is an electron density diagnostic and the [N II] (65486583)/5755 line ratio is sensitive to electron temperature. In I22023, the [N II] 6583.6 Å emission is blended with the emission component of the C II(2) 6582.88 Å PCygni profile. However, comparing the 6582.88 Å C II(2) profile with the 6578.05 Å C II(2) PCygni profile (see the appendix), we may conclude that the contribution of C II(2) to the [N II] emission profile is negligible. Using the NEBULAR analysis package under IRAF, we obtained Te vs. Ne contours for the observed [S II] and [N II] diagnostic ratios of 0.5 and 166.7, respectively. From the intersection of the contours we obtained Te=7,000 K and Ne=1.2104 cm-3. The high electron density is comparable to that measured in the very young and compact PN Hen31357 (Parthasarathy et al. 1993; Bobrowsky et al. 1998) which evolved from the hot postAGB stage into a PN in the 2030 yrs (Parthasarathy et al. 1995).
Unfortunately, we could not derive the nebular C, N, and O abundances, which could then have been compared with the photospheric abundances to estimate the amount of material lost by the star during nebular formation and the chemical composition of the nebula. Such a calculation requires an estimate of the Hβ emission line flux. However, Hβ in I22023 shows a PCygni profile and it is not possible to estimate the nebular emission from this profile.
4.2.2 Expansion velocities
Expansion velocities were estimated from the FWHM of the unblended [O I], [N II] and [S II] lines using Vexp=0.50 FWHM (see Table 8). Note that the [N II](1F) 6583.6 Å line is blended with the emission component of C II(2) 6582.88 Å P-Cygni profile and has not been used to estimate the expansion velocity.
This approximation is valid when emission is confined to a thin spherically symmetric shell. However, I22023 appears to have an incipient bipolar morphology in recent ground-based high spatial (FWHM0.15”) resolution images (Volk et al. 2004). Furthermore, the observed [O I] 6300.23 Å and 6363.88 Å line profiles appear to be asymmetric. Though no obvious line split is observed in the weak [O I] lines, their asymmetric nature may indicate the presence of a red and a blue component. This may explain the discrepancy between the expansion velocities estimated from [O I], [N II], [S II] lines in I22023, the former being nearly twice that of the latter two species. The mean nebular velocity based on the [N II] and [S II] lines is 17.5 kms-1.
The possible bipolar morphology of this object is not completely established (Volk et al. 2004). In addition, Cerrigone et al. (2008) studied the radio continuum emission of this object and they found that “it is difficult to interpret the morphology observed in I22023 in the framework of the standard interacting stellar wind (ISW) model (e.g., Kwok et al. 1978), even invoking a strong density gradient in the nebula. For this object, a jet would be more likely the source of the observed morphology”.
| Ident. | FWHM | Vexp | |
|---|---|---|---|
| Å | Å | km s-1 | |
| 6300.23 | [OI](1F) | 1.334 | 31.76 |
| 6363.88 | [OI](1F) | 1.470 | 34.65 |
| 6548.1 | [NII](1F) | 0.844 | 19.34 |
| 6717.0 | [SII](2F) | 0.747 | 16.68 |
| 6731.3 | [SII](2F) | 0.739 | 16.47 |
5 Discussion and conclusions
Our analysis of the high-resolution (R50,000) optical spectrum of I22023 together with our detailed line identifications confirm that I22023 is a hot (B-type) O-rich post-AGB star (see below). That I22023 is not a normal population I B star is also suggested by the large heliocentric radial velocity of the star (148.31 0.60 kms-1)111Note that the high radial velocity suggests that I22023 is an old disk low core mass post-AGB star and that there are old disk stars whose chemical composition is close to the solar composition (Furhmann 1998, 2004)., as measured from the absorption lines present in its high-resolution optical spectrum. Thus, it is more likely that I22023 is a postAGB star belonging to the old disk population. The presence of absorption lines of He I, C III, Si III together with [N II], [O I], and [S II] emission lines indicate a low-excitation nebula surrounding the early Btype central star. The observed PCygni profiles in the lines of hydrogen, He I, C II, and Fe III clearly indicate the presence of a stellar wind with a significant post-AGB mass-loss rate, providing strong evidence for on-going postAGB mass loss.
As a first approximation, using LTE analysis, we estimated Teff = 24,000 K 1000 K, log g = 3.0 0.5 and = 7 1 kms-1. The derived CNO abundances are compared with the average CNO abundances for mainsequence Bstars from the Ori OB1 association (Kilian 1992) in Table 6. The CNO abundances indicate that I22023 is an evolved star. We estimated C/O 0.48, implying that the central star is O-rich and that the C/O ratio was not altered during the previous AGB phase. Our Si abundance estimate also suggests that I22023 is only slightly metal-deficient with [Si/H]=-0.120.10. Our derived abundances can be easily explained if I22023 is the descendant of a low-mass (e.g., below 1.5 M⊙) AGB star of roughly solar metallicity. Low-mass stars evolve very slowly and are expected to remain O-rich all the way along the AGB because they experience too few thermal pulses and the third dredge-up is too inefficient222Note also that theoretical models predict a higher efficiency of the dredge-up in low metallicity atmospheres with respect to those with solar metallicity (e.g. Lugaro et al. 2003). to modify the original C/O 1 ratio (see e.g., Herwig 2005 for a review). However, intermediate-mass (1.5 M 3-4 M⊙) AGB stars are converted to carbon and s-process enriched stars (see below) while massive (M 3-4 M⊙) AGB stars remain also O-rich as a consequence of the Hot Bottom Burning (HBB) activation and experience a completely different s-process nucleosynthesis (see e.g., García-Hernández et al. 2006a, 2007a, and references therein). Note that the low-mass interpretation for I22023 would be consistent with the fact that I22023 is an optically bright O-rich post-AGB star while more massive O-rich post-AGB stars (which experienced HBB in the AGB) usually are completely obscured in the optical range by their thick circumstellar envelopes (e.g., García-Hernández et al. 2007b). In short, attending to the high-resolution spectrum of I22023 only, we may conclude that I22023 is a low-mass O-rich post-AGB star.
Even though the IRAS cool (e.g., F, G) and hot (O, B) postAGB stars show supergiant like spectra, indicating an evolutionary sequence in the transition region from the AGB to the PN stage, they seem to show fundamental differences in their chemical compositions. In the high Galactic latitude hot (O-, B-type) postAGB stars, a severe carbon deficiency (i.e., C/O1) is detected indicating that they left the AGB before the third dredgeup (e.g., Conlon et al. 1991; McCausland et al. 1992; Moehler & Heber 1998) has enriched the stellar surface with the products of the complex nucleosynthesis (e.g., carbon and heavy s-process elements such as Rb, Zr, Y, Sr, etc.) experienced during the AGB phase (see e.g., García-Hernández et al. 2007a and references therein). A similar carbon deficiency is also detected in the hot postAGB stars in globular clusters (Moehler et al. 1998; Mooney et al. 2004; Jasniewicz et al. 2004; Thompson et al. 2006). The only exception to this observational evidence is the field hot postAGB star, IRAS 01005+7910, which shows an overabundance of carbon (Klochkova et al. 2002). In contrast, among the IRAS selected cool (F-, G-type) postAGB stars there is a majority of post-AGB stars in which a severe carbon deficiency is not detected. The F-, G-type postAGB stars with the still unidentified 21 micron emission feature show an overabundance of carbon and heavy sprocess elements (e.g., Van Winckel & Reyniers 2000), confirming that they have experienced s-process nucleosynthesis and the third dredgeup in the previous AGB phase and that they evolved from intermediate-mass carbon stars.
Interestingly, Cerrigone et al. (2009) found that I22023 is a double-dust chemistry - i.e., it displays the simultaneous presence of both C-rich and O-rich dust features - post-AGB star from their analysis of the recent Spitzer mid-infrared (5-40 m) spectrum of I22023. The mixed-chemistry is deduced from the detection of amorphous silicates emission at 10 microns together with the classical aromatic infrared bands (AIBs; e.g., at 6.2, 7.7, 8.6, and 11.3 m) usually attributed to carbonaceous compounds. The origin of the double-dust chemistry is still not very well understood and several scenarios, including the presence of a binary central system, a late thermal pulse on the AGB or post-AGB phases, HBB cessation by extreme mass loss, etc., have been proposed to explain the mixed-chemistry phenomenon observed in AGB stars (e.g., García-Hernández et al. 2006b), post-AGB stars (e.g., Waters et al. 1998; Gielen et al. 2011), and PNe (e.g., Perea-Calderón et al. 2009).
The presence of carbonaceous molecules in an O-rich environment such as that in I22023 (the central star is also O-rich!) is surprising and puzzling. Cerrigone et al. (2009) propose that the mixed-chemistry in I22023 (and other hot post-AGB stars) is due to the presence of a circumbinary disk/torus where O-bearing molecules would be preserved from the 3rd dredge-up, while the C-bearing molecules would be formed elsewhere in the outflow. The presence of a binary companion in I22023 and other hot post-AGB stars cannot be ruled out. Indeed, the presence of a close companion (at a distance of 0.4”) in the proto-type hot post-AGB object Hen 3-1357 (the “Stingray Nebula”) is well known (Bobrowsky et al. 1998). In addition, an spectacular incipient bipolar morphology is clearly seen in the HST images of Hen 3-1357. The Spitzer spectrum of Hen 3-1357 (see Perea-Calderón et al. 2009) resembles that of I22023, showing amorphous silicates emission at 10 m together with a strong IR continuum but only a weak carbonaceous emission at 11.3 m is seen; there is a complete lack of the other AIBs at 6.2, 7.7, and 8.6 m. In this context, the likely incipient bipolar morphology observed in I22023 (Volk et al. 2004) would support the presence of a binary companion.
On the other hand, the most recent idea to explain the mixed-chemistry phenomenon is from Guzmán-Ramírez et al. (2011). These authors propose a chemical model able to form hydrocarbon chains in an UV-irradiated dense torus in order to explain the high detection rate of mixed-chemistry in PNe of the Galactic Bulge. However, the UV radiation field in I22023 (Teff=24,000 K) is lower than that in double-dust chemistry PNe (with Teff34,000 K) and may be not intense enough to efficiently break the CO molecules. In addition, the Spitzer infrared spectrum of I22023 is very peculiar because the O-rich silicate dust is mostly amorphous and there is no clear evidence for the presence of crystalline silicate features at wavelengths longer than 20 m. This is in strong contrast with the Spitzer spectra of double-dust chemistry PNe (e.g., Perea-Calderón et al. 2009; Guzmán-Ramírez et al. 2011) where only crystalline silicates are detected.
An alternative explanation to explain the presence of carbonaceous molecules in I22023 may be non-equilibrium chemistry induced by shocks (Cherchneff 2011). Cherchneff (2011) demonstrates that water can form in C-rich evolved stars, showing that, independently of the stellar C/O ratio, thermal fragmentation of CO occurs in the hot post-shock gas. Our optical spectrum of I22023 shows clear evidences of on-going mass loss - i.e., the presence of a strong and variable stellar wind and shocks - which would support this carbonaceous molecules formation scenario. Indeed, other hot (B-type) post-AGB stars such as IRAS 204623416 and IRAS 19336-0400 are infrared spectroscopic twins of I22023, showing both an identical (mixed-chemistry) Spitzer spectrum (see Cerrigone et al. 2009) together with clear indications (e.g., P-cygni profiles) of on-going (and variable) mass loss (see Sanchez-Contreras et al. 2008; Arkhipova et al. 2011). In this scenario, the lack of strong infrared features from carbonaceous molecules in other hot and O-rich post-AGB stars such as IRAS 180622410 (or even the very young PN Hen 3-1357)333No P-cygni profiles (i.e., strong stellar winds) are present in IRAS 180622410 (Arkhipova et al. 2007) and based on the C IV 1550 Å line in the IUE UV spectrum, the fast wind in Hen 3-1357 was stopped in 1995 (Parthasarathy et al. 1995). would be related with the inactivity of strong stellar winds with significant mass loss rates; i.e., the absence of strong shocks activating non-equilibrium chemistry.
In summary, we speculate that the simultaneous presence of carbonaceous molecules and amorphous silicates in I22023 and other hot (B-type) post-AGB stars may point to a binary central system with a dusty disk/torus as the stellar origin common to the hot post-AGB stars hosting O-rich central stars. The episodic character of the stellar wind (shocks) and mass loss in these hot O-rich post-AGB stars would favor shock-induced non-equilibrium chemistry as the carbonaceous molecules formation scenario in these O-rich environments. Further monitoring studies (e.g., monitoring of radial velocity, light variations, strengths and profiles of emission and absorption lines) of this star and other hot post-AGB stars are encouraged in order to understand the circumstellar mixed-chemistry, mass loss rate (and evolution) with the ultimate goal of unveiling the stellar origin of this intriguing class of O-rich post-AGB objects.
Acknowledgments
GS would like to acknowledge financial support from the Department of Science and Technology (DST), Govt. of India through a grant numbered SR/FTP/PS67/2005 . D.A.G.H and A.M. also acknowledge support for this work provided by the Spanish Ministry of Science and Innovation (MICINN) under a JdC grant and under grant AYA-2007-64748. MP is very thankful to Prof. Shoken Miyama for his kind support, encouragement and hospitality.
References
- (1) Arkhipova, V. P., Klochkova, V. G., Sokol, G. V., 2001, AstL, 27, 99
- (2) Arkhipova, V. P., Ikonnikova, N. P., Komissarova, G. V., Noskova, R. I. 2006, in Planetary Nebulae in our Galaxy and Beyond, IAU Symp.#234, Eds. Michael J. Barlow and Roberto H. Méndez, pp. 357
- (3) Arkhipova, V. P., Esipov, V. F., Ikonnikova, N. P. et al. 2007, AstL, 33, 604
- (4) Arkhipova, V. P., Burlak, M. A., Esipov, V. F. et al. 2011, AstL (in press; arXiv: 1111.2408)
- (5) Bakker, E. J., Waters, L. B. F. M., Lamers, H. J. G. L. M. et al. 1996, A&A, 310, 893
- (6) Blöcker, T., Herwig, F., Driebe, T., 2000, MmSAI, 71, 711
- (7) Bobrowsky, M., Sahu, K. C., Parthasarathy, M., GarcíaLario, P., 1998, Nature, 392, 469
- (8) Cerrigone, L., Hora, J. L., Umana, G., & Trigilio, C., 2009, ApJ, 703, 585
- (9) Cerrigone, L., Umana, G., Trigilio, C., Leto, P., Buemi, C. S., & Hora, L., 2008, MNRAS, 390, 363
- (10) Cherchneff, I. 2011, A&A, 526, L11
- (11) Conlon, E. S., Dufton, P. L., Keenan, F. P., & McCausland, R. J. H., 1991 MNRAS, 248, 82
- (12) Friedman, S. D. et al. 2011, ApJ, 727, 33
- (13) Furhmann, K., 1998, A&A, 338, 161
- (14) Furhmann, K., 2004, AN, 325, 3
- (15) García-Hernández, D. A., García-Lario, P., Plez, B. et al. 2006a, Science, 314, 1751
- (16) García-Hernández, D. A., Abia, C., Manchado, A., García-Lario, P. 2006b, A&A, 452, 1049
- (17) García-Hernández, D. A., García-Lario, P., Plez, B. et al. 2007a, A&A, 462, 711
- (18) García-Hernández, D. A., Perea-Calderón, J. V., Bobrowsky, M., García-Lario, P. 2007b, ApJ, 666, L33
- (19) García-Lario, P., Manchado, A., Pych, W., Pottasch, S. R. 1997a, A&AS, 126, 479
- (20) García-Lario, P., Parthasarathy, M., de Martino, D. et al. 1997b, A&A, 326, 1103
- (21) Gauba, G. & Parthasarathy, M. 2003, A&A, 407, 1007
- (22) Gauba, G. & Parthasarathy, M. 2004, A&A, 417, 201
- (23) Gielen, C., Cami, J., Bouwman, J. et al. 2011, A&A (in press; arXiv:1110.5996)
- (24) Guzmán-Ramírez, L., Zijlstra, A. A., Níchuimín, R. et al. 2011, MNRAS, 414, 1667
- (25) Herwig, F. 2005, ARA&A, 43, 435
- (26) Hobbs, L. M. et al. 2008, ApJ, 680, 1256
- (27) Hog, E. Fabricius, C., Makarov, V. V. et al. 2000, A&A, 355, L27
- (28) Hubeny, I., Stefl, S., & Harmanec, P. 1985, Bull. Astron. Inst. Czechosl., 36, 214
- (29) Jasniewicz, G., de Laverny, P., Parthasarathy, M. et al. 2004, A&A, 423, 353
- (30) Kilian, J. 1992, A&A, 262, 171
- (31) Kelly, D. M. & Hrivnak, B. J. 2005, ApJ, 629, 1040
- (32) Klochkova, V. G., Yushkin, M. V., Miroshnichenko, A. S. et al. 2002, A&A, 392, 143
- (33) Kwok, S., Purton, C. R. & Fitzgerald, P. M. 1978, ApJ, 219, L125
- (34) Leitherer, C. 1988, ApJ, 326, 356
- (35) Lugaro, M., Herwig, F., Lattanzio, J. C. et al. 2003, ApJ, 586, 1305
- (36) Luna, R., Cox, N. L. J., Satorre, M. A. et al. 2008, A&A, 480, 133
- (37) McCausland, R. J. H., Conlon, E. S., Dufton, P. L., Keenan, F. P. 1992, ApJ, 394, 298
- (38) Moehler, S. & Heber, U. 1998, A&A, 335, 985
- (39) Moehler, S., Heber, U., Lemke, M., Napiwotzki, R. 1998, A&A, 339, 537
- (40) Mooney, C. J, Rolleston, W. R. J., Keenan, F. P. et al. 2004, A&A, 419, 1123
- (41) Moore, C. E. 1945, A multiplet table of astrophysical interest part - I,Table of Multiplets revised ed. (Princeton, Princeton Univ. Obs.)
- (42) Omont, A., Loup, C., Forveille, T. et al. 1993, A&A, 267, 515
- (43) Osterbrock, D. E., Fulbright, J. P., Martel, A. R. et al. 1996, PASP, 108, 277
- (44) Parthasarathy, M., Pottasch, S. R. 1986, A&A, 154, L16
- (45) Parthasarathy, M., Pottasch, S. R. 1989, A&A, 225, 521
- (46) Parthasarathy, M., 1993, ApJ, 414, L109
- (47) Parthasarathy, M., García-Lario, P., Pottasch, S. R. et al. 1993 A&A, 267, L19
- (48) Parthasarathy, M., García-Lario, P., de Martino, D. et al. 1995, A&A, 300, L25
- (49) Parthasarathy, M., Vijapurkar, J., Drilling, J. S. 2000a, A&AS, 145, 269
- (50) Parthasarathy, M., García-Lario, P., Sivarani, T. et al. 2000b, A&A, 357, 241
- (51) Perea-Calderón, J. V., García-Hernández, D. A., Bobrowsky, M. et al. 2009, A&A, 495, L1
- (52) Pottasch, S. R., Parthasarathy, M. 1988, A&A, 192, 182
- (53) Ryans, R.S.I., Dufton, P.L., Mooney, C.J., et al. 2003, A&A, 401, 1119
- (54) Sánchez Contreras, C., Sahai, R., Gil de Paz, A., Goodrich, R. 2008, ApJS, 179, 166
- (55) Sarkar, G., Parthasarathy, M., Reddy, B. E. 2005, A&A, 431, 1007
- (56) Sahai, R., Sánchez Contreras, C., Morris, M. 2005, ApJ, 620, 948
- (57) Schlegel, D. J., Finkbeiner, D. P., & Davis, M. 1998, ApJ, 500, 525
- (58) Thompson, H. M. A., Keenan, F. P., Dufton, P. L. et al. 2006, MNRAS, 368, 1749
- (59) Van Winckel, H., & Reyniers, M. 2000, A&A, 354, 135
- (60) Volk, K., Hrivnak, B. J., Kwok, S. 2004, ApJ, 616, 1181
- (61) Wackerling, L. R. 1970, Mem. Roy. Astron. Soc., 73, 153
- (62) Waters, L. B. F. M., Molster, F. J., de Jong, T. et al. 1996, A&A, 315, L361
- (63) Welch, C. A., Frank, A., Pipher, J. L., Forrest, W. J., 1999, ApJ, 522, L69
High resolution optical spectrum of IRAS 22023+5249