Gas and stellar metallicities in HII galaxies
Abstract
We examine the gas and stellar metallicities in a sample of HII galaxies from the Sloan Digital Sky Survey, which possibly contains the largest homogeneous sample of HII galaxy spectra to date.
We eliminated all spectra with an insufficient signal-to-noise ratio, without strong emission lines, and without the [OII] 3727 Å line, which is necessary for the determination of the gas metallicity. This excludes galaxies with redshift . Our final sample contains 700 spectra of HII galaxies.
Through emission line strength calibrations and a detailed stellar population analysis employing evolutionary stellar synthesis methods, which we already used in previous works, we determined the metallicities of both the gas and the stellar content of these galaxies.
We find that in HII galaxies up to stellar masses of , enrichment mechanisms do not vary with galactic mass, being the same for low- and high-mass galaxies on average. They do seem to present a greater variety at the high-mass end, though, indicating a more complex assembly history for high-mass galaxies. In around 23 per cent of our HII galaxies we find a metallicity decrease over the last few Gyr. Our results favour galaxy evolution models featuring constantly infalling low-metallicity clouds that retain part of the galactic winds. Above stellar mass, the retention of high metallicity gas by the galaxies’ gravitational potential dominates.
keywords:
ISM: abundances – Galaxies: evolution – Galaxies: starburst.1 Introduction
HII galaxies are characterised by prominent emission lines.
In fact, they are defined as having strong H and
OIII lines, but other ionised hydrogen (H, H,
etc.) and high excitation metallicity lines (OII, NII, and others)
are strong too.
These emission lines are driven by photoionisation of interstellar
gas by hot massive stars from young stellar populations
(Sargent & Searle, 1970; French, 1980).
The star forming activity in HII galaxies is so strong that
it can certainly not have been maintained at its present level
during a Hubble time (see e.g. Searle, Sargent & Bagnuolo, 1973).
In fact, they are the most extreme case of star forming galaxies,
showing the highest excitation emission lines, and thus the highest
(relative) star formation rates (SFRs).
They are also the lowest metallicity galaxies of the interstellar
medium, with metallicities around one tenth solar
(Vílchez & Iglesias-Páramo, 2003; Pérez-Montero & Díaz, 2003; Kniazev et al., 2004; Kehrig et al., 2006; Izotov et al., 2006; Hägele et al., 2008; Pérez-Montero et al., 2010, and others).
It is now clear that the hypothesis of HII galaxies as galaxies
experiencing their first star formation burst can be ruled out, and
that their stellar content is predominantly old, older than one Gyr
(Raimann et al., 2000; Cid Fernandes, Leão & Lacerda, 2003; Kong et al., 2003; Westera et al., 2004; Cid Fernandes et al., 2007; Asari et al., 2007; Hoyos et al., 2007, and others),
Nevertheless, both the high relative SFRs and the low metallicities
indicate that HII galaxies are among the least evolved galaxies
in existence, which assigns to them a special role as fossil record
of galaxy evolution (Lequeux et al., 1979).
They are, therefore, ideal objects for chemical evolution studies.
Several authors have developed theoretical evolutionary models of
dwarf irregular galaxies, of which HII galaxies are a sub-category.
Some of these models predict the galaxies’ present-day stellar - and gas
metallicities, among other properties.
In these models, several chemical enrichment processes are
identified.
MacLow & Ferrara (1999) developed single-phased hydrodynamical models for
dwarf galaxies.
They model the effects of repeated supernova type II (SNII) explosions
from starbursts on the interstellar medium, that is,
the enrichment by the ejected metals on the one hand, and
the gas loss by supernova winds on the other hand, taking into
account the gravitational potential of their dark matter haloes.
They find that, in galaxies with gas masses below ,
most of the gas is blown away, and in galaxies with masses between
and , mainly the newly-formed
metal-rich gas is blown away, whereas the already present, metal-poor,
gas is retained.
They do not calculate the final (present-day) metallicities of their
model galaxies, but it is obvious that they remain low-metallicity,
at least the ones with gas masses below .
Recchi et al. (2001, 2002) simulate IZw18, one of the
lowest-metallicity galaxies known, using a single star formation
burst model and a model with a doubly peaked star formation
history.
They use a lower SNII heating efficiency than MacLow et al.
in their models, but include type Ia supernovae (SNeIa),
for which they use a higher heating efficiency.
As a consequence, alpha elements are ejected less efficiently
than in MacLow et al.’s model, resulting in higher metallicities.
The iron-peak elements, which are produced in SNeIa,
on the other hand, are still ejected, causing high [/Fe]
ratios.
The (gas) metallicity in their single burst model remains very low,
[O/H, depending on the galaxy mass.
In their (more likely) double burst model, [O/H] can reach values up
to -1, depending on the details of the models, that is, the stellar
yields used, the stellar initial mass function (IMF), the time between
the bursts, the duration of the second burst, the gas density and -
metallicity in the star forming region, and the total mass of the
stars formed in the second burst.
The final metallicities of the double burst model galaxies are
between 0.6 and 1 dex higher than after the first burst.
Tenorio-Tagle et al. (2006) include photoionisation and cluster wind in
their two-dimensional hydrodynamic calculations.
They identify two mechanisms:
The storage of clouds into a long-lasting ragged shell inhibiting
the expansion of the thermalised wind, and the steady filtering of
the shocked wind gas through channels carved within the cloud layer.
They conclude that both processes must be at work in HII galaxies.
Unfortunately, they make no prediction about the present-day metallicity
of their model galaxies.
In a series of papers, Recchi and collaborators use a new generation of
chemo-dynamical models, some of which include infalling clouds.
The first two, Recchi et al. (2004) and Recchi et al. (2006), are
aimed at reproducing the properties of two specific objects,
IZw18 and NGC1569, respectively.
The third one, Recchi & Hensler (2007) investigates the influence of
several factors, such as the cloudiness of the gas distribution,
the IMF slope, and stellar yields.
They find that models with continuous low level star formation periods
in the past followed by a quiescent phase and a recent, stronger burst
best reproduce the chemical properties of the studied galaxies.
They also find that, for a homogeneous gas distribution, metals get
blown away by galactic winds, but cool infalling intergalactic clouds
can hamper these galactic winds.
The final metallicities in the their various models vary from
-2.5 to -0.8.
Although metallicity determinations of the various components of
HII galaxies cannot discriminate, how much each of these mechanisms
contribute to the chemical evolution, they can quantify the
metallicity at various stages of a galaxy’s evolution, i.e.
at the time of the formation of the old ( Gyr) stellar populations
and at present, and thereby help to rule out some of the evolutionary
scenarios, and support others.
HII galaxies have the advantage that it is possible to determine
independently the metallicities of the young and the old populations
from their spectra.
As the young populations were formed recently out of the same
gas that is responsible for the emission lines, their metallicity
can be assumed to be more or less the same as the one of the
gas, which can be determined from the emission line strengths.
The metallicity of the old populations, on the other hand, can be
determined from the continuum and absorption features through
population synthesis.
The main goal of the present work is to measure the chemical enrichment
in a homogeneous sample of HII galaxies, and examine possible
trends with galactic properties such as total mass.
This way, we can evaluate the different models and make statements
on the importance of the various enrichment mechanisms.
Until recently, the discovery of HII galaxies was limited to the visual
inspection of objective-prism surveys, introducing ill-controlled
biases and selection effects
(for compilations, see Terlevich et al., 1991; Kehrig, Telles & Cuisinier, 2004, and references therein).
The Sloan Digital Sky Survey (SDSS; York et al., 2000) presents for the
first time a comprehensive database of galactic spectra.
Data release 7 (Abazajian et al., 2009) contains over 900’000 galaxy spectra
that have been selected on clear magnitude limiting criteria.
In an unprecedented manner, the SDSS allows to study star forming emission
line galaxies based on clear and quantitative criteria,
and not mere visual inspection.
In this work, we define clear emission line strength criteria to
distinguish galaxies containing strongly excited gas from other
emission line galaxies.
We only include spectra that contain the
[OII] 3727 Å emission line, as this line is indispensable
for an adequate determination of the gas metallicity.
This criterion excludes galaxies with redshift
.
This way, we selected a homogeneous sample of HII galaxy
spectra of high quality from the SDSS.
In this sample, we determine the metallicities of both the gas and
the old stellar content using emission line calibration
and stellar population synthesis methods, respectively.
It is the first time an independent metallicity determination
of the gas and the stars is performed on a clearly defined
HII galaxy sample.
The layout of this article is the following: In Sect. 2, the catalogue of spectra analysed in this work is presented. Sect. 3 gives a detailed description of the method we used to analyse the spectra. Subsection 3.1 describes, how we determined the gas metallicity, and Subsection 3.2 is dedicated to the determination of the stellar metallicities. The main results are given in Sect. 4 and discussed in Sect. 5. A summary and the main conclusions can be found in Sect. 6.
2 The data base

For this work, we used spectra from the SDSS data release 7, which have a signal-to-noise of per pixel at , but usually much higher, and cover a wavelength range of 3800 to 9200 Å. Most important of all, it contains a large number of galaxy spectra, that is around 900’000.
Any analysis however relies on previous clear criteria to define what
HII galaxies are.
First, we rejected all spectra whose wavelength ranges do not include
the region from 3677 Å to 3775 Å, which is needed to measure the
[OII] 3727 Å emission line strength,
used in many strong line methods to determine the gas metallicity.
This excludes galaxies with redshifts below 0.033.
Another prerequisite for measuring this line strength is a sufficient
signal-to-noise ratio in this wavelength region.
We only kept spectra with .
This criterion guarantees sufficiently low noise for the entire
spectral range used in this work, since at longer wavelengths, the
signal-to-noise ratio of the spectra is higher than around the
[OII] 3727 Å line, i.e. in .
The spectra were then corrected for Galactic (foreground) gas extinction
using the values given in the SDSS database, which were derived from
the Schlegel, Finkbeiner & Davis (1998) reddening maps.
Using these extinction values
and the Galactic extinction law of Fitzpatrick (1999),
we dereddened the spectra.
After that, we deredshifted them, and measured the emission line
strengths.
In order to properly determine the emission line strengths, we first
had to remove the contribution from the absorption lines of the
underlying stellar populations.
This was done by subtracting high resolution spectra representing
the stellar continuum from the empirical spectra as illustrated in
Fig 1.
These high resolution spectra were compiled by fitting the spectra of
composite stellar populations, made up of three single stellar
populations (SSPs), a young ( Myr), an intermediate-age
(20 – 500 Myr), and an old one (5 Gyr), from the “BC03”
integrated spectral energy distribution (ISED) library
to the continua of the galaxy spectra.
The “BC03” library was produced using the Bruzual and Charlot (2003)
Galaxy Isochrone Spectral Synthesis Evolution Library (GISSEL) code
(Charlot & Bruzual A., 1991; Bruzual A. & Charlot, 1993, 2003) implementing the Padova 1995
isochrones (Fagotto et al., 1994; Girardi et al., 1996) combined with the STELIB
(Le Borgne et al., 2003) stellar library.
Since it is made up of empirical high resolution spectra, the “BC03”
library reproduces absorption line shapes well, and is ideal for
this purpose.
Table 1 lists all the lines we measured.
However, incomplete coverage of the stellar parameter space and
calibration uncertainties of the STELIB library result in systematic
errors in the overall spectral shapes.
Therefore the “BC03” library is not a good choice for determining
the properties of the stellar content from a full spectral fit.
For the stellar population synthesis, we perform another fit using
a different library, described in the next section.
| line | central wavelength |
|---|---|
| [OII] 3727 Å | 3727 Å |
| H | 3970 Å |
| H | 4102 Å |
| H | 4340 Å |
| [OIII] 4363 Å | 4363 Å |
| [HeII] 4686 Å | 4686 Å |
| H | 4861 Å |
| [OIII] 4959 Å | 4959 Å |
| [OIII] 5007 Å | 5007 Å |
| [HeI] 5876 Å | 5876 Å |
| [OI] 6300 Å | 6300 Å |
| [SIII] 6312 Å | 6312 Å |
| [NII] 6548 Å | 6548 Å |
| H | 6563 Å |
| [NII] 6584 Å | 6584 Å |
| [SII] 6717 Å | 6717 Å |
| [SII] 6731 Å | 6731 Å |
| [OII] 7319 Å | 7319 Å |
| [OII] 7330 Å | 7330 Å |
Finally, we corrected the spectra for internal gas extinction
using the Calzetti (2001) attenuation law.
The extinction constants
were estimated from the
Balmer decrements following
Calzetti (2001), adopting intrinsic ratios
(Osterbrock, 1989).
The factor of 0.44 stems from the correction
for differential extinction between the stellar
populations and the gas following Calzetti, Kinney & Storchi-Bergmann (1994).
As our sample consists of HII galaxies only, which is a subclass of
starburst galaxies, using this factor is justified.
The emission line strengths were dereddened as well, using the same
values but without multiplying them by 0.44.
To make sure our sample contains only HII galaxies, we limited it to galaxies with strong emission lines at a high excitation level, by applying the two criteria:
| (1) |
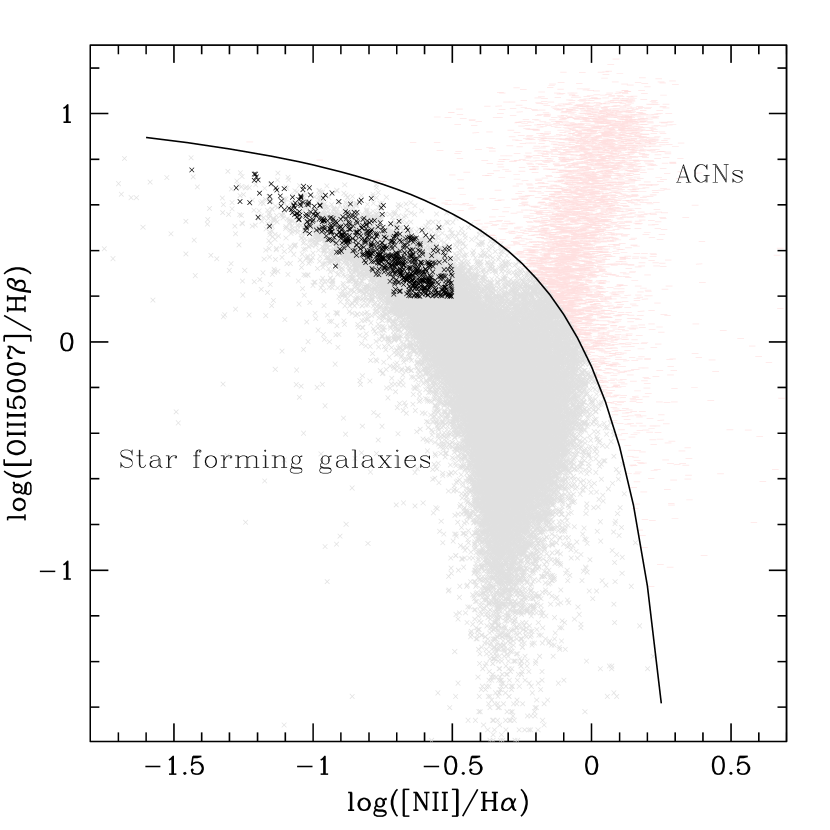
whereas [NII] = [NII] 6548 Å + [NII] 6584 Å. Of course, these criteria are more restrictive than the traditional definition of HII galaxies as galaxies showing strong Balmer lines. In fact, as our criteria are designed to identify galaxies with gas at a high excitation level, our sample is biaised towards extreme case HII galaxies. As a consequence, we expect the galaxies of our sample to show typical properties of HII galaxies, but at a more pronounced level. For example, it consists of HII galaxies with low mass-to-light ratios and thus contains mainly dwarf galaxies. The reason for this approach, apart from emphasising on typical HII galaxy properties, is, to make sure that no “contaminating” objects, such as LINERs, enter the sample. Then, we separated the star forming galaxies from AGNs, using the Kewley et al. (2001) excitation line criterion,
| (2) |
as shown in Fig. 2.
Our final sample contains 712 HII galaxy spectra.
The relatively low number of galaxies compared to the total number
of over 900’000 galaxies in the SDSS data release 7 is due to our high
requirements towards the quality of the spectra, and to the criterion
that the spectra must contain all the lines necessary for our study.
This way, we guarantee that the sample is not contaminated, and that
the obtained results are trustworthy.
However, the sample is large enough to be statistically significant.
We also defined a test sample, containing galaxies with some line emission, but not necessarily at a high level, that is H, H, [OII] 3727 Å, [OIII] 4959 Å, [OIII] 5007 Å, . The reason for defining a test sample is, on the one hand, to identify properties typical of HII galaxies through comparison with the test sample, and, on the other hand, to check our method, by comparing the results for our test sample with the ones obtained in other studies using similar galaxy samples. As we needed to measure the [OII] 3727 Å line strength for the test sample as well, it is also limited to galaxies with redshift . To guarantee sufficient quality, we applied the signal-to-noise criterion , where the values were taken from the SDSS database. Here too, we removed the AGNs using the Kewley et al. (2001) criterion. This way, our test sample contains 74989 spectra. Given the criterion that the test sample galaxies show some line emission, it consists of star forming galaxies, probably mostly spirals.
3 Method
3.1 Determination of the gas metallicities

We first measured the gas metallicity, which corresponds to the
metallicity of the young stellar populations.
In order to derive gas abundances from its line emission, hydrogen
lines are needed, and the lines of at least one ion, generally oxygen,
in its two dominant ionisation stages.
Unfortunately, the electron temperature method using the
[OIII] 4363 Å emission line could not be used as this line
and other auroral lines are much too weak to be measured with
the necessary precision at the signal-to-noise ratios of the SDSS spectra.
In most spectra, we do not even detect the
[OIII] 4363 Å line at all.
Hence, we are restricted to strong line methods.
The [OII] 7330 Å line could be used, but it is too sensitive
to the electron temperature and is possibly “contaminated” by
recombination contributions.
We compare the gas metallicities derived from 11 different
strong line methods.
A frequently used indicator is the [NII] 6548 Å or the
[NII] 6584 Å line (Denicoló et al., 2002; Pettini & Pagel, 2004).
However, since nitrogen is produced and destroyed during both
primary and secondary nucleosynthesis, its abundance correlates
in a non-evident way on (oxygen) metallicity.
Therefore, it should be used only for rough estimates, to discriminate
between the different branches of a multiple-valued method,
for instance.
One such multiple-valued indicator is the parameter (Pagel et al., 1979),
which sums up the fluxes of the [OII] 3727 Å and two strong
[OIII] lines, at 4959 Å and 5007 Å.
As is aproximately proportional to the oxygen abundance at
low metallicities, but decreases at high metallicities due to
cooling, this indicator has a low - and a high metallicity branch.
In spite of this double-valuedness, the parameter is used in many
metallicity calibrations
(McGaugh, 1991; Zaritsky et al., 1994; Pilyugin, 2001a, b; Kewley & Dopita, 2002; Kobulnicky & Kewley, 2004; Pilyugin & Thuan, 2005),
some of which include a recipe, how to determine, on which branch
a given galaxy lies, whereas others leave it up to the user to
decide this.
In one case, Zaritsky et al. (1994), a calibration is determined only for
the high metallicity branch.
Another point that has to be taken into account (although in some methods
this is ignored, i.e. Zaritsky et al., 1994) is, that depends not only
on the metallicity of the ionised gas, but also on the hardness of the
ionising radiation, which can be
quantified by the ionisation parameter , representing the
ionising photon flux per unit area divided by the number density of
hydrogen atoms.
Kewley & Dopita (2002, “new paramatrisation” and “best estimate” methos); Kobulnicky & Kewley (2004, “new paramatrisation” and “best estimate” methos) use the [OIII]/[OII] ratio to
calculate in an iterative way from theory, and then determine
[O/H] from and ,
whereas McGaugh (1991) uses the [OIII]/[OII] ratio directly in an
empirical calibration without determining .
In Pilyugin (2001a, b); Pilyugin & Thuan (2005), the so-called
excitation or ionisation or, simply, P parameter is introduced
for their empirical calibrations.
It is defined as the [OIII]/([OII]+[OIII]) ratio, so the
[OIII]/[OII] ratio is related to it, .
Recapitulating, in all of these methods the gas metallicity is
calculated from the parameter and the [OIII]/[OII] ratio.
Other strong line methods include Kobulnicky & Kewley (2004, [NII] method),
combining the [NII] 6584 Å line and the [OIII]/[OII] ratio,
and Pettini & Pagel (2004), employing the ratio between the
[OIII] 5007 Å and [NII] 6584 Å lines.
Fig. 3 shows the metallicities of our HII galaxy
sample as determined by nine of the methods we studied, plotted
against the ones using by the tenth method, Pilyugin & Thuan (2005),
which is the one we ended up adopting.
The only calibration not shown here due to space limitations is
the Pettini & Pagel (2004) [NII] one, which is a vertically squeezed
and shifted downward version of the Denicoló et al. (2002) calibration
(first panel).
Most methods yield similar relative metallicities, that is, the methods
agree upon the metallicity differences between galaxies.
However, when it comes to absolute [O/H] values, systematic differences
of up to 0.5 dex between methods can be observed.
All methods apart from Pilyugin (2001a, b, axis); Pilyugin & Thuan (2005, axis)
result in unrealistically high gas metallicities for HII galaxies.
Especially the Kewley & Dopita (2002); Kobulnicky & Kewley (2004) ones
hardly ever give metallicities below -0.5.
On top of that, the
Kewley & Dopita (2002, [NII] and “new paramatrisation”); Kobulnicky & Kewley (2004, [NII] and “new paramatrisation”)
methods did not always converge.
The horizontal lines in the Kewley & Dopita (2002) panel are due to some
cases, in which the expression
gave complex values.
In these cases, we used only the real part, , which
results in identical metallicity values for galaxies within the same
ionisation parameter range.
When ignoring these galaxies, we obtain a similar relation as for
the Kobulnicky & Kewley (2004) “new paramatrisation of the
Kewley & Dopita (2002)” method.
The method that yields the most realistic metallicities for the
galaxies of our sample is the one by Pilyugin & Thuan (2005).
It also accounts for the hardness of the ionising radiation by means
of the P parameter.
Therefore, we adopted it for our gas metallicity determination.
To determine, on which branch a given galaxy lies, we used the
metallicity estimate based on the
ratio by
Denicoló, Terlevich & Terlevich (2002), as suggested by various authors
(Pérez-Montero & Díaz, 2005; Hoyos et al., 2007, and others).
Most galaxies of our sample lie on the high-metallicity branch.
López-Sánchez & Esteban (2010) come to the same conclusion after comparing
a series of empirical methods, like the ones presented in this section,
with the results of the electron temperature method for a sample
of 31 Wolf-Rayet galaxies.
They conclude, that the nowadays best suitable method for star-forming
galaxies, where auroral lines such as [OIII] 4363 Å are not observed,
is Pilyugin & Thuan (2005), and that other methods based on
photionisation models yield metallicities systematically 0.2-0.3 dex higher
and higher dispersion than the Pilyugin & Thuan (2005) calibration.
3.2 Determination of the stellar metallicities
Then, we determined the metallicity of the stellar content,
that is, of the stellar populations making up the galaxies,
using a population synthesis method, described in
Cuisinier et al. (2006) and Lisker et al. (2006), based on the full spectral
fitting in the 3820-8570 Å range whereas the upper limit can be
lower than 8570 Å (in some rare cases as low as 7200 Å), where the
deredshifted SDSS spectra do not extend up to this value.
As opposed to the method used for the determination of the line
intensities, for this population synthesis we used SSP
spectra from the so-called “BC99” SSP library
(Westera et al., 2004; Cuisinier et al., 2006; Lisker et al., 2006).
It was produced using the GISSEL code,
implementing the Padova 2000 isochrones
(Girardi et al., 2000) combined with the BaSeL 3.1
“Padova 2000” stellar library (Westera et al., 2002; Westera, 2001).
The BaSeL 3.1 library was calibrated to reproduce the spectral shapes
of stars of metallicities [Fe/H] from -2 to 0, so it is the ideal
choice for full spectral fitting.
By contrast, the “BC03” library described in the previous section
would not have been a good choice,
for the reasons mentioned there.
As the GISSEL spectra do not include nebular continuum emission,
we added it to the spectra, in the same way as described in
Westera et al. (2004); Cuisinier et al. (2006); Lisker et al. (2006).
In Westera et al. (2004), we found that the stellar content of
HII galaxies is made up of at least three populations,
a young one (up to 10 Myr old) that is responsible for the
ionisation of the gas and, therefore, for the nebular emission,
an intermediate one (from 20 to 500 Myr), and an old one
(at least 1 Gyr old).
We showed that these three populations are necessary – and sufficient –
to characterise an HII galaxy, which is now the current view
(Hoyos et al., 2007).
Therefore, in this work
we modelled the actual population as being composed of an old, an
intermediate, and a young stellar population.
In a full spectral fit, we determined the masses, ages and
metallicities of these partial populations.
To obtain meaningful results, we chose to reduce the number
of fitting parameters (and thus, of degeneracies) to a minimum.
As the young population should be more or less coeval with the gas,
whose metallicity is the one attained now by these galaxies, we
assumed the young and intermediate populations to have the same
chemical composition as the gas.
As the gas metallicities we measured are in terms of [O/H],
whereas our stellar population library was calibrated in [Fe/H],
we still had to translate the oxygen - into iron abundances,
since the element ratios in HII galaxies are far from solar.
Oxygen is released by stellar winds and by SNe I and II,
whereas iron and other iron peak elements are only produced in
SNeIa, which appear only around 1 Gyr after the formation of a
stellar population.
Therefore, the ratio between the abundances of these two elements
in a galaxy depends on its entire star formation history.
Adding to this the possibility of “selective mass loss”,
as is predicted by the models mentioned in the introduction,
it would be illusory to expect a unique iron-to-oxygen ratio for
the galaxies of our sample.
However, as our sample is very homogeneous, we do expect there
to exist a mean relation and only a moderate scatter around this
relation.
Unfortunately, transformations between the two metallicity
indicators for HII galaxies are rare in the literature.
In earlier abundance studies of this type of galaxies,
such as Kniazev et al. (2004) and Izotov et al. (2006), the iron abundance
is not determined, as they are also based on emission lines
in SDSS spectra.
On the other hand, most theoretical transformations, like the ones
determined for the Milky Way bulge and the solar neighbourhood by
Matteucci et al. (1999), are not valid for HII galaxies.
Finally, we derived the [O/Fe] to [Fe/H] relation from the one
for irregular galaxies from Calura et al. (2009), who calculated the
element ratios of galaxies of different morphological types using
chemical evolution models.
According to their fig. 13, the [O/Fe] to [Fe/H] relation for
irregular galaxies is around
independent of redshift, which translates to
.
Hence, we fixed the metallicities of the young and intermediate
populations, [Fe/H]y and [Fe/H]i, to
| (3) |
For the galaxies of our sample, most of which have [O/H]P values in the range from -1 to -0.5, we obtain [O/Fe] ratios between -0.2 and -0.4. As opposed to the metallicity of the young and intermediate populations, the metallicity of the old population, [Fe/H]o, is a free parameter of our fitting procedure, limited to the metallicities of the spectra of the “BC99” SSP library, -2.252 -1.65, -1.25, -0.65, -0.35, 0.027, and 0.225. Contrary to our approach in previous works, we did not force the metallicities of the old populations to be lower than the ones of the younger stars, since one of the aims of this work is to verify if they really are.
As the decomposition of galaxy spectra into SSP spectra is known to present various degeneracies, we verified if our fitting procedure is able to recover the population parameters of synthetic composite spectra made up of three SSPs with noise added. We found that the masses, ages, and metallicities of the input populations were properly recovered for the signal-to-noise ratios of both our HII galaxy sample and our test sample ( resp. 5 in the band), and conclude that the number of free parameters of our procedure is adequate and that the results presented in the following can be trusted to be meaningful.
In order to determine the total stellar masses of our galaxies, we had to know their luminosity distances , and their (stellar) mass-to-light ratios. We calculated the former from the redshifts given by the SDSS, using a cosmology of , , and . The stellar mass-to-light ratios result from our best fits.
4 Results
The strengths of the emission lines used for this analysis, as well as the internal reddening values , the gas metallicities [O/H]P and the total stellar masses , can be found in Table 2 of the electronic version of this paper.
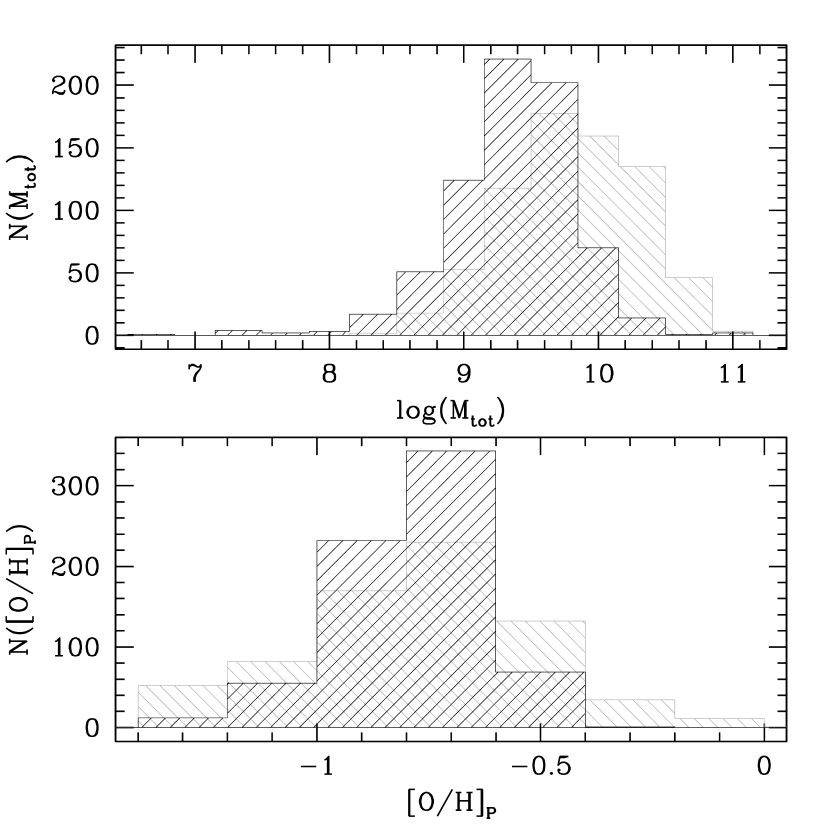
Fig. 4 shows the stellar mass and gas metallicity
distributions of our sample (in black) and the test sample (in grey).
The average of the logarithms of the stellar masses (in )
amounts to 9.4 and the average gas metallicity to -0.79,
whereas those values are 9.8 resp. -0.78 for the test sample.
As expected, the galaxies of the HII galaxy sample have, on average,
lower masses than the ones of the test sample.
Since our sample contains very few galaxies with stellar masses
below or above
(The mass bins at , ,
, , ;
, ,
, ,
and contain 1, 0, 4, 2, 3; 1, 2, 0, 0
and 0 galaxies, resp.),
statistical studies of galaxies in these mass ranges suffer from
low number statistics.
In the following we will only consider the range
from to when studying
galaxy properties as a function of mass.
In Figs. 7 and 8, this mass range is delimited
by dotted lines.
For the test sample, the mass range
from to could be used
for such studies, as each mass bin contains over 150 galaxies.
The average gas metallicities are nearly the same for both samples,
but the distribution is narrower for the HII galaxies, indicating that
this is a more homegeneous sample.
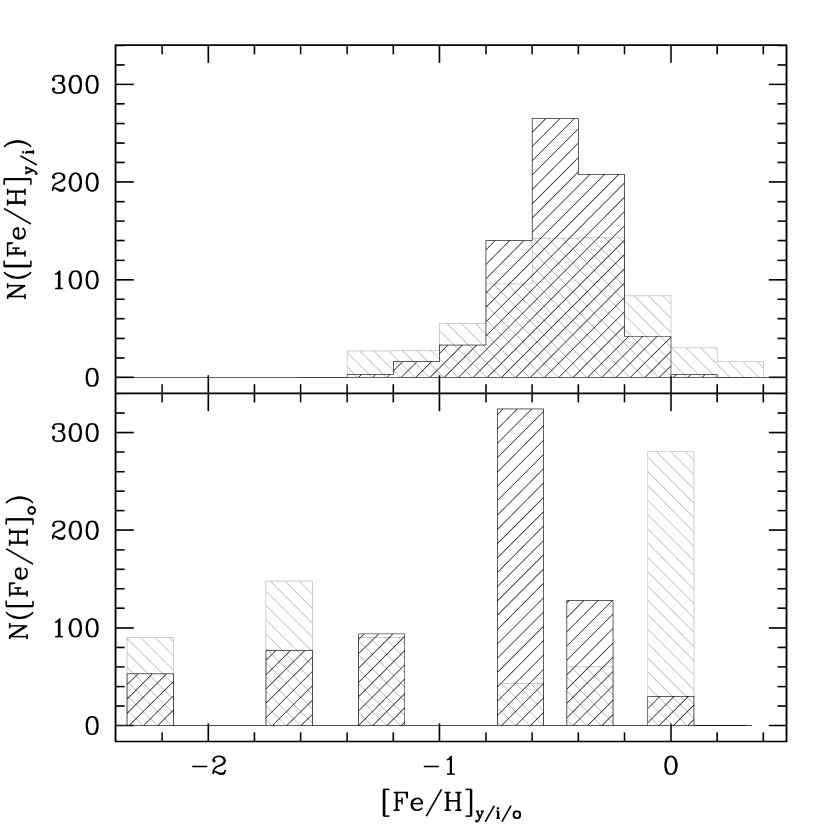
Fig. 5 shows the metallicity distributions of the partial populations. As we fixed in the fitting procedure, we show in the upper panel the metallicity of the joint young and intermediate age population. The average metallicity of the joint young and intermediate populations is -0.49, and of the old one -0.87 (test sample: -0.49, and -0.84). Here too, the distributions are narrower for the more homegeneous HII galaxies sample. Nevertheless, the spread in is wide. As is a measure of the average metallicity of all populations older than Gyr, this wide spread reflects the various stages of (metallicity) evolution of the galaxies of our sample around one Gyr ago.
5 Discussion
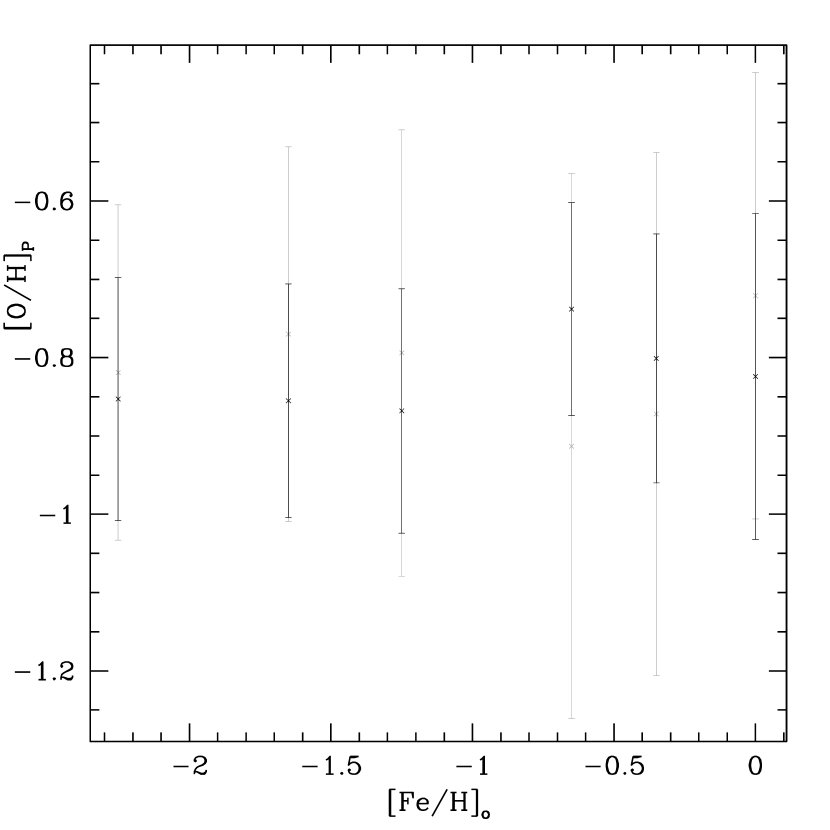
In Fig. 6, we show the gas metallicity in function of the metallicity of the old population, both for the HII galaxies and for the test sample. In either sample, not much of a relation can be seen, any possible trend being significantly smaller than the scatter. Apparently, the stage of a galaxy’s evolution around one Gyr ago is not necessarily reflected in the present day one. The chemical evolution and the present day (gas) metallicities of galaxies suffer stronger influences from other factors, such as the galaxy mass.
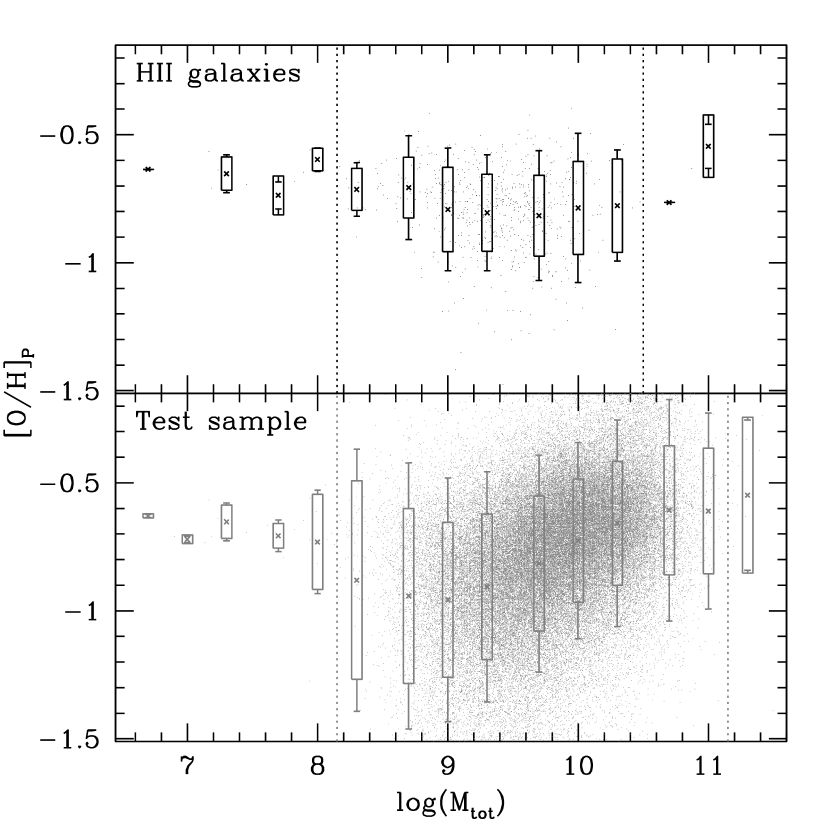
Fig. 7 shows, how the present gas metallicity [O/H]P depends on the total stellar galaxy mass. In the test sample, [O/H]P clearly increases with mass in the range from to , as has been found in previous studies (Tremonti et al., 2004; Asari et al., 2007; Thomas et al., 2005; Panter et al., 2008, and others). However, our mass-metallicity relation lies lower than the ones found in these works, as recent studies (Ellison et al., 2008; Mannucci et al., 2010) suggest to be the case for samples of star forming galaxies, such as our test sample.
The HII galaxy sample represents galaxies of a more homogeneous
class than the test sample.
Therefore, in this sample, the mass-metallicity relation is
much less pronounced, if existing at all.
In fact, the average gas metallicity stays constant
between -0.7 and -0.8
in the full galaxy mass range from
to .
Panter et al. (2008) find almost the same relation for their sub-sample
of galaxies that are (flux-)dominated by young populations
( Gyr), as can be seen in their fig. 10.
In a “closed box” context, this would mean that the gas fraction
that has been transformed into stars so far is in the same range for
all galaxies of the HII galaxy sample, independent of their masses.
However, HII galaxies are not “closed boxes”, and our results
should be interpreted in the light of models including interaction
processes with the environment, like the ones presented in the
introduction.
Most of these models predict that HII galaxies lose a large fraction
of their heavy elements through galactic winds, whose escape
efficiencies depend upon the galaxy mass.
These models are at odds with our result for two reasons:
They result in a dependence of the metallicity on the galaxy mass,
and their predicted present day metallicities are lower than
the ones we measure.
The Recchi et al. (2006); Recchi & Hensler (2007) models with constantly
infalling clouds appear more promising, especially the models
NGC-4+BC of Recchi et al. (2006) and NCSM of Recchi & Hensler (2007).
The clouds partially retain the metal-rich gas, resulting in higher
present-day metallicities.
Depending on the star formation history and on the mass of the infalling
clouds, galaxies like the ones described in these models can reach
the metallicities we measure.
On top of that, this scenario provides a possible explanation, why we
find metallicities in the same ranges for different stellar masses.
Not only the SFR and, therefore, the amount of produced metals and
galactic wind increases with increasing galaxy mass, but also the
amount of infalling low-metallicity clouds and of retained outflowing
high-metallicity gas.
Of course, only detailed model calculations can tell, if the mass
dependencies of the different metallicity-increasing and -decreasing
processes really add up in such a way, that the final metallicity
becomes mass independent.
The fact, that a constant mass-metallicity relation is observed only
in our HII galaxy sample, and not, for example, in our test sample,
or in any of the studies mentioned at the beginning of this section,
shows that only in galaxies with extreme star formation, and thus
extreme stellar winds, the metal outflow manages to balance the
retention in this way.
However, the models including infalling clouds seem to be on the right
track.
Another noteworthy point of Fig. 7 is that, though the
average gas metallicity [O/H]P does not vary with the galaxy mass,
its dispersion does increase with galactic mass.
This indicates that high mass galaxies have a more complex chemical,
and certainly assembly, history.
Apart from the present-day metallicity, our analysis also allows us
to quantify the chemical evolution of our sample galaxies
since the formation of the old population.
As the metallicity of the young (and intermediate) population represents
the galaxy’s present-day metallicity, and the one of the old population
is a measure of the average metallicity of all stars older than
Gyr, the quantity ,
which we shall call the metal enrichment, is a good measure of the
change in metallicity during the last few Gyr.
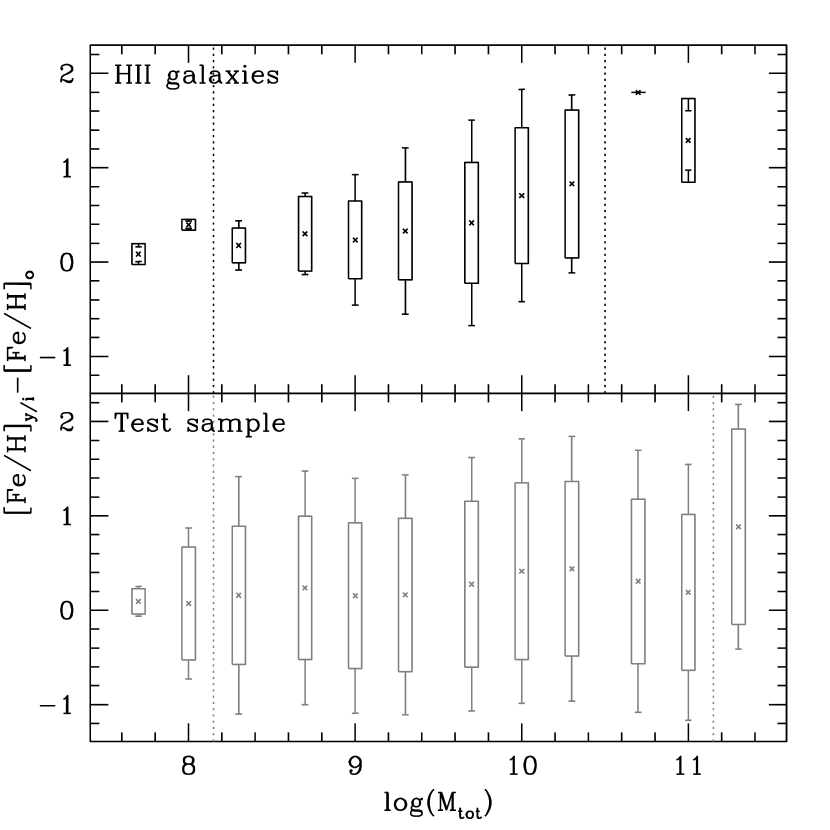
Fig. 8 shows the metal enrichment in function of the
stellar mass
for the galaxies in both our HII galaxies sample and the test sample.
For our HII galaxies, the enrichment is fairly constant
of the order of 0.3 up to ,
and almost 0.5 dex higher for the last two mass bins within the
mass range, where reliable statistics are possible,
and .
This suggests that the enrichment mechanism are independent
of mass up to , which is compatible with the
formation scenario favoured in the previous paragraph.
For galaxy masses above , the enrichment
is significantly higher, which means that at high masses, the
metal-rich gas could not escape the galaxy’s potential well,
as predicted in the MacLow & Ferrara (1999) models.
Here too, the dispersion increases with galaxy mass, confirming
more complex chemical and assembly histories for high mass galaxies.
An interesting point is that we find a negative metal enrichment,
thus a metal reduction, for 164 galaxies, that is, 23 per cent of our sample.
Two mechanisms are known to reduce the (gas) metallicity of a galaxy:
Selective outflow of metal-enriched gas and infall of low-metallicity
gas clouds, maybe even of primordial composition.
Both processes might have contributed to the metal reduction of our
galaxies, but in the light of our previous results, we expect the
second one to be more important on long time-scales.
It is intriguing that in the test sample, too, we find the metal enrichment to be mass independent, even though the final metallicity increases with galaxy mass. amounts to around 0.36 in the full range from to . Even the dispersion is fairly constant over this mass range. Apparently, enrichment mechanisms are similar for galaxies of different masses even in a heterogeneous sample like our test sample. Around 44 per cent of the test sample galaxies, 33178 in total, show negative metal enrichment, which proves that processes like selective outflow or low metallicity gas infall are also at play in these galaxies.
6 Conclusions
We performed a gas - and stellar population analysis of HII galaxies
from the Sloan Digital Sky Survey Data Release 7, using their full
spectra.
We selected a sample which contains 712 HII galaxy spectra,
a relatively low number due to our high requirements
towards the quality of the spectra and to the criterion that the
spectra contain all the spectral lines necessary for our study.
We also selected a test sample of 74989 galaxies, using less
restrictive requirements, the only criterion being that they show
some line emission.
Therewith, it is a sample of star forming galaxies.
We derived independent metallicities for the young populations
present in our sample galaxies from the gas emission lines,
and for the old populations from full spectra fitting, that is,
from the continuum and absorption features from stars.
Our test sample follows the well-known mass-metallicity relation, e.g. the fact that the (gas) metallicity increases with (stellar) galaxy mass, indicating that low mass galaxies are chemically less evolved than high mass galaxies. We do not find any systematical tendency of the difference between the metallicities of the young and the old stellar populations, a quantity we call metallicity enrichment, with galactic mass, indicating that, on average, recycling mechanisms of the interstellar medium should be the same for low - and high mass galaxies.
In our HII galaxy sample, on the other hand, we find no mass dependence of the present day metallicity. For the metallicity enrichment, we find no mass dependence for masses up to , whereas above this mass, the enrichment is significantly higher.
We interpret these findings in the light of recent hydrodynamical evolutionary models of dwarf irregular galaxies, of which HII galaxies are a sub-class. We favour models featuring constantly infalling low-metallicity clouds able to retain part of the high metallicity galactic winds, such as the models NGC-4+BC from Recchi et al. (2006) and NCSM from Recchi & Hensler (2007), since models without infalling clouds fail to predict the metallicities and the non-dependence on galaxy mass of our sample galaxies. For galaxies with masses above , most, if not all, of the metal-rich gas is retained by the galaxy’s gravitational potential, as predicted by MacLow & Ferrara (1999), which leads to the observed break-down of the constant mass-enrichment relation.
However, the dispersion of both the present day metallicity and the
metallicity enrichment does increase with galactic mass,
indicating more complex chemical and assembly histories for high mass
HII galaxies.
In 23 per cent of our HII galaxies, the metallicity has decreased in the
last few Gyr.
We attribute the metallicity decrease mainly to the dilution of
the galactic gas by the infalling clouds, which is compatible with
the models we favour.
Acknowledgments
We would like to thank the Fundação Carlos Chagas Filho de Amparo à Pesquisa do Estado do Rio de Janeiro (FAPERJ) and the PCI programme of ON/MCT (DTI/CNPq) for financial support. We would like to thank as well Eduardo Telles and Helio Rocha-Pinto for fruitful discussions. Finally, the authors acknowledge support by the Swiss National Science Foundation.
References
- Asari et al. (2007) Asari N.V., Cid Fernandes R., Stasińska G., Torres-Papaqui J.P., Mateus A., Sodré L., Schoenell W., Gomes, J.M., 2007, MNRAS, 381, 263
- Abazajian et al. (2009) Abazajian K.N. et al., 2009, ApJS, 182, 543
- Baldwin et al. (1981) Baldwin J.A., Phillips M.M., Terlevich R., 1981, PASP, 93, 5
- Bruzual A. & Charlot (1993) Bruzual A. G., Charlot S., 1993, ApJ, 405, 538
- Bruzual A. & Charlot (2003) Bruzual A. G., Charlot S., 2003, MNRAS, 344, 1000
- Calura et al. (2009) Calura F., Pipino A., Chiappini C., Matteucci F., Maiolino R., 2009, A&A, 504, 373
- Calzetti (2001) Calzetti D., 2001, PASP, 113, 1449
- Calzetti et al. (1994) Calzetti D., Kinney A.L., Storchi-Bergmann T., 1994, ApJ, 429, 582
- Charlot & Bruzual A. (1991) Charlot S., Bruzual A. G., 1991, ApJ, 367, 126
- Cid Fernandes et al. (2003) Cid Fernandes R., Leão J.R.S., Lacerda R.R., 2003, MNRAS, 340, 29
- Cid Fernandes et al. (2007) Cid Fernandes R., Asari N.V., Sodré Jr. L., Stasińska G., Mateus A., Torres-Papaqui J.P., Schoenell W., 2007, MNRAS, 375, L16
- Cuisinier et al. (2006) Cuisinier F., Westera P., Telles E., Buser R., 2006, A&A, 423, 133
- Denicoló et al. (2002) Denicoló G., Terlevich R., Terlevich E., 2002, MNRAS, 329, 315
- Ellison et al. (2008) Ellison S.L., Patton D.R., Simard L., McConnachie A.W., 2008, ApJ, 672, L107
- Fagotto et al. (1994) Fagotto F., Bressan A., Bertelli G., Chiosi C., 1994, A&AS, 105, 39
- Fitzpatrick (1999) Fitzpatrick E.L., 1999, PASP, 111, 63
- French (1980) French H.B., 1980, ApJ, 240, 41
- Girardi et al. (1996) Girardi L., Bressan A., Chiosi C., Bertelli G., Nasi E., 1996, A&AS, 117, 113
- Girardi et al. (2000) Girardi L., Bressan A., Bertelli G., Chiosi C., 2000, A&AS, 141, 371 (“Padova 2000” isochrones)
- Hägele et al. (2008) Hägele G.F., Díaz A.I., Terlevich E., Terlevich R., Pérez-Montero E., Cardaci M.V., 2008, MNRAS, 383, 209
- Hoyos et al. (2007) Hoyos C., Guzmán R., Díaz A.I., Koo D.C., Bershady M.A., 2007, AJ, 134, 2455
- Izotov et al. (2006) Izotov Y.I., Stasińska G., Meynet G., Guseva N.G., Thuan T.X., 2006, A&A, 448, 955
- Kehrig et al. (2004) Kehrig C., Telles E., Cuisinier F., 2004, AJ, 128, 1141
- Kehrig et al. (2006) Kehrig C., Vílchez J.M., Telles E., Cuisinier F., Pérez-Montero E., 2006, A&A, 457, 477
- Kewley et al. (2001) Kewley L.J., Dopita M.A., Sutherland R.S., Heisler C.A., Trevena J., 2001, ApJ, 556, 121
- Kewley & Dopita (2002) Kewley L.J., Dopita M.A., 2002, ApJS, 142, 35
- Kniazev et al. (2004) Kniazev A.Y., Pustilnik S.A., Grebel E.K., Lee H., Pramskij A.G., 2004, ApJS, 153, 429
- Kong et al. (2003) Kong X., Charlot S., Weiss A., Cheng F., 2003, A&A, 403, 877
- Kobulnicky & Kewley (2004) Kobulnicky H.A., Kewley L.J., 2004, ApJ, 617, 240
- Le Borgne et al. (2003) Le Borgne J.-F. et al., 2003, A&A, 402, 433
- Lequeux et al. (1979) Lequeux J., Peimbert M., Rayo J.F., Serrano A., Torres-Peimbert S., 1979, A&A, 80, 155
- Lisker et al. (2006) Lisker T. , Glatt K. , Westera P., Grebel E.K., 2006, AJ, 132, 2432
- López-Sánchez & Esteban (2010) López-Sánchez Á.R., Esteban C., 2010, A&A, 517, A85
- MacLow & Ferrara (1999) MacLow M.-M., Ferrara A., 1999, ApJ, 513, 142
- Mannucci et al. (2010) Mannucci F., Cresci G., Maiolino R., Marconi A., Gnerucci A., 2010, MNRAS, 408, 2115
- Matteucci et al. (1999) Matteucci F., Romano D., Molaro P., 1999, A&A, 341, 458
- McGaugh (1991) McGaugh S.S., 1991, ApJ, 380, 140
- Osterbrock (1989) Osterbrock D.E., 1989, Astrophysics of Gaseous Nebulae and Active Galactic Nuclei (Mill Valley: University Science Books)
- Pagel et al. (1979) Pagel B.E.J., Edmunds M.G., Blackwell D.E., Chun M.S., Smith G., 1979, MNRAS, 189, 95
- Panter et al. (2008) Panter B., Jimenez R., Heavens A.F., Charlo, S., 2008, MNRAS, 391, 1117
- Pérez-Montero & Díaz (2003) Pérez-Montero E., Díaz A.I., 2003, MNRAS, 346, 105
- Pérez-Montero & Díaz (2005) Pérez-Montero E., Díaz A.I., 2005, MNRAS, 361, 1063
- Pérez-Montero et al. (2010) Pérez-Montero E., García-Benito R., Hägele G.F., Díaz A.I., 2010, MNRAS, 404, 2037
- Pettini & Pagel (2004) Pettini M., Pagel B.E.J., 2004, MNRAS, 348, 59
- Pilyugin (2001a) Pilyugin L.S., 2001a, A&A, 369, 594
- Pilyugin (2001b) Pilyugin L.S., 2001b, A&A, 374, 412
- Pilyugin & Thuan (2005) Pilyugin L.S., Thuan T.X., 2005, ApJ, 631, 231
- Raimann et al. (2000) Raimann D., Bica E., Storchi-Bergmann T., Melnick J., Schmitt H., 2000, MNRAS, 314, 295
- Recchi & Hensler (2007) Recchi S., Hensler G., 2007, A&A, 476, 841
- Recchi et al. (2001) Recchi S., Matteucci F., D’Ercole A., 2001, MNRAS, 322, 800
- Recchi et al. (2002) Recchi S., Matteucci F., D’Ercole A., Tosi M., 2002, A&A, 384, 799
- Recchi et al. (2004) Recchi S., Matteucci F., D’Ercole A., Tosi M., 2004, A&A, 426, 37
- Recchi et al. (2006) Recchi S., Hensler G., Angeretti L., Matteucci F., 2006, A&A, 445, 875
- Sargent & Searle (1970) Sargent W.L.W., Searle L., 1970, ApJ, 162, L155
- Schlegel et al. (1998) Schlegel D.J., Finkbeiner D.P., Davis M., 1998, ApJ, 500, 525
- Searle et al. (1973) Searle L., Sargent W.L.W., Bagnuolo W.G., 1973, AJ, 179, 427
- Tenorio-Tagle et al. (2006) Tenorio-Tagle G., Muñoz-Tuñón C., Pérez E., Silich S., Telles E., 2006, ApJ, 643, 186
- Terlevich et al. (1991) Terlevich R., Melnick J., Masegosa J., Moles M., Copetti M.V.F., 1991, A&AS, 91, 285
- Thomas et al. (2005) Thomas D., Maraston C., Bender R., Mendes de Oliveira C., 2005, ApJ, 621, 673
- Tremonti et al. (2004) Tremonti C.A. et al., 2004, ApJ, 613, 898
- Vílchez & Iglesias-Páramo (2003) Vílchez J.M., Iglesias-Páramo J., 2003, ApJS, 145, 225
- Westera (2001) Westera P., 2001, The BaSeL 3.1 models: Metallicity calibration of a theoretical stellar spectral library and its application to chemo-dynamical galaxy models, PhD thesis, Univ. of Basel, 378 pp.
- Westera et al. (2002) Westera P., Lejeune T., Buser R., Cuisinier F., Bruzual A. G., 2002, A&A, 381, 524
- Westera et al. (2004) Westera P., Cuisinier F., Telles E., Kehrig C., 2004, A&A, 423, 133
- York et al. (2000) York D.G. et al., 2000, AJ, 120, 1579
- Zaritsky et al. (1994) Zaritsky D., Kennicutt R.C.Jr., Huchra J.P., 1994, ApJ, 420, 87
Appendix A population parameters of individual spectra
| SDSS spectroscopic ID | H | [OII]∗∗ | [OIII]∗∗ | [OIII]∗∗ | [NII]∗∗ | [NII]∗∗ | [O/H]P | ||||
|---|---|---|---|---|---|---|---|---|---|---|---|
| MJD-plate-fiber | 4861 Å | 6563 Å | 3727 Å | 3727 Å | 4959 Å | 5007 Å | 6548 Å | 6584 Å | [] | ||
| 51637-0306-583 | 5.102 | 3.010 | 5.848 | 2.948 | 0.728 | 2.088 | 0.148 | 0.472 | 0.088 | -1.022 | 0.63 |
| 51658-0282-047 | 10.075 | 3.103 | 5.644 | 2.806 | 0.694 | 2.049 | 0.143 | 0.457 | 0.145 | -0.991 | 1.93 |
| 51662-0308-628 | 10.264 | 3.017 | 4.800 | 4.074 | 0.669 | 2.049 | 0.158 | 0.571 | 0.093 | -0.860 | 2.11 |
| 51663-0307-268 | 14.076 | 3.052 | 4.270 | 3.005 | 1.009 | 3.078 | 0.176 | 0.574 | 0.114 | -0.794 | 3.27 |
| 51671-0299-571 | 8.794 | 3.179 | 6.656 | 2.846 | 0.615 | 2.199 | 0.203 | 0.626 | 0.189 | -1.142 | 6.78 |
| 51691-0350-439 | 24.324 | 3.105 | 3.533 | 3.102 | 0.550 | 1.696 | 0.212 | 0.644 | 0.146 | -0.654 | 1.98 |
| 51692-0339-437 | 11.115 | 2.921 | 2.707 | 4.272 | 1.238 | 3.741 | 0.074 | 0.223 | 0.033 | -0.599 | 0.34 |
| 51783-0395-570 | 9.257 | 2.924 | 3.362 | 4.199 | 0.639 | 1.975 | 0.118 | 0.374 | 0.034 | -0.624 | 0.98 |
| 51812-0404-507 | 9.680 | 3.042 | 4.195 | 3.339 | 0.641 | 1.964 | 0.144 | 0.490 | 0.108 | -0.763 | 4.10 |
| 51818-0383-266 | 8.743 | 2.944 | 3.631 | 3.398 | 0.899 | 2.789 | 0.097 | 0.303 | 0.047 | -0.687 | 0.87 |
given in units of 1015 erg/s/cm2
∗∗flux ratios given in