Understanding mobility in a social petri dish
Abstract
Despite the recent availability of large data sets on human movements, a full understanding of the rules governing motion within social systems is still missing, due to incomplete information on the socio-economic factors and to often limited spatio-temporal resolutions. Here we study an entire society of individuals, the players of an online-game, with complete information on their movements in a network-shaped universe and on their social and economic interactions. Such a “socio-economic laboratory” allows to unveil the intricate interplay of spatial constraints, social and economic factors, and patterns of mobility. We find that the motion of individuals is not only constrained by physical distances, but also strongly shaped by the presence of socio-economic areas. These regions can be recovered perfectly by community detection methods solely based on the measured human dynamics. Moreover, we uncover that long-term memory in the time-order of visited locations is the essential ingredient for modeling the trajectories.
Understanding the statistical patterns of human mobility, predicting trajectories and uncovering the mechanisms behind human movements barthelemy2010sn is a considerable challenge with important practical applications to traffic management guimera2005wan ; helbing2001trs , planning of urban spaces makse1995mug ; roth2010cpc , epidemics pastor2001ess ; colizza2006rat ; hufnagel2004fce ; balcan2009mmn , information spreading miritello2011dss ; onnela2007sts , and geo-marketing quercia2010rse ; jensen2006npr . In the last years, advanced digital technologies have provided huge amounts of data on human activities, allowing to extract information on human movements. For instance, observations of banknote circulation brockmann2006slh ; thiemann2010sbs , mobile phone records gonzalez2008uih , online location-based social networks scellato2011ssp ; scellato2011nps , GPS location data of vehicles bazzani2010slu , or radio frequency identification traces barthelemy2010sn ; cattuto2010dpi ; roth2010cpc , have all been used as proxies for human movements. These studies have provided valuable insights into several aspects of human mobility, uncovering distinct features of human travel behaviour such as scaling laws brockmann2006slh ; song2010msp , predictability of trajectories song2010lph , and impact of motion on disease spreading hufnagel2004fce ; belik2011nhm ; colizza2006rat ; balcan2009mmn .
However, from a comparative analysis of the different works it emerges clearly that a “unified theory” of human mobility is still outstanding, since results, even on some very basic features of the motion, often appear to be contrasting barthelemy2010sn . One example is the measured distribution of human trip lengths in various types of transportation: some studies agree that mobility is generally characterized by fat-tailed distributions of trip lengths brockmann2006slh ; song2010msp , while others report exponential or binomial forms bazzani2010slu ; roth2010cpc ; barthelemy2010sn . The discrepancies arise due to the different mobility data sets used, where mobility is indirectly inferred from some specific human activity in a particular context. For instance, mobile phone records typically provide location information only when a person uses the phone song2010msp , while radio frequency identification traces like the ones of Oyster cards in the London subway roth2010cpc only log movements based on public transportation systems. Analyses of these data sets can then result in a possibly biased view of the underlying mobility processes. Furthermore, most of the analyzed data sets have poor information on how socio-economic factors influence human mobility patterns. More generally, the lack of an all-encompassing record set with positional raw data, including complete information on the socio-economic context and on the behaviour of all members of a human society, has so far limited the possibilities for a comprehensive exploration of human mobility.
Here, we address the issue of mobility from a novel point of view by analyzing, with unprecedented precision, the movements of a large number of individuals, the players of a self-developed massive multiplayer online game (MMOG). Such online platforms provide a fascinating new way of observing hundreds of thousands of interacting individuals who are simultaneously engaged in social and economic activities. The potential of online worlds as large-scale “socio-economic laboratories” has been demonstrated in a number of previous studies szell2010msd ; szell2010mol ; castronova2006orv ; bainbridge2007srp . For the MMOG at hand pardus , we have access to practically all actions thurner2011egc , including movements, accumulated over several years. This MMOG can therefore be considered as a “socio-economic petri dish” to study mobility in a completely controlled way. We can in fact observe the long-time evolution of a social system at the scale of an entire human society, having a perfect knowledge of all the spatio-temporal and socio-economic details. In contrast to traditional studies in social science which are typically biased by well-known “interviewer-effects”, in MMOGs the socio-economic measurements are objective and unobtrusive, since subjects are not consciously aware of being observed.
Using positional data of the players in the game universe 111Whenever we address the position or the movement of ‘a player’ in the game universe, this is meant as a short form for referring to the virtual avatar which is uniquely associated to and controlled by the player. This abbreviation is consistent with the tendency of players to identify themselves with their avatars., in combination with other socio-economic information from the game, we uncover various fundamental features of mobility, and we provide a complete description of the mechanisms causing the observed anomalous diffusion. Two are the main results of our work. First, we find the emergence of different spatial scales, due to the strong tendency of the players to limit their economic activities to some specific areas over long time periods and to avoid crossing the borders between different areas. Making use of this observation, we propose an efficient method to identify socio-economic regions by means of community detection algorithms based solely on the measured movement dynamics. Our second result unveils the driving mechanism behind the movement patterns of players: Locations are visited in a specific order, leading to strong long-term memory effects which are essential to understand and reproduce the observed trajectories. Finally, we provide large-scale evidence that neglecting either of these spatial or temporal constraints may obstruct the possibility of understanding the processes behind human mobility.
.1 A social arena: the online game Pardus
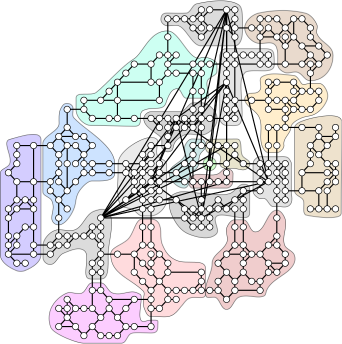
Pardus is a massive multiplayer online game running since 2004, with a worldwide player base of more than 350,000 individuals. It is an open-ended game whose players live in a virtual, futuristic universe and interact with each other in a multitude of ways. The topology of the universe can be represented as a network with nodes, called sectors, embedded in a two-dimensional space, the so-called universe map shown in Fig. 1. Each sector is like a city where players can have social relations (establish new friendships, make enemies and wage wars), and entertain economic activities (trade and production of commodities). Typically, sectors adjacent on the universe map, as well as a few far-apart sectors, are interconnected by links which allow players to move from sector to sector. At any point in time, each sector is usually attended by a large number of players. The network is sparse and, similarly to other spatial networks, is not a small world. It has a characteristic path length and a diameter , which means that, on average, players have to move through a non-negligible number of sectors to traverse the universe. See SI Section S3 and SI Table I for a detailed characterization of the universe network structure.
The sectors have been originally organized by the developers of the game into 20 different clusters, which are perceived by the players as different political or socio-economic regions such as countries. For example, a player who is member of a political faction in the game is provided some game-relevant protection in all clusters which are controlled by the faction, and has the opportunity of social promotion when accomplishing certain tasks within these clusters. Each cluster is shown in Fig. 1 with a different background colour. All clusters contain about 20 sectors each, with the exception of the central cluster, consisting of just one sector, and its surrounding three clusters having only 6-7 sectors. Sectors belonging to the same cluster are geographically close on the map, meaning that the distance between any two sectors in the same cluster is small, with an average distance around 3. Players typically have a “home cluster” where they focus their socio-economic activities over long time periods. Occasionally, they also move to sectors belonging to other clusters in order to explore the universe, to relocate their home (migrate), or during extreme game events such as wars.
In Pardus, players are free to pursue whichever role they like to take. Many of them focus on expanding their social relations or political influence, some play the role of “scientists” exploring the universe, while others choose their main goal in trade and optimizing the amount of virtual money earned szell2010msd . The large variety of complex socio-economic behaviours emerging in this online society, results in high heterogeneity in the mobility patterns, such as observed in real human motion. However, differently from other empirical studies on human movements, mobility in Pardus can be investigated in a controlled way, since complete information on actions of players is available szell2010msd ; szell2010mol . In this article we consider a data set consisting of movements in the network universe of all players who were active over a period of 1,000 days, as well as of socio-economic information about their environment. This opens the possibility of investigating motion in relation to other social and economic factors. Note that we do not have to address the common issues of relying on incomplete data, on data that are only a proxy of mobility, or on data that are aggregates of different types of transportation balcan2009mmn . See SI Section S2 for more details on the data set.
.2 Basic features of the motion
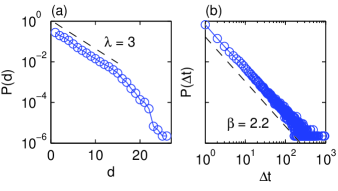
The position of each player in the universe, namely the ID number of the sector where the player is currently situated, is logged once a day. In this way the motion of each player becomes a time series of 1,000 sector positions. A jump occurs when a player’s sector position changes from one day to the following. The associated length of a jump is measured in terms of graph distance, an integer value between 1 and . The probability distribution of jump distances, computed for all players over the whole observation period, is reported in Figure 2 (a). For , the distribution is well-fitted by an exponential:
| (1) |
with a characteristic jump length . The existence of a typical travel distance, as also recently found in other mobility data roth2010cpc ; bazzani2010slu , is related to the use of a single transportation mode in Pardus koelbl2003energy . This allows to disentangle the intrinsic heterogeneity of the players from the effects due to the presence of different means of transportation balcan2009mmn , which might be the cause of the scale-free distributions found in mobile phone or other mobility data sets brockmann2006slh ; gonzalez2008uih . It has in fact been suggested that power laws in distance distributions of movement data may emerge from the coexistence of different scales barthelemy2010sn ; han2011osl .
In some cases, players stay in the same sector for a number of consecutive days. For instance, 11 of the 1458 considered players, although being active in the game, never jump within the entire observation period. On average, a player does not change sector in approximately of the days. To better characterize the motion, we computed the waiting times (measured in terms of number of days) between all pairs of consecutive jumps, over all players. The distribution of these waiting times, shown in Fig. 2 (b) follows a power-law distribution:
| (2) |
with an exponent , in agreement with other recent measurements on human dynamics barabasi2005obh . In addition, we found that the average waiting times of individual players are distributed as a power-law (see SI Fig. 2). This implies a strong heterogeneity in the motion of different players, which is related to the heterogeneity in their general activity (see SI Section S1 and SI Fig. 1).
.3 Mobility reveals socio-economic clusters
 |
 |
 |
 |
 |
 |
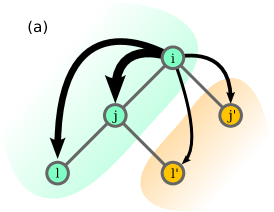
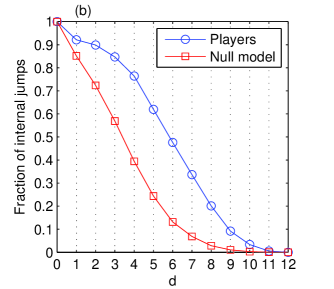
Mobility patterns are influenced by the presence of the socio-economic regions in the network, highlighted in colours in Fig. 1. The typical situation is illustrated in Fig. 3 (a), with jumps within the same cluster being preferred to jumps between sectors in different clusters. In order to quantify this effect, we report in Fig. 3 (b), blue circles, the observed number of jumps of length within the same cluster, divided by the total number of jumps of length . This ratio is a decreasing function of the distance , and reaches zero at , since no sectors at such distance do belong to the same cluster. As a null model we report the fraction of sector pairs at distance which belong to the same cluster, see red squares in the same figure. The significant discrepancy between the two curves indicates that players indeed tend to avoid crossing the borders between clusters. For example, a jump of length from one sector to another sector in the same cluster is expected only in of the cases, while it is observed in about of the cases.
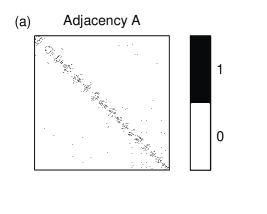
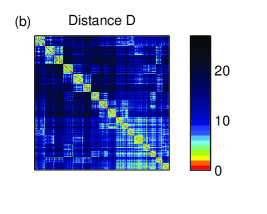
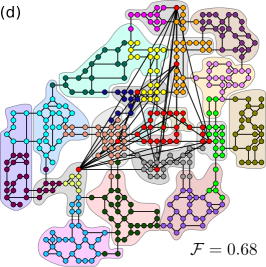
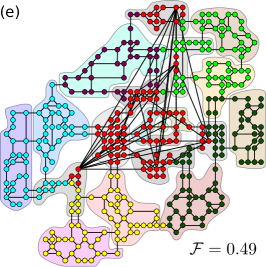
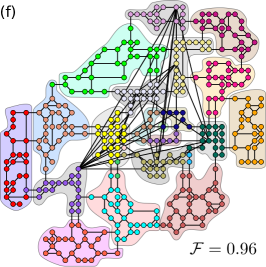
Now, the propensity of a player to spend long time periods within the same cluster might be simply related to the topology of the network, as in the case of random walkers whose motions are constrained on graphs with strong community structures fortunato2010report . Nodes belonging to the same cluster are in fact either directly connected or are at short distance from one another. This proximity is reflected in the block-diagonal structure of the adjacency matrix and of the distance matrix , respectively shown in Fig. 4 (a) and (b). We have therefore checked whether the presence of the socio-economic clusters originally introduced by the developers of the game can be derived solely from the structure of the network. For this reason we adopted standard community detection methods based on the adjacency and on the distance matrix Arenas:2008hq ; newman2004awn . The results, reported respectively in Fig. 4 (d) and (e), show that detected communities deviate significantly from the clusters, implying that in our online world the socio-economic regions cannot be recovered merely from topological features. In comparison we considered the player transition count matrix , shown in Fig. 4 (c), which displays a similar block-diagonal structure as and , but with the qualitative difference that it contains dynamic information on the system. Figure 4 (f) shows that community detection methods applied to the transition count matrix reveal almost perfectly all the socio-economic areas of the universe. This finding demonstrates that mobility patterns contain fundamental information on the socio-economic constraints present in a social system. Therefore, a community detection algorithm applied to raw mobility information, as the one proposed here, is able to extract the underlying socio-economic features, which are instead invisible to methods based solely on topology. For a detailed treatment of adopted community detection methods and measures see SI Section S4, SI Table II and SI Figs. 4 and 5.
.4 A long-term memory model
In order to characterize the diffusion of players over the network, we have computed the mean square displacement (MSD) of their positions, , as a function of time. Results reported in Fig. 5 (a) indicate that, for long times, the MSD increases as a power-law:
| (3) |
with an exponent . This anomalous subdiffusive behaviour is not a simple effect of the topology of the Pardus universe. In fact, as shown in Fig. 5 (b), gray stars, the simulation of plain random walks on the same network produces a standard diffusion with an exponent up to days, and then a rapid saturation effect which is not present in the case of the human players.
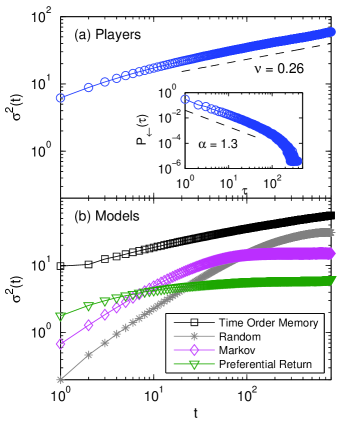
Insights from the previous section suggest that the anomalous diffusion behaviour might be related to the tendency of players to avoid crossing borders. We have therefore considered a Markov model in which each walker moves from a current node to a node with a transition probability , where is the number of jumps between sector and sector , as expressed by the transition count matrix of Fig. 4 (c). The probabilities are the entries of the transition probability matrix , which contains all the information on the day-to-day movement of real players, such as the preference to move within clusters, the length distribution of jumps, as well as the tendency to remain in the same sector. Despite this detailed amount of information used (the matrix has 160,000 elements), the Markov model fails to reproduce the asymptotic behaviour of the MSD, see magenta diamonds in Fig. 5 (b). Since the model considers only the position of the individual at its current time to determine its position at the following time, deviations from empirical data appear presumably due to the presence of higher-order memory effects sinatra2010nms . For this reason we have considered the recently proposed preferential return model song2010msp which incorporates a strong memory feature. The model is based on a reinforcement mechanism which takes into account the propensity of individuals to return to locations they visited frequently before. This mechanism is able to reproduce the observed tendency of individuals to spend most of their time in a small number of locations, a tendency which is also prevalent in the mobility behaviour of Pardus players (see SI Fig. 3). However, the implementation of the preferential return model on the Pardus universe network is not able to capture the scaling patterns of the MSD, as shown in Fig. 5 (b). The reason is that in the model the probability for an individual to move to a given location does not depend on the current location, nor on the order of previously visited locations. Instead, we observe that in reality individuals tend to return with higher probability to sectors they have visited recently and with lower probability to sectors visited a long time before. Consequently a sector that has been visited many times but with the most recent visit dating back one year has a lower probability to be visited again than a sector that has been visited just a few times but with the last visit dating back only one week.
To highlight this mechanism we measured the return time distribution in the jump-time series (see Methods). In particular, we extracted the probability for an individual to return again (for the first time) to the currently occupied sector after jumps. As shown in the inset of Fig. 5 (a), we found that the return time distribution reads
| (4) |
with an exponent . We used this information for constructing a model which takes into account the higher re-visiting probability of recently explored locations. In this way we can capture the long-term scaling properties of movements. Exactly these asymptotic properties are fundamentally relevant for issues of epidemics spreading or traffic management.
This “Time Order Memory” (TOM) model incorporates a power-law distribution of first return times, together with a power-law distribution of waiting times and an exponential distribution of jump distances, as those observed empirically in Fig. 2. We show below that these ingredients are sufficient to reproduce the subdiffusive behaviour reported in Fig. 5 (a). The model works as follows: an individual stands still in a given sector for a number of days drawn from the waiting time distribution, Eq. (2). Then, the individual jumps. There are two possibilities: (i) with a probability she returns to an already visited sector, (ii) with the probability she jumps to a so far unexplored sector. In case (i), one of the previously visited sectors is chosen according to Eq. (4). In the exploration case (ii), the individual draws a distance from the distance distribution, Eq. (1), and jumps to a randomly selected, unexplored sector at that distance. The model has four parameters. The parameters , and of equations (1), (2) and (4) respectively, are fixed by the data. Further, averaging over all jumps and players, the probability of returning to an already visited location is . Similarly to the measured data, the MSD of the TOM model, black squares in Fig. 5 (b), exhibits no saturation effects and displays an exponent (the error is calculated over an ensemble of realizations) in agreement with the exponent observed for the players.
The flat slope of and the lack of saturation of the MSD of the players over the whole observation period exposes the significant level of subdiffusivity in the motions of individuals, consistent with previous findings west1997fdl ; song2010msp ; metzler2000rwg ; scafetta2002lsc ; viswanathan1999osr . However, the mere tendency of individuals to return to already visited locations is not sufficient to capture these subdiffusive properties of the MSD, but it is fundamental to consider a mechanism that takes into account the temporal order of visited locations, as achieved by the TOM model. Moreover, the TOM model is realistic in the sense that, in contrast to Markov models, it takes into account the tendency of individuals to develop a preference for visiting certain locations. At the same time it allows for the possibility that a previously preferred location becomes not frequented anymore. This view provides an alternative to recently suggested reinforcement mechanisms in preferential return models song2010msp . The possibility for individuals to “change home” is relevant when the model should be able to account for migration, which is an important feature in the long-time mobility behaviour of humans.
Finally, we discuss to which extent the findings from our “social petri dish” are valid also for human populations unrelated to the game. Previous analyses of human social behaviour in Pardus szell2010msd ; szell2010mol have shown agreement with well-known sociological theories and with properties on comparable behavioural data. Examining the preference of players to move within socio-economic regions is of obvious importance for clearing up the role of political or socio-economic borders on the movement and migration of humans, where the presence of borders has a strong influence on mobility thiemann2010sbs ; ratti2010rmg ; newman2006lcs ; lambiotte2008gdm . Online societies as the one of Pardus have the evident potential to serve as “socio-economic laboratories”, where the complete knowledge of activities, social relations, and positions of all individuals can significantly advance our understanding of large-scale human behaviour, in particular of mobility.
.5 Methods
Data set. We focus on one of the three Pardus universes, Artemis. For this universe, we extract player mobility data from day 200 to day 1200 of its existence. We discard the first 200 days because social networks between players of Pardus have shown aging effects in the beginning of the universe, i.e. there seems to exist a transient phase in the development of the society, possibly affecting mobility, which we would like to avoid considering szell2010msd . To make sure we only consider active players, we select all who exist in the game between the days 200 and 1200, yielding 1458 players active over a time-period of 1000 days. The sector IDs of these players, i.e. their positions on the universe network’s nodes, are logged every day at 05:35 GMT. Players typically log in once a day and perform all their limited movements of the day within a few minutes, see SI Section S1. The legal department of the Medical University of Vienna has attested the innocuousness of the used anonymized data.
Transition count matrix and transition probability matrix. The entry of the transition count matrix is equal to the number of times a player’s position was on sector and then, on the following day, on sector . This number is cumulated for all players. The entry of the transition probability matrix corresponds to the probability that a player moves to a sector given that on the previous day the player’s location was sector . It reads: , where is the number of observed player movements from sector to sector , and the sum over is over all sectors of the universe. The matrix is a stochastic matrix, i.e. it has the property that the entries of each row sum to one.
MSD and diffusion. The MSD is defined as , where and are the sectors a player occupies at times and respectively, and where by we denote the distance between the two sectors. The average is performed over all windows of size , with their left boundaries going from T=0 to T=1000-t, and over all the 1458 players in the data set. If has the form with an exponent , the diffusion process is subdiffusive, in the case it is super-diffusive. An exponent of corresponds to classical brownian motion metzler2000rwg ; west1997fdl .
Jump-time and first return time distribution. We transform the time-series of daily sector IDs occupied by the players from real-time to jump-time, in order to be able to compare time-series of different length and to focus on the movements between sectors. An example of this conversion is provided: a time series becomes in jump-time . We denote jump-time by the greek letter , that is, at jump-time a player has performed exactly jumps. We use in the computation of the first return time distribution. In the hypothetical time series of sectors a first return to a sector lying jumps back happens 2 times ( and ), for this happens once (), for also once (). Hence, in this example, , , where the sum over all is equal to 1.
.6 Acknowledgments
This work was conducted under the HPC-EUROPA2 project (project number: 228398) with the support of the European Commission – Capacities Area – Research Infrastructures initiative, and within the framework of European Cooperation in Science and Technology Action MP0801 Physics of Competition and Conflicts. M.S. and S.T. acknowledge support from the Austrian Science Fund Fonds zur Förderung der wissenschaftlichen Forschung P 23378, and from project EU FP7 – INSITE. M.S., R.S. and G.P. also thank the Santa Fe Institute for the opportunities offered during the Complex Systems Summer School 2010, where this project originated.
References
- (1) Barthélemy, M. Spatial networks. Phys. Rep. 499, 1–101 (2010).
- (2) Guimerà, R., Mossa, S., Turtschi, A. & Amaral, L. The worldwide air transportation network: anomalous centrality, community structure, and cities global roles. Proc. Natl. Acad. Sci. USA 102, 7794–7799 (2005).
- (3) Helbing, D. Traffic and related self-driven many-particle systems. Rev. of Mod. Phys. 73, 1067 (2001).
- (4) Makse, H. A., Havlin, S. & Stanley, H. E. Modelling urban growth patterns. Nature 377, 608–612 (1995).
- (5) Roth, C., Kang, S. M., Batty, M. & Barthélemy, M. Structure of urban movements: Polycentric activity and entangled hierarchical flows. PLoS ONE 6, e15923 (2011).
- (6) Pastor-Satorras, R. & Vespignani, A. Epidemic spreading in scale-free networks. Phys. Rev. Lett. 86, 3200–3203 (2001).
- (7) Colizza, V., Barrat, A., Barthélemy, M. & Vespignani, A. The role of the airline transportation network in the prediction and predictability of global epidemics. Proc. Natl. Acad. Sci. USA 103, 2015 (2006).
- (8) Hufnagel, L., Brockmann, D. & Geisel, T. Forecast and control of epidemics in a globalized worlds. Proc. Natl. Acad. Sci. USA 101, 15124–15129 (2004).
- (9) Balcan, D. et al. Multiscale mobility networks and the spatial spreading of infectious diseases. Proc. Natl. Acad. Sci. USA 106, 21484–21489 (2009).
- (10) Miritello, G., Moro, E. & Lara, R. Dynamical strength of social ties in information spreading. Phys. Rev. E 83, 045102 (2011).
- (11) Onnela, J. et al. Structure and tie strengths in mobile communication networks. Proc. Natl. Acad. Sci. USA 104, 7332 (2007).
- (12) Quercia, D., Lathia, N., Calabrese, F., Di Lorenzo, G. & Crowcroft, J. Recommending social events from mobile phone location data. In Data Mining (ICDM), 2010 IEEE 10th International Conference on, 971 –976 (2010).
- (13) Jensen, P. Network-based predictions of retail store commercial categories and optimal locations. Phys. Rev. E 74, 035101 (2006).
- (14) Brockmann, D., Hufnagel, L. & Geisel, T. The scaling laws of human travel. Nature 439, 462–465 (2006).
- (15) Thiemann, C., Theis, F., Grady, D., Brune, R. & Dirk Brockmann, D. The structure of borders in a small world. PLoS one 5, e15422 (2010).
- (16) González, M., Hidalgo, C. & Barabási, A. Understanding individual human mobility patterns. Nature 453, 779–782 (2008).
- (17) Scellato, S., Noulas, A., Lambiotte, R. & Mascolo, C. Socio-spatial properties of online location-based social networks. Proceedings of ICWSM 11 (2011).
- (18) Scellato, S., Musolesi, M., Mascolo, C., Latora, V. & Campbell, A. Nextplace: A spatio-temporal prediction framework for pervasive systems. Pervasive Computing 152–169 (2011).
- (19) Bazzani, A., Giorgini, B., Rambaldi, S., Gallotti, R. & Giovannini, L. Statistical laws in urban mobility from microscopic gps data in the area of florence. J. Stat. Mech. 2010, P05001 (2010).
- (20) Cattuto, C. et al. Dynamics of person-to-person interactions from distributed rfid sensor networks. PloS one 5, e11596 (2010).
- (21) Song, C., Koren, T., Wang, P. & Barabási, A. Modelling the scaling properties of human mobility. Nature Physics 6, 818–823 (2010).
- (22) Song, C., Qu, Z., Blumm, N. & Barabási, A. Limits of predictability in human mobility. Science 327, 1018 (2010).
- (23) Belik, V., Geisel, T. & Brockmann, D. Natural human mobility patterns and spatial spread of infectious diseases. Phys. Rev. X 1, 011001 (2011).
- (24) Boccaletti, S., Latora, V., Moreno, Y., Chavez, M. & Hwang, D. Complex networks: structure and dynamics. Phys. Rep. 424, 175–308 (2006).
- (25) Szell, M. & Thurner, S. Measuring social dynamics in a massive multiplayer online game. Social Networks 32, 313–329 (2010).
- (26) Szell, M., Lambiotte, R. & Thurner, S. Multirelational organization of large-scale social networks in an online world. Proc. Natl. Acad. Sci. USA 107, 13636–13641 (2010).
- (27) Castronova, E. On the research value of large games. Games and Culture 1, 163–186 (2006).
- (28) Bainbridge, W. The scientific research potential of virtual worlds. Science 317, 472 (2007).
- (29) www.pardus.at.
- (30) Thurner, S., Szell, M. & Sinatra, R. Emergence of good conduct, scaling and zipf laws in human behavioral sequences in an online world. arXiv:1107.0392v1 (2011).
- (31) Whenever we address the position or the movement of ‘a player’ in the game universe, this is meant as a short form for referring to the virtual avatar which is uniquely associated to and controlled by the player. This abbreviation is consistent with the tendency of players to identify themselves with their avatars.
- (32) Kölbl, R. & Helbing, D. Energy laws in human travel behaviour. New J. of Phys. 5, 48 (2003).
- (33) Han, X., Hao, Q., Wang, B. & Zhou, T. Origin of the scaling law in human mobility: Hierarchy of traffic systems. Phys. Rev. E 83, 036117 (2011).
- (34) Barabási, A. The origin of bursts and heavy tails in humans dynamics. Nature 435, 207 (2005).
- (35) Fortunato, S. Community detection in graphs. Phys. Rep. 486, 75–174 (2010).
- (36) Arenas, A., Fernández, A. & Gómez, S. Analysis of the structure of complex networks at different resolution levels. New J. of Phys. 10, 053039 (2008).
- (37) Newman, M. Analysis of weighted networks. Phys. Rev. E 70, 056131 (2004).
- (38) Sinatra, R., Condorelli, D. & Latora, V. Networks of motifs from sequences of symbols. Phys. Rev. Lett. 105, 178702 (2010).
- (39) West, B., Grigolini, P., Metzler, R. & Nonnenmacher, T. Fractional diffusion and levy stable processes. Phys. Rev. E 55, 99 (1997).
- (40) Metzler, R. & Klafter, J. The random walk’s guide to anomalous diffusion: a fractional dynamics approach. Phys. Rep. 339, 1–77 (2000).
- (41) Scafetta, N., Latora, V. & Grigolini, P. Lévy statistics in coding and non-coding nucleotide sequences. Phys. Lett. A 299, 565–570 (2002).
- (42) Viswanathan, G. et al. Optimizing the success of random searches. Nature 401, 911–914 (1999).
- (43) Ratti, C. et al. Redrawing the map of Great Britain from a network of human interactions. PLoS One 5, e14248 (2010).
- (44) Newman, D. The lines that continue to separate us: borders in our borderless world. Progress in Human Geography 30, 143 (2006).
- (45) Lambiotte, R. et al. Geographical dispersal of mobile communication networks. Physica A 387, 5317–5325 (2008).
- (46) Supporting Information: http://www.complex-systems.meduniwien.ac.at/publications/szell2011ums