Discovery of shocked H2 around OH 231.8+4.2
Abstract
We present -band integral field observations of the circumstellar envelope of the evolved star OH 231.8+4.2. Spatial and spectral information were simultaneously acquired using the sinfoni integral field unit, with adaptive optics, on the Very Large Telescope. The observations reveal the discovery of H2 emission (1) around the centre of the nebula and (2) located in clumps along the Western side of the Northern lobe, presumably associated with the strong shocks that stimulate the previously reported H emission at the same location. An observed H2 10/21S(1) line ratio of 8.31.9 was calculated for the central field, a value consistent with shock excitation.
keywords:
molecular data – circumstellar matter – stars: AGB and post-AGB – stars: individual(OH 231.8+4.2) – shock waves1 Introduction
OH 231.8+4.2 (hereafter OH231) is an O-rich late spectral type (M) central star (Mira variable, QX Pup) with bipolar high-velocity dust and gas outflows (Alcolea et al., 2001), filamentary structures observed in scattered and molecular line emission, and large angular size (10′′60′′). Often labeled as a post-AGB object or pre-planetary nebula, the presence of both a Mira central star and a main-sequence companion of spectral type A (Sánchez Contreras et al., 2004) seems to contradict this classification. OH231 is more likely a D-type bipolar symbiotic system (Frew & Parker, 2010). However in some cases, morphological similarities do exist between post-AGB and symbiotic objects, most strikingly the presence of highly collimated bipolar nebulae. It is via fast-collimated outflows that these stars shape their surrounding nebula. Understanding the development and origin of these fast outflows is critical for advancing hydrodynamical models of wind interaction. Recent work by Lee et al. (2009) attempting to reproduce the high velocity molecular emission in AFGL 618 using collimated fast wind models, emphasises the need for further observations and model development in this area.
OH231 has been the subject of many studies spanning multiple wavelength ranges, for example: Cohen et al. (1985) were first to propose the existence of a binary companion; Bujarrabal et al. (2002) imaged the shape of the shocks using H (reproduced in Fig. 1 [a]) detected with the Hubble Space Telescope (HST); Meakin et al. (2003) report HST/NICMOS NIR images of the dust distribution and hence a high resolution map of the extinction through the nebula. Matsuura et al. (2006) using the MIDI and NACO instruments on the Very Large Telescope (VLT) detected a compact circumstellar disc. The envelope of OH231 is also known to be rich in molecular species (e.g. H2O, OH, and SiO) however previous studies in the NIR have all returned null detections of H2 (e.g. Weintraub et al., 1998; Matsuura et al., 2006).
In this Letter, we present the results of preliminary observations of OH231 at NIR (-band) wavelengths showing for the first time the presence of shock-excited H2. Throughout this work we assume OH231 is a member of the open cluster M46 at a distance of 1.3 kpc (Jura & Morris, 1985). The origin of the coordinate system used in Figures 1,3, and 4 is given by the location of the SiO maser emission at RA=07h42m16s.93, Dec=-14∘42′50′′.2 (J2000) (Sánchez Contreras et al., 2002), and the inclination angle of the bipolar axis is 36∘ to the plane of the sky (Kastner et al., 1992).
2 Observations and Data Reduction
The data were taken using the sinfoni (Eisenhauer et al., 2003) instrument located on UT4 at VLT at Paranal, Chile, on the 1st/2nd Feb 2010. We use the lowest resolution mode (LRM), corresponding to the widest field-of-view (8′′ x 8′′) with adaptive optics (AO) and a natural guide star (NGS). A plate scale of 250125 mas pixel-1, and a spectral and velocity resolution of 4580 and 66 km s-1, respectively, are available at this resolution (for a dispersion of 2.45 Å/pix and line FWHM of 1.96 pixels). All observations utilised the -band (2.2 m) filter which covers many ro-vibrational H2 emission lines. The ambient seeing varied from 0.6′′ to 1.1′′ during the observations. The OH231 observations consisted of three fields focused on (1) the edge of the Northern lobe, (2) the central region, and (3) the middle of the Southern lobe (labelled N, C, S in Fig. 1 [b]). No H2 was detected in the Southern field and will not be discussed further. Table 1 summarises exposures for each of the three fields. Telluric standard stars used for calibration are HD 75004 (G0V), and HD 63487 (G2V) for night one and two, respectively. An average AO-corrected PSF of 340 mas FWHM is estimated from the standard stars. The data were reduced using the ESO common pipeline library to a wavelength-calibrated datacube and further analysed using both PyRAF111PyRAF is a product of the Space Telescope Science Institute, which is operated by AURA for NASA.. Wavelength calibration errors were corrected by comparison of OH emission lines with a high resolution template. Quoted velocities were adjusted to local standard of rest (LSR) velocities using 22.88 and 23.30 km s-1 corrections for night one and night two, respectively. Line maps (Fig. 1 [c,d]) were generated by fitting the H2 emission lines with a Gaussian profile; initial fit parameters (FWHM0, central wavelength0, etc.) were determined by manually fitting an individual H2 line, only lines with a FWHM FWHM0 make up the final line maps. Signal-to-Noise (S/N) of the line maps was enhanced by smoothing the data with a 22 pixel boxcar filter. Line rest wavelength information is from Black & van Dishoeck (1987).
| OH231 | HD | ||||||
|---|---|---|---|---|---|---|---|
| South | Central | North | 75004 | 63487 | |||
| Tot. Exp. (secs) | 600 | 600 | 480 | 800 | 1 | 10 | |
| K (mag) | – | – | – | – | 7.268† | 7.674† | |
| Night | 1 | 1 | 2 | 1 | 1 | 2 | |
-
2mass magnitude from: SIMBAD
3 Results
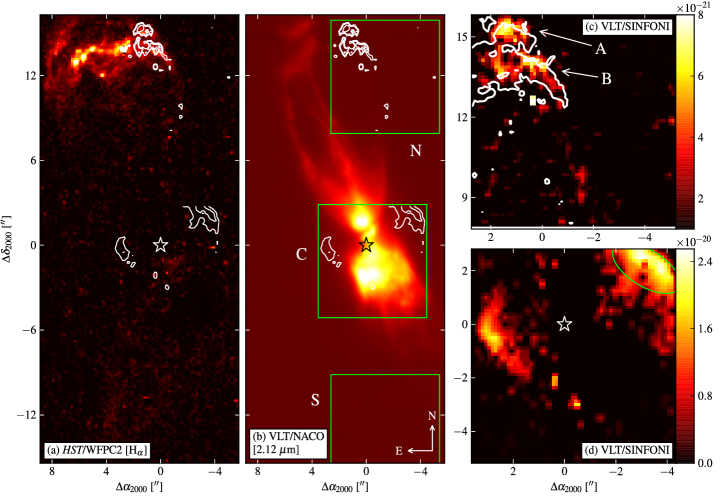
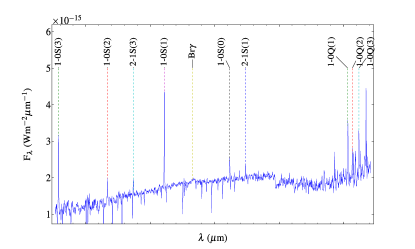
We report the detection of several H2 emission lines arising from both the centre and Northern lobe of OH231. In Figure 1 (c,d) we present continuum-subtracted line maps of the 10S(1) transition for both fields, showing clearly H2 emission arising from the centre of OH231 (Fig. 1 [d]) and from knots of material in the Northern lobe (Fig. 1 [c]). In Fig. 1 (a) the contours of the detected H2 are shown in relation to H emission, while Fig. 1 (b) gives the location of the H2 relative to the strong continuum emission as imaged with a 2.12 m filter. An integrated spectrum of the Western region of the centrally located H2 is shown in Figure 2, from which we note, a) several S- and Q-branch ro-vibrational H2 lines, and b) a CO bandhead absorption feature (2.3 m).
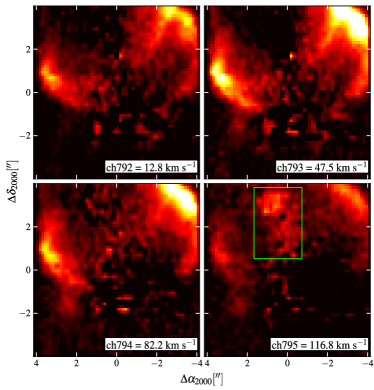
Channel maps, extracted from the sinfoni datacube, are presented in Figures 3 and 4 for the central and Northern regions respectively, showing how the distribution of the H2 changes across the line profile.
| Central | Northern | |||||
|---|---|---|---|---|---|---|
| Line | ||||||
| 10S(3) | 1.9579 | 67.2 | 14.2 | 11.5 1.10 | ||
| 10S(2) | 2.0342 | 9.71 | 3.36⋄ | — | ||
| 10S(1) | 2.1222 | 91.5 | 6.16 | 9.69 0.76 | ||
| 21S(1) | 2.2481 | 7.73 | 3.38‡ | — | ||
| 10Q(1) | 2.4071 | 46.4 | 14.5 | 11.9 2.95 | ||
| 10Q(3) | 2.4241 | 42.2 | 24.0 | 13.3 4.42 | ||
-
Flux measured for Western H2 region only.
-
Measurement confined to elliptical region (Fig. 1 [d]).
Table 2 presents the flux measurements for the central and Northern fields, for lines with flux errors less than 50 per cent. Accurate 21S(3), 10S(0), and 10Q(2) line flux measurements are not possible due to the presence of strong sky subtraction residuals at these wavelengths. We confine the calculation of the 10/21S(1) ratio for the central field to the area marked by the ellipse in Fig. 1 (d), where the 21S(1) flux error is smallest. In this region we calculate a 10/21S(1) ratio of 8.31.9 prior to extinction correction. We do not detect any 21S(1) flux in the Eastern H2 region, instead we estimate an upper 21S(1) limit (3) for the flux in this region of 1.310-19 W m-2, which in turn places a lower limit of 9.5 on the 10/21S(1) ratio for this region.
4 Analysis and Discussion
The 10/21S(1) ratio is a useful discriminator of excitation mechanisms. Pure fluorescence will yield a value of 2 while a value 10 indicates the excitation of the gas is being driven by shocks. However it is worth noting, these values depend on shock velocity and pre-shock gas density, with shocked H2 capable of producing values as low as 4 (Smith, 1995), while fluorescence can produce values approaching those of shocks (Hollenbach & Natta, 1995). The 10/21S(1) ratio values, given above, suggest that shocks might be the main excitation mechanism, which agrees with the detection of shock-excited HCO+ in the centre of OH231 noted in the position-velocity diagrams of Sánchez Contreras et al. (2000). In order to determine the intrinsic 10/21S(1) ratio, it is necessary to remove the effects of extinction. In the -band, it is sometimes possible to derive the level of extinction via the comparison of S-/Q-branch H2 emission lines (see Smith et al., 2003). Unfortunately, due to poor atmospheric transmission above 2.4 m, it was not possible to derive a sensible estimate for extinction using the 10 S(1) and Q(3) lines.
Extinction values of =3–4 (mag) for the central region are estimated from the colour map of OH231 (Kastner et al., 1998). Although, most likely an over-estimate, adjusting the Western 10/21S(1) ratio for these levels of extinction yields, for example, a value of 11.72.6 (=4). It is clear that any adjustment for extinction will increase the observed 10/21S(1) ratio, pushing it further towards the shock regime.
Using a typical value of 5.310-22 mag cm2 for the extinction per unit column density of hydrogen, , one can estimate the hydrogen column density implied by an =4; yielding a for the H2 regions of 7.21022 cm-2. Using a typical column length of the H2 emitting regions of 1″(2.01016 cm), as used in Bujarrabal et al. (2002), we estimate an average density for the H2 regions of 3.5106 cm-3. This value is in good agreement with Alcolea et al. (2001) who estimate an average central density of 3.0106 cm-3. The H2 emission is most likely originating in the dense equatorial regions surrounding the central star.
4.1 Equatorial Region
The 10S(1) H2 line map (see Fig. 1 [d]) shows two regions of H2 oriented at a position angle (PA) of 113∘, from brightest to faintest peak. If we assume that the distribution of the H2 around the central region of OH231 is in a disc configuration then by measuring the major and minor axis we can estimate the inclination angle of the equatorial disc with respect to the plane of the sky from the H2 data. Measurements for / are determined by superposing a full ellipse onto the H2 line map. We find = 4.06″ and = 2.76″from the centre of the ellipse, and using the relation sin-1(/), we find 43∘8. This result is in good agreement with previously published values.
The location and orientation of this H2 adds to the already complex picture of the equatorial region of OH231. Some previously reported structures, from smallest to largest, include:
- -
-
-
a centrally located compact disc of circumstellar material with inner R=0.03–0.04″/40–50 AU (Matsuura et al., 2006);
-
-
an opaque flared disc with outer R=0.25″/330 AU revealed in mid-IR images (Jura et al., 2002);
-
-
a slowly expanding disc with characteristic R=0.9″/1160 AU, detected via the SO (=2211) transition (Sánchez Contreras et al., 2000);
-
-
a torus of OH maser emission with outer R=2.5″/3250 AU (Zijlstra et al., 2001);
-
-
an expanding hollow cylinder of HCO+ with a characteristic radius equal to the OH torus radius (Sánchez Contreras et al., 2000).
-
-
a halo of scattered light at R4″/5200 AU (Meakin et al., 2003);
From our observations the geometry of the H2 region is unclear, however we offer two possibilities: (1) A disc of H2: Figure 1 (d) shows what might be interpreted as an incomplete disc of H2, which fits with the series of concentric disc/tori structures listed above. To understand why we observe only emission from the edges and not the front of the disc, a comparison of the noise in the continuum at the front of the putative disc, to the amplitude of the 10S(1) line peak shows both to be of the same order. We might then attribute the ‘missing’ H2 in this region to variations in the continuum. We would not expect to observe the back of the disc due to the high level of extinction through the nebula. (2) A shell of H2: if the H2 is situated in an axisymmetric shell surrounding the central star, we might explain the geometry of the H2 regions by assuming a density contrast between the poles and equator. This, combined with an increased column depth at the edge of the shell would manifest itself as two arcs of H2 emission situated equatorially (as noted by Lowe & Gledhill, 2005, for IRAS 19306+1407). This is supported by the detection of a shell of higher density gas and dust at the same location as the H2 (Meakin et al., 2003). Both scenarios offer plausible explanations for the geometry of the H2 emitting region, however further observations are needed in order to favour one.
We fit the 10S(1) line profile yielding a =3617 km s-1and FWHM=100 km s-1for both Eastern and Western regions of H2 emission, a value consistent with the systemic velocity. Channel maps of the 10S(1) line (Fig. 3) show no significant change in the distribution of the H2.
In an attempt to explain the lack of reported H2 in this object, we note two previous studies: (1) Weintraub et al. (1998) give a 3 upper limit of 10-5 ergs cm-2 s-1 ster-1 (1 limit =6.610-18 W m-2) for the surface brightness of the 10S(1) line towards OH231. This places their measurement limit close to the 10S(1) line strength given in Table 2, implying that the 10S(1) line in their observations would be difficult to distingush from noise, or possibly that their slit position, aligned East-West across inferred central star position, did not include the H2 sites; (2) Matsuura et al. (2006), using the isaac instrument on VLT, do not report any detection of H2. However, this can be explained due to the orientation of the slit, aligned from South-West to North-East along the major axis (private comm.), with a slit-width of 0.8″, i.e., the central H2 emission site was not covered.
4.2 Northern Region
Figure 1 (c) shows the line map for the 10S(1) transition in the Northern region. Most notable are the two knots of H2, labeled A and B for the top and bottom knot, respectively. The H emission contours are superposed on the H2 line map. The peak intensity of the H2 emission knots are slightly offset from the two H emission knots (Fig. 1 [c]), however this small offset can be accounted for by the motion of the outflow (e.g.150 km s-1, from Bujarrabal et al., 2002) during the 10 years between both sets of observations. It is most likely that the optical and NIR line emission arise from the same shock event. Weaker 10S(1) emission is noted tracing the H edge of the bipolar outflow in the lower portion of the 10S(1) line map. The NACO 2.12 m image does not show any trace of H2 emission in this region (see contours in Fig. 1 [b]).
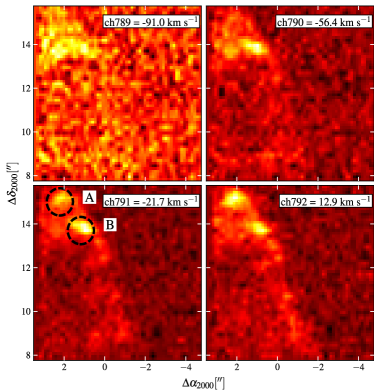
The 10S(1) line is spread over six spectral pixels, the four central channels are presented in Fig. 4. Examination of the line profile and channel maps allows us to probe the kinematics of the H2 in this region, revealing two main features: 1) knot B which is persistent in all channel maps 2) the reduction of peak H2 intensity in knot A at velocities -56 km s-1. Both of these H2 structures lie in the diffuse extended region (labeled B1 in Fig. 4 of Bujarrabal et al., 2002) perpendicular to the axial flow, with a quoted H velocity of 150 km s-1 which is in good agreement with not only our deprojected H2 velocities (110 km s-1) but also with HCO+ velocities (Sánchez Contreras et al., 2000).
In the case of knot A, the spectral line is strongly peaked in a single channel, while in knot B the spectral line peak is spread over two channels. Fitting the line profiles of knots A and B, yields LSR velocities of =-8 km s-1, and -30 km s-1, with deprojected velocities of -75 km s-1and -110 km s-1, respectively. This might indicate that further from the H bow apex (Fig. 1 [a]), we are starting to see emission originating from the front and back of knot B, while knot A displays a narrower range of velocities, i.e., a single peak in its spectral profile. It is worth noting that due to the slit-length of isaac (120″) coupled with the null H2 detection discussed in §4.1, the H2 in the Northern region might be confined to the wings of the bow shock.
The existence of fast moving shocked H2 has previously been noted in other objects, for example, Cox et al. (2003) detect high velocity H2 220–340 km s-1 (dependent on adopted inclination angle) in the outflows of AFGL 618. It is currently unknown exactly how shocked H2 can be travelling at this speed without complete dissociation. Further high resolution mapping of the H2 is necessary in order to resolve the shock surfaces, more accurately measure the H2 kinematics, and apply shock models to this region.
5 Conclusions
We have presented VLT/sinfoni integral field observations of OH231, revealing the presence of several ro-vibrational H2 lines. The main conclusions are:
-
-
The discovery of H2 emission near the centre of OH231, possibly located at the edge of an axisymmetric shell or an incomplete disc.
-
-
A 10/21S(1) value of 8.31.9 is found for the equatorial H2, suggesting a collisional excitation mechanism.
-
-
Our observations of the central shell/disc of H2 show no velocity structure. However, higher S/N and/or velocity resolution data are needed to accurately probe the kinematics in this region.
-
-
We detect fast-moving H2 (110 km s-1, along the bipolar axis) via the 10S(1) transition along the North-Western tip of the nebula, a region where a strong H bow shock exists. Due to the small FOV of our observations, the full extent of this H2 is unknown.
6 Acknowledgments
This research is funded by UH studentship and based on observations made with ESO Telescopes at the Paranal Observatory under programme ID 084.D-0487(A) and 072.D-0766(A). We thank Mikako Matsuura for providing isaac observation information. This research used the HLA (ID 8326) facilities of the STScI, the ST-ECF and the CADC with the support of the following granting agencies: NASA/NSF, ESA, NRC, CSA.
References
- Alcolea et al. (2001) Alcolea J., Bujarrabal V., Sánchez Contreras C., Neri R., Zweigle J., 2001, A&A, 373, 932
- Black & van Dishoeck (1987) Black J. H., van Dishoeck E. F., 1987, ApJ, 322, 412
- Bujarrabal et al. (2002) Bujarrabal V., Alcolea J., Sánchez Contreras C., Sahai R., 2002, A&A, 389, 271
- Cohen et al. (1985) Cohen M., Dopita M. A., Schwartz R. D., Tielens A. G. G. M., 1985, ApJ, 297, 702
- Cox et al. (2003) Cox P., Huggins P. J., Maillard J.-P., Muthu C., Bachiller R., Forveille T., 2003, ApJ, 586, L87
- Eisenhauer et al. (2003) Eisenhauer, F. et al., 2003, Proc. SPIE, 4841, 1548
- Frew & Parker (2010) Frew D. J., Parker Q. A., 2010, PASA, 27, 129
- Hollenbach & Natta (1995) Hollenbach D., Natta A., 1995, ApJ, 455, 133
- Jura et al. (2002) Jura M., Chen C., Plavchan P., 2002, ApJ, 574, 963
- Jura & Morris (1985) Jura M., Morris M., 1985, ApJ, 292, 487
- Kastner et al. (1998) Kastner J. H., Weintraub D. A., Merrill K. M., Gatley I., 1998, AJ, 116, 1412
- Kastner et al. (1992) Kastner J. H., Weintraub D. A., Zuckerman B., Becklin E. E., McLean I., Gatley I., 1992, ApJ, 398, 552
- Lee et al. (2009) Lee C.-F., Hsu M.-C., Sahai R., 2009, ApJ, 696, 1630
- Lowe & Gledhill (2005) Lowe K. T. E., Gledhill T. M., 2005, ASPC, 343, 282
- Matsuura et al. (2006) Matsuura M. et al., 2006, ApJ, 646, L123
- Meakin et al. (2003) Meakin C. A., Bieging J. H., Latter W. B., Hora J. L., Tielens A. G. G. M., 2003, ApJ, 585, 482
- Sánchez Contreras et al. (2000) Sánchez Contreras C., Bujarrabal V., Neri R., Alcolea J., 2000, A&A, 357, 651
- Sánchez Contreras et al. (2002) Sánchez Contreras C., Desmurs J. F., Bujarrabal V., Alcolea J., Colomer F., 2002, A&A, 385, L1
- Sánchez Contreras et al. (2004) Sánchez Contreras C., Gil de Paz A., Sahai R., 2004, ApJ, 616, 519
- Smith (1995) Smith M. D., 1995, A&A, 296, 789
- Smith et al. (2003) Smith M. D., Froebrich D., Eislöffel J., 2003, ApJ, 592, 245
- Weintraub et al. (1998) Weintraub D. A., Huard T., Kastner J. H., Gatley I., 1998, ApJ, 509, 728
- Zijlstra et al. (2001) Zijlstra A. A., Chapman J. M., te Lintel Hekkert P., Likkel L., Comeron F., Norris R. P., Molster F. J., Cohen R. J., 2001, MNRAS, 322, 280