A Surprising Dynamical Mass for V773 Tau B
Abstract
We report on new high-resolution imaging and spectroscopy on the multiple T Tauri star system V773 Tau over the 2003 – 2009 period. With these data we derive relative astrometry, photometry between the A and B components, and radial velocity (RV) of the A-subsystem components. Combining these new data with previously published astrometry and RVs, we update the relative A-B orbit model. This updated orbit model, the known system distance, and A subsystem parameters yields a dynamical mass for the B component for the first time. Remarkably the derived B dynamical mass is in the range of 1.7 – 3.0 M☉. This is much higher than previous estimates, and suggests that like A, B is also a multiple stellar system.
Among these data, spatially-resolved spectroscopy provide new insight into the nature of the B component. Similar to A, these near-IR spectra indicate that the dominant source in B is of mid-K spectral type. If B is in fact a multiple star system as suggested by the dynamical mass estimate, the simplest assumption is that B is composed of similar 1.2 M☉ PMS stars in a close ( 1 AU) binary system. This inference is supported by line-shape changes in near-IR spectroscopy of B, tentatively interpreted as changing RV among components in V773 Tau B.
Relative photometry indicate that B is highly variable in the near-IR. The most likely explanation for this variability is circum-B material resulting in variable line-of-sight extinction. The distribution of this material must be significantly affected by both the putative B multiplicity, and the A-B orbit.
1 Introduction
V773 Tau (catalog V773 Tau) (HDE 283447, HBC 367) is among the most remarkable pre-main sequence (PMS) stellar systems presently known. V773 Tau exhibits a broad variety of observable properties traceable to its PMS status, circumstellar material, and multiplicity. V773 Tau was first identified as a T Tauri star by Rydgren et al. (1976) based on H and Ca II H and K emission, high lithium abundance, photometric variability, and K2 spectral type. The object presented an enigmatic mixture of classical (CTTS) and weak-lined T Tauri (WTTS) characteristics until it became clear there are multiple components; V773 Tau was resolved as a visual binary independently by Ghez et al. (1993) and Leinert et al. (1993) (with visual components designated here as A and B). Martín et al. (1994) first suggested, and Welty (1995) established A as a short-period (51-d) double-lined spectroscopic binary (SB2). In filled-aperture high-angular resolution studies, Duchêne et al. (2003, herein D2003) and Woitas (2003) independently identified an additional, “infrared” component in the system (herein designated C – note D2003 use an alternate component notation), making V773 Tau at least a compact quadruple system with no fewer than four stars within roughly 100 AU.
The SB2 A subsystem was resolved by near-IR (Boden et al., 2007, herein B2007) and radio (Phillips et al., 1996, B2007) interferometry, allowing physical orbit reconstruction and component dynamical mass estimates (B2007). Further, the variable radio emission and resolved morphology has been studied to infer magnetospheric interaction and complicated emission topology (Massi et al., 2002, 2006, 2008, and references). Finally in a companion paper to this one, the VLBA astrometric study of Torres et al.. (2011, herein T2011) has refined the V773 Tau A orbit and revisited the system distance by both orbital and trigonometric parallax, indicating that the system is at 132.8 2.4 pc (an earlier VLBI trigonometric parallax by Lestrade et al., 1999, had estimated 148.4 5.5 pc, while the B2007 orbital analysis yielded 136.2 3.7 pc).
Since the D2003 results and modeling, near-IR imaging and spectroscopic monitoring of V773 Tau (combined with B2007 results on A) have yielded important additional clues to the nature of the B component. Here we will report on this continued monitoring, and what data taken over the past few years imply about the B component of this remarkable system.
2 Observations
We report on three types of new observations of V773 Tau. New resolved adaptive optics (AO)-corrected imaging from various telescopes provides relative astrometry and photometry among the V773 Tau components. New spectroscopic observations yielding radial velocity (RV) measurements of the two A constituents (following data presented in B2007) extend the time baseline for both A and A-B orbit modeling. Finally, AO-resolved near-IR spectroscopy separates the emission from A and B for the first time, and appears to show photospheric lines from multiple stellar components for both A and B. We will discuss each data set in turn.
2.1 Imaging
Since the time of D2003 we have continued to monitor the V773 Tau system in imaging. As typical apparent spacings between the outer components in the system are well under an arcsecond, adaptive optics-corrected imaging is required to resolve these visual components. Figure 1 illustrates a spatially-resolved K-band image of V773 Tau from 2008 Oct 22 obtained with the facility AO system (Wizinowich et al., 2000) and the NIRC2 instrument (PI: K. Matthews) on the Keck II telescope in Mauna Kea HI.
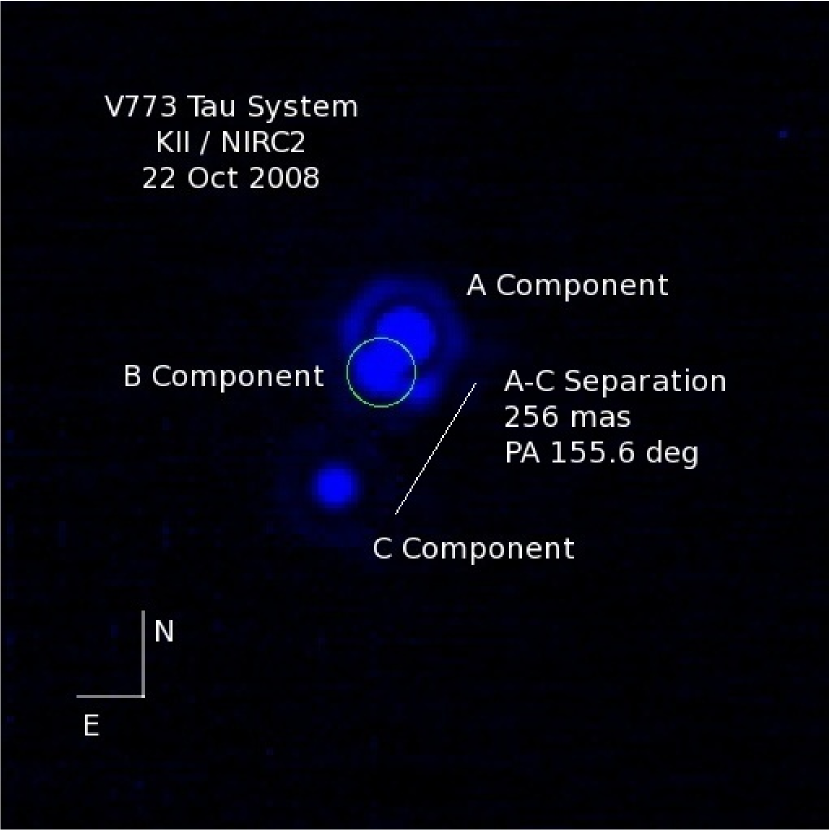
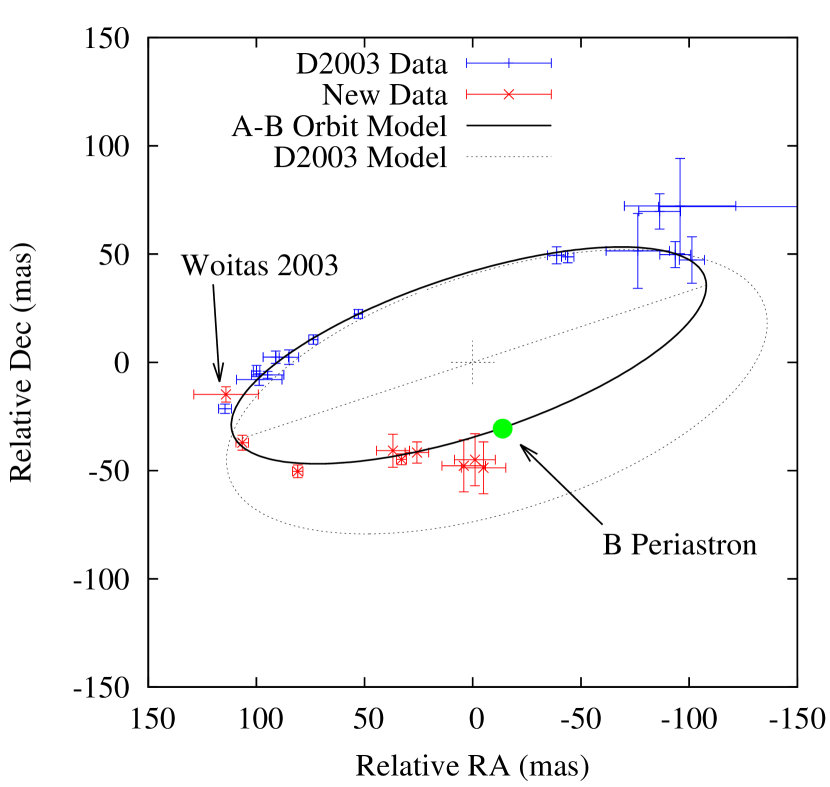
Table 1 summarizes the eight new resolved imaging data sets available to us since D2003, including derived relative astrometry and relative photometry. Seven of these data sets were obtained at Keck with NIRC2, and one was produced by the VLT/NACO system (Rousset et al., 2003; Lenzen et al., 2003). The relative astrometry and photometry among the A, B, and C components derived from these data was estimated by PSF fitting with IRAF/DAOPHOT, except for the 2008-9 epochs where the A and B components are within one diffraction ring radius (e.g. Fig. 1). For these epochs we used the inner 0.1″ (the “core”) of the C component as a PSF template to model A component light, and estimated B parameters based on residuals to this modeling. The plate scales for NIRC2 and NACO data were taken from Ghez et al. (2008) and Chauvin et al. (2010) respectively. Figure 2 depicts both older (D2003) and new (Table 1) relative A-B astrometry. Significant A-B orbital evolution since the D2003 summary is evident in the new astrometry; we discuss modeling the A-B orbit in § 3.1.
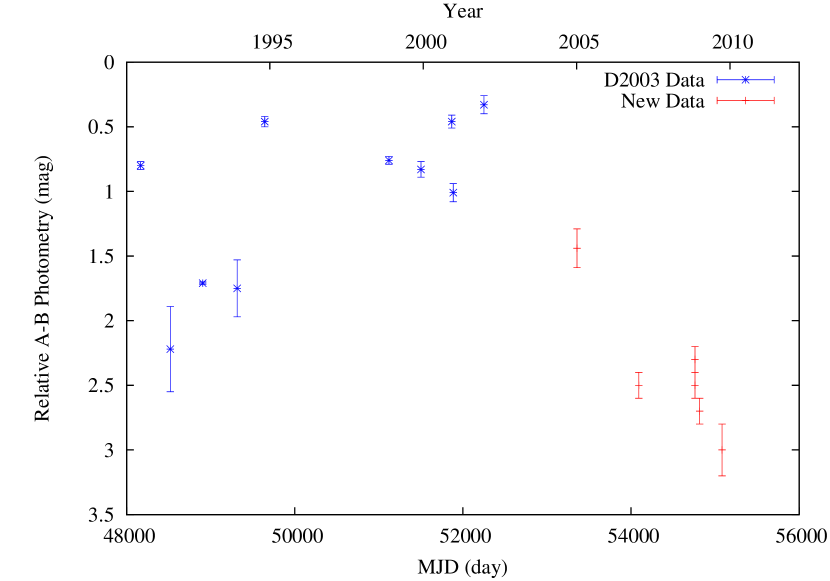
Figure 3 depicts the relative photometry between the V773 Tau A and B components for data with center-band wavelengths within the near-IR -band (2.0 – 2.4 m), including both older data from D2003 (D2003 Table 1) and the new imaging presented here. It is apparent that there is significant relative variability between the two components; the data indicate relative variability of up to 2.5 magnitudes – nearly a magnitude more than had been reported in D2003. D2003 argued that the A subsystem is photometrically stable, so presumably this large variability is due to the B component. D2003 further argued that this variability resulted from circumstellar material, an issue we will return to in § 4.
| Epoch | MJD | Tel/Inst | Filter | A-B | A-C | ||||
|---|---|---|---|---|---|---|---|---|---|
| (mas) | PA (deg) | m (mag) | (mas) | PA (deg) | m (mag) | ||||
| 2004 Dec 19 | 53358 | KeckII/NIRC2 | 112.8 1.9 | 109.2 1.2 | 1.44 0.15 | 249 4 | 151.7 1.4 | 2.2 0.7 | |
| 2006 Dec 24 | 54093 | VLT UT4/NACO | 95.3 1.3 | 121.9 1.3 | 2.5 0.1 | 254.5 1.3 | 152.4 1.0 | 2.08 0.02 | |
| 2008 Oct 22 | 54761 | KeckII/NIRC2 | 55.0 5.0 | 137.9 5.4 | 2.3 0.1 | 250.0 1.8 | 155.3 0.3 | 1.95 0.03 | |
| 2008 Oct 22 | 54761 | KeckII/NIRC2 | 55.6 1.8 | 143.7 1.4 | 2.5 0.1 | 249.1 1.0 | 155.2 0.2 | 2.10 0.02 | |
| 2008 Dec 18 | 54818 | KeckII/NIRC2 | Br- | 49.0 3.0 | 148.2 4.5 | 2.7 0.1 | 250.5 1.0 | 155.6 0.3 | 2.41 0.01 |
| 2009 Sep 09 | 55083 | KeckII/NIRC2 | 48.0 2.0 | 175.6 6.0 | 3.3 0.2 | 244.8 1.2 | 156.3 0.3 | 3.10 0.03 | |
| 2009 Sep 09 | 55083 | KeckII/NIRC2 | 45.0 2.0 | 181.3 2.5 | 3.0 0.2 | 246.0 1.0 | 156.9 0.2 | 2.32 0.03 | |
| 2009 Nov 29 | 55164 | KeckII/NIRC2 | 49.0 4.0 | 185.8 3.5 | 3.1 0.2 | 244.0 2.0 | 156.5 0.3 | 2.27 0.04 | |
2.2 Radial Velocities
Welty (1995) established V773 Tau A as an SB2 in spatially unresolved optical spectroscopy, and Welty (1995) and B2007 estimated the A orbit from RV measurements of both components. Remarkably, no signs of other V773 Tau components have been found in such optical spectroscopy – a point we will return to in § 4. Since B2007 we have continued to monitor A in high-resolution optical spectroscopy, and have obtained eight additional RV observations of both A components from the 1.5m telescope on the Fred L. Whipple Observatory (FLWO) on Mt. Hopkins, AZ (see discussion in B2007). Further, the entire RV dataset has been re-reduced for this analysis, now including both corrections for the systematic effects of finite spectrometer passband (a discussion of these corrections is given in Torres et al., 1997), and individual RV uncertainties estimated from the corresponding spectra SNR (as opposed to ensemble statistics as was done in B2007). The resulting refinement of the A-subsystem orbit model with this revised RV set is discussed in T2011.
Additionally, for the purposes of A-B orbit analysis here the double-lined A RV measurements also serve to probe the A barycenter kinematics, complementing the A-B astrometry. Straightforwardly, the A-barycenter RV is derivable from A-component RV and the component mass ratio () as:
| (1) |
Equation 1 codifies the coupling of the A- and A-B subsystem orbits in the A-component RV observables. We return to the joint modeling of the A and A-B orbits with these observables in § 3.1.
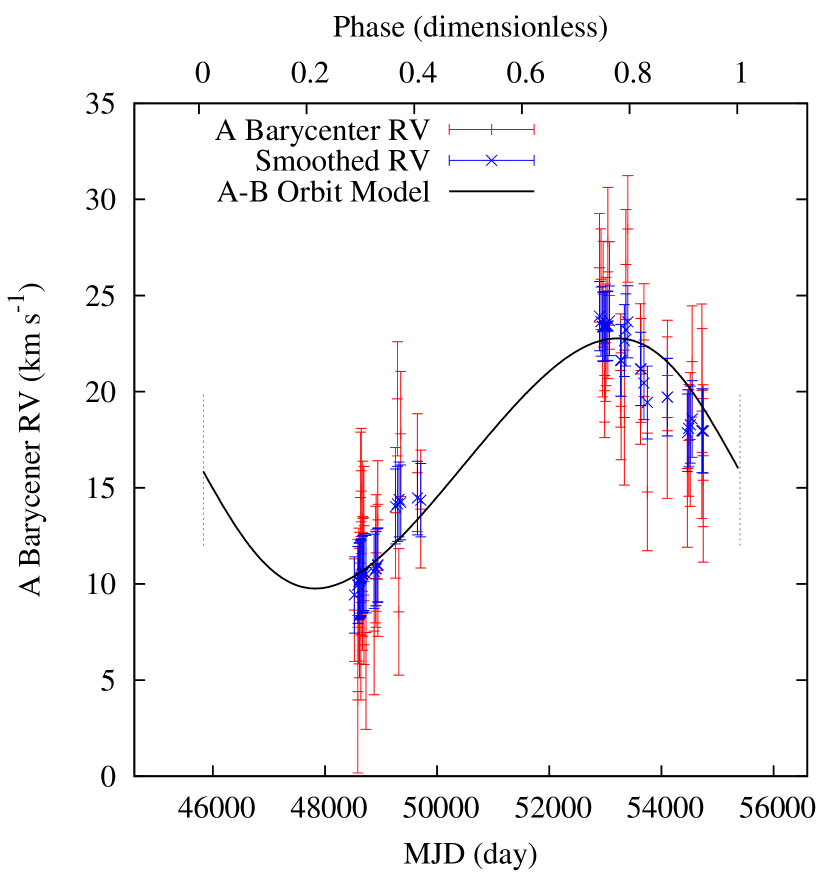
Table 2.2 gives a full listing of all A-subsystem component RV and derived A-barycenter RV for = 0.831 0.031 (see § 3.1); these A-barycenter RV and A-B orbit model are depicted in Figure 2. (Note that the A-component velocities in Table 2.2 are presented without correction for A-subsystem motion. This is different from the presentation in B2007, where a model of the A-barycenter motion was removed from the velocities reported in B2007 Table 3.) The derived A-barycenter velocities show roughly 5 km s-1 of scatter on short timescales; this is consistent with the single-measurement precision of the V773 Tau Ab RV (see B2007 Table 3 and here Table 2). But the derived A-barycenter velocities also show clear and variable acceleration over time, and a 13 km s-1 offset between the two RV data segments separated by 5000 days. It is evident that these derived A-barycenter velocities contain useful kinematic information for modeling the A-B orbit.
2.3 Spatially-Resolved Near-Infrared Spectroscopy
In order to determine the spectral type of V773 Tau B, and in an attempt to resolve the A component into a near-infrared double-lined spectroscopic binary for the first time, we observed V773 Tau using the near-infrared cross-dispersed spectrograph NIRSPEC (McLean et al., 2000) behind the Keck II AO system in two epochs (2003 Dec 11 and 2006 Dec 16, Table 1). In both cases, we obtained band spectra aligning the slit with the A-B subsystem. We obtained six 150s-integration with the 0013 slit in 2003, and four 300s frames with the 0041 slit in 2006 in AB dither patterns along the length of the slit. In both epochs, we observed an early A-type star (HD 27962/HR 1389 (catalog HD~27962) in 2003, HD 34203/HR 1718 (catalog HD~34203) in 2006) immediately following V773 Tau to estimate the telluric transmission. The resolution of the spectra from 2003 is R40000 and from 2006 is R25000.
The basic data reduction was performed with REDSPEC, a software package designed for NIRSPEC111http://www2.keck.hawaii.edu/inst/nirspec/redspec/index.html. Object frames are reduced by subtracting opposing nods to remove sky and dark backgrounds, dividing by a flat field, and correcting for bad pixels. Individual spectral orders are spatially rectified by fitting the trace of the A0 calibrators with third order polynomials which are then applied to target images. The wavelength solution is determined using the etalon lamps that are part of the NIRSPEC lamp suite (Figer et al., 2003). The absolute value of the etalon lines are calibrated using the telluric features in our A0 calibrators (Konopacky et al., 2010). The wavelength solution is modeled with a second-order polynomial.
Extraction of the A and B components from the reduced and rectified frames is a challenge as cross-contamination is possible. This is particularly true of the 2006 epoch, where the separation was less than 01 and the A/B flux ratio had increased from previous epochs (e.g. Table 1, Figure 3). In both 2003 and 2006, we opted to extract the spectra by fitting a Gaussian to the trace of one visual component and subtracting the fit result from the frame to leave only the other component. In 2003, we allowed the FWHM of the Gaussian to vary with wavelength. In 2006, the two components are too closely blended to fit for the FWHM; instead, we fixed the FWHM to the value found for the telluric calibrator. The remaining trace in the frame was then extracted by multiplying the flux by a normalized Gaussian fit by the same method (Konopacky et al., 2010). We then removed the telluric features from the spectra by dividing by the extracted A0 calibrator spectra. In order to use the A0 star to correct the order containing Br, we fit the Br line in the A0 stars with a Lorentzian profile, which we subtracted out of the spectrum before dividing.
There are four useful orders for which spectra were extracted, covering the approximate ranges 2.10–2.13 m, 2.16–2.19 m, 2.22–2.26 m and 2.29–2.32 m. Samples of these spectral orders are given in Figure 4.

3 Analysis
3.1 A-B Orbit Modeling
At the time of D2003 considerable orbital evolution was apparent in resolved imaging (and resulting relative astrometry) of the V773 Tau A-B pair (e.g. Tamazian et al., 2002; Woitas, 2003, D2003; Figure 2), but it had not yet completed even half a full orbit since the 1990 discovery of B (Ghez et al., 1993). Both Tamazian et al. (2002, herein T2002) and D2003 made preliminary estimates of the A-B orbit based on early astrometry, but with the limited phase coverage of the data these two analyses came to significantly different conclusions about the A-B orbit.
In the present work we have augmented the D2003 astrometry dataset with the new astrometry presented above (Table 1, plus one new astrometric point presented in Woitas (2003)), and the radial velocity observations presented above (Table 2.2). Figure 2 depicts expanded relative astrometric and radial velocity data sets and our updated orbital modeling (Table 3) for V773 Tau A-B. In particular the left panel depicts the available set of relative astrometry on the A-B pair, and both the D2003 and our orbit model visual trace. Older astrometry summarized in D2003 (specifically D2003 Table 1) is rendered in blue, while newer astrometry derived from imaging reported here is rendered in red. Figure 2 right panel shows (derived) A subsystem barycentric radial velocity (§ 2.2; Table 2.2) and the radial velocity trace from our model orbit. Figure 2 right also shows a rendering of the A-barycenter RV smoothed at the A-subsystem period (51.1d; B2007). This rendering is provided to illustrate the A-barycenter RV content relevant to the A-B orbit modeling, these smoothed data are not used in the orbit modeling.
| Orbital | T2002 | D2003 | Joint Solution |
|---|---|---|---|
| Parameter | (This Work) | ||
| Period (yr) | 125.0 6.0 | 46.0 6.0 | 26.20 1.1 |
| T0 (yr) | 1998.62 3.0 | 1996.5 0.8 | 2010.53 1.0 |
| 0.643 0.04 | 0.30 0.10 | 0.099 0.026 | |
| KA (km s-1) | 6.50 0.50 | ||
| (km s-1) | 16.30 0.51 | ||
| (deg) | 299.4 10.0 | 81 10 | 94 17 |
| (deg) | 101.1 7 | 288 1 | 288.2 1.0 |
| (deg) | 63.8 5 | 66 3 | 71.48 0.78 |
| (mas) | 249 15 | 140 10 | 115.5 3.4 |
Note. — Summarized here are the orbital parameters for the A-B subsystem as estimated by T2002, D2003, and present results from our joint modeling of the V773 Tau A and A-B orbits. is the argument of periastron for the A subsystem, and is quoted in a position angle convention. and from T2002 appear particularly discrepant from the other work summarized here. We present these parameters as they are listed in T2002 Table 2, but the general agreement of the A-B orbit orientation depicted in their Figure 1 and our Figure 2 leads us to speculate that and may have been reversed as they are listed in T2002 – bringing them into much better agreement with other results.
Table 3 lists the parameters for the A-B orbit as estimated here and in the earlier work from T2002 and D2003. Using input relative astrometry (e.g. Table 1) and A-barycenter RV (Table 2.2) we made initial estimates of the A-B orbit using both Marquardt-Levenberg least-squares and Bayesian modeling techniques, and found good agreement in the results from these two methods (see orbit modeling descriptions in Boden et al., 2000; Torres et al., 2002; Boden et al., 2005). Our final refinement of the A-B orbit model was made by joint modeling of both the A and A-B subsystem orbits simultaneously, coupling the A-component RV data to the two subsystem orbits through Eq. 1, and adding A-subsystem relative astrometry data from the Keck Interferometer (B2007) and VLBA (B2007, T2011) sources. In practice the joint modeling was accomplished by iterative application of Marquardt-Levenberg optimization for the A and A-B models in turn, coordinating the A and A-B RV observables through Eq. 1 between iterations. This process converged in only a few (four) iterations, and resulted in stable solutions for both orbits. The A-subsystem orbit solution is described in the companion paper (T2011) and is found to be in good statistical agreement with the earlier estimate from B2007. It is both notable and relevant to the A-B results that the new RV reduction and joint A/A-B modeling yields a subtly different value for (0.831 0.031) than found in B2007 (0.865 0.032). Additional details on the final A orbit model can be found in T2011.
Focusing here on the A-B portion of the joint solution, we find significant differences between our A-B orbit modeling results and those published previously by T2002 and D2003; e.g. see the visual orbits rendered in Figure 2. Prima facie these differences are due to the greatly expanded data set available here to estimate the A-B orbit. Our modeling is supported both by expanded phase coverage in the relative astrometry (e.g. Figure 2), and the addition of complementary A-barycenter RV data, neither of which was available in earlier work. At present epoch the astrometric dataset covers roughly 73% of the estimated orbit period, compared to only 46% for data available to D2003. Further, the new astrometric data is seen to be particularly important in revealing the orbit’s character: Figure 2 shows that the A-B apparent orbit passed maximum elongation around the time of D2003, and since that time has exhibited remarkably rapid position-angle evolution as the system approaches periastron at roughly the present epoch (Table 3). These differences are most pronounced in the A-B orbit period – our present period estimate (26.2 yr) is roughly half of the value estimated by D2003, and a factor of five smaller than estimated by T2002. Finally the addition of the A-subsystem RV is seen to strongly support the updated A-B orbit modeling.
3.2 V773 Tau B Dynamical Mass
Typically a relative astrometric orbit such as derived here requires the support of radial velocities for both stars (e.g. Torres et al., 2002, B2007, and references therein) in order to yield unambiguous component dynamical masses. However V773 Tau A-B is unique in that it is supported by the A subsystem binarity, and the analyses of the A subsystem by B2007 and T2011 – providing both A subsystem total mass and distance. When combined with these two items the orbit model in Table 3 allows an unambiguous estimate for the B component dynamical mass.
| Parameter | Value | Note |
|---|---|---|
| System Distance (pc) | 132.8 2.4 | T2011 |
| A-subsystem Mass (M☉) | 2.91 0.20 | B2007; T2011 |
| A-subsystem Luminosity (L) | 3.93 0.38 | B2007 |
| A-B Semi-Major Axis (AU) | 15.35 0.45 | |
| A-B System Mass (M☉) | 5.27 0.65 | |
| B Mass (M☉) | 2.35 0.67 | § 3.2 |
| B Luminosity (L☉) | 2.6 0.6 | § 4 |
Note. — Summarized here are the physical parameters for the A-B subsystem as given by previous results and derived here. Note we use the preferred composite distance estimate from T2011 as the basis for these computations, but other variations are possible – please refer to comments in the text for more detail.
Table 4 summarizes the computed physical properties for the A-B components. In particular the new quantities provided by the A-B orbit are the A-B physical semi-major axis and B dynamical mass. Adopting the T2011-favored composite system distance of 132.8 2.4 pc, the resulting A-B semi-major axis is 15.35 0.45 AU, and the B dynamical mass is 2.35 0.67 M☉. This large value for the B component mass is completely unexpected (e.g. see discussion in D2003), and makes B’s mass comparable to that for A. However note that the T2011-estimated A subsystem mass corresponds to an A-subsystem orbital distance of 135.7 3.2 pc. Using the A-subsystem orbital distance to interpret the A-B orbit presented here (thereby placing the A and B dynamical masses on a consistent distance basis), the resulting SMA and B mass are 15.67 0.46 AU and 2.69 0.67 respectively. While we recommend the former values based on the T2011 composite distance estimate as probably more accurate, the latter values represent viable alternate (and statistically consistent) estimates based on present data.
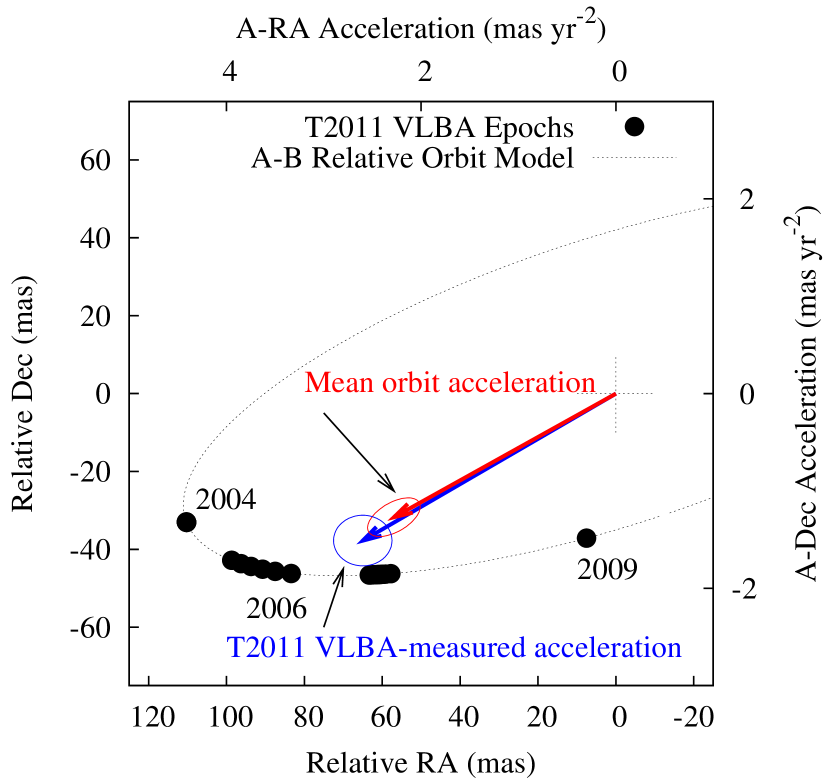
The companion VLBA study of T2011 offers the unique opportunity to cross-check our B dynamical mass estimate through independent means. In modeling the VLBA data on V773 Tau A, T2011 find it necessary to account for the A-B orbital motion as an effective mean acceleration over the time interval of their data. This situation is depicted in Figure 5. At each of the epochs of the T2011 VLBA observations the B mass accelerates A toward B’s position. With our A-B orbit model (Table 3), B dynamical mass, and system distance (Table 4) we can estimate the instantaneous A acceleration, and the resulting average acceleration over the 27 VLBA epochs (T2011 Table 1). When we do, we estimate the average sky-projected acceleration to be = 2.28 0.65 mas yr-2, = -1.27 0.36 mas yr-2 As shown in Figure 5, this value is well-within 1- agreement with the VLBA-measured mean acceleration ( = 2.60 0.60 mas yr-2, = -1.51 0.52 mas yr-2; vector and uncertainty ellipse rendered in blue) from T2011. The consistency of these two independent acceleration estimates imply that our A-B orbit model and B dynamical mass are reliable at their stated uncertainties.
3.3 Near-Infrared Spectroscopic Results for V773 Tau B
The extracted NIRSPEC spectra for V773 Tau A and B are shown in Figure 4. At first glance, the -band spectra of V773 Tau A and B appear very similar, suggesting that the B component has a K-type spectral type, similar to A. Unfortunately, our cross-dispersed spectra do not include the strongest photospheric features of late-type stars (Na doublet at 2.20 m, Ca triplet at 2.26 m), so we have to rely on somewhat weaker features to estimate the spectra type of V773 Tau B. The strongest features in our spectra are an Mg doublet and two Al lines in order 36, H Br, Si, Ti and Fe lines in order 35, weak Fe and Ti lines in order 34, and the CO (2–0) forest and the first two bandheads in order 33. The various line ratios are very similar for components A and B, although all lines appear weaker in B than in A. This may be due to contamination by emission from hot circumstellar dust (veiling) or by the presence of a hotter (hence almost featureless) unresolved component.
We compared our spectra to several published libraries of band spectra for field stars (Kleinman & Hall, 1986; Wallace & Hinkle, 1996; Ivanov et al., 2004; Rayner et al., 2009) as well as to the Gemini/GNIRS spectral library222http://www.gemini.edu/sciops/instruments/nearir-resources/?q=node/10167 to estimate the spectral type of both components. For the A component, we infer a K1–K3 spectral type in good agreement with the system’s consensus spectral typing, while for the B component, we find a K2–K5 spectral type. The slightly later type for B is driven by 1) the slightly weaker Si line at 2.187 m (with respect to the nearby Ti-Fe blend at 2.189 m), and 2) the slightly more marked “shoulder” just longward of the first CO bandhead around 2.295 m. Still, considering the limited sampling in spectral types of the libraries we used and the possibility of veiling in the B component, we acknowledge that both components may well have the same spectral type and that both estimates could be systematically offset.


Inspection of the V773 Tau A spectra revealed that the profile of the strongest photospheric lines were asymmetric in both epochs, with a red “shoulder” in 2003 and a “blue” one in 2006. To illustrate this point we extracted the profiles of the four strongest isolated lines in our spectra (Mg 2.107m, Al 2.110m, Al 2.117m and Ti 2.189m – the line split of the Ti/Si 2.179m doublet is just large enough to prevent us from using this feature in the average profiles) and computed the average profile using the relative strength of the line as a weight. The resulting line profiles (Figure 6 left panel) indicate that we have resolved V773 Tau A as a double-lined spectroscopic binary in the near-infrared, despite the relative large rotational broadening (B2007). The Ab component is detected offset from Aa at about +60 km/s in 2003 and at about 75 km/s. These velocity offsets are in good agreement with the predictions from A-subsystem orbit modeling (+54.4 km/s and 70.9 km/s in 2003 and 2006 respectively; B2007).
We further generated similar average line profiles for V773 Tau B in both epochs. We find the average line profile to be symmetric in 2003 but much broader and most likely double-lined in 2006 (with a relative radial velocity of about 80 km/s for component Bb relative to Ba). If confirmed in future observations of the system, this is the first direct evidence supporting the inference that V773 Tau B is itself an unresolved binary.
4 Discussion
The most notable result from this analysis is the large value for the V773 Tau B dynamical mass, 2.35 0.67 M☉. This B-mass value is implied by the A-B orbit modeling described here, and independently supported by the companion VLBA study of T2011. The B dynamical mass estimate makes B comparable to, but slightly less massive than the A subsystem. Further, this B mass, along with the estimated luminosity (see below) and signs of double-lined features in our near-IR spectra (§ 3.3) suggests that like A, B is also a multiple stellar system. Before we discuss the implications of these results we need to consider the luminosity of V773 Tau B.
In modeling the V773 Tau B SED, D2003 found a range of possible solutions as a function of possible line-of-sight extinction. In particular:
“With an additional 1 mag of extinction at toward V773 Tau [B], we find that its SED is well fitted by a K7 dwarf with a luminosity of 2.3 0.3 L☉; a significant excess at ’ remains present although the - and -band fluxes are then consistent with photospheric levels.”
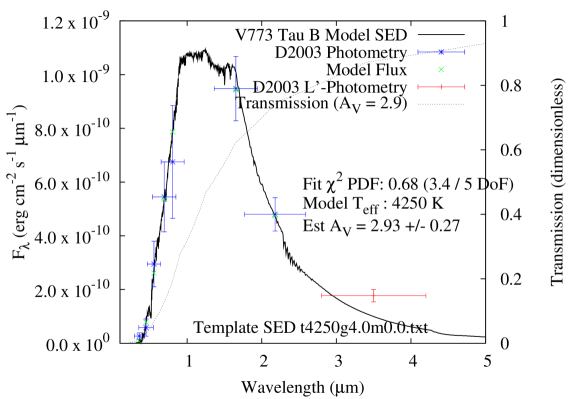
Here we model the V773 Tau B spectral energy distribution (SED) informed by the mid-K spectral type determination from § 3.3. Resolved B photometry (White & Ghez, 2001, D2003) are well-fit by a range of mid-K SED templates (T 4100 – 4300 K) from Pickles (1998), Lejeune et al. (1997), and PHEONIX (e.g. Allard et al., 2000), attenuated by considerable line-of-sight extinction (e.g. 3 mag). To facilitate comparison with B2007 results on V773 Tau A, Figure 7 presents a model derived from the same template family (solar-abundance Kurucz-Lejeune template at Teff = 4250 K and g = 4.0). This model clearly fits the available photometry well (/DOF = 0.68), and results in a B-luminosity estimate of 2.6 0.5 L☉ with of 2.9 0.3 mag. This extinction is roughly one magnitude higher in than reported toward A ( = 1.8 0.2 mag) in B2007; taking the A extinction value as interstellar this suggests a circum-B source for the one magnitude of additional extinction found here. Like D2003, our SED modeling also finds a marginally significant ’ excess, further reinforcing the hypothesis that there is circum-B material reprocessing radiation from B. However, the interpretation of this B SED modeling is complicated by the fact that B is seen to be variable (Figure 3), and the input data (White & Ghez, 2001, D2003) are not contemporaneous.
The combination of our B-component dynamical mass (2.35 M☉) and luminosity estimate (2.6 L☉) suggests a multiple system interpretation. For instance, D’Antona & Mazzitelli (1997) models predict a luminosity of 17 L☉ and Teff 6200 K for a 3 Myr (B2007) single star at 2.35 M☉. (Note that a 1- excursion downward in the mass estimate – 1.7 Msun – would predict 2.8 L☉ and 5200 K from these same models.) Such a B-luminosity and temperature would seem to be impossible based on determinations presented here. However assuming the simplest multiple configuration for B as a binary arrangement with a pair of 1.175 M☉ stars, the D’Antona & Mazzitelli (1997) models predict a pair of such stars to have a total luminosity of 2.6 L☉, and Teff 4800 K, in better agreement with the findings here. While mass arguments alone would not exclude a single star interpretation, combined with double-lined indications in the near-IR spectroscopic analysis (§ 3.3), the circumstantial case that V773 Tau B is a multiple stellar system seems strong. However, experience (e.g. T2002, D2003) has shown that one must consider the present A-B orbit model as preliminary pending additional phase coverage, and the B-mass estimate is still significantly uncertain ( 29% 1-).
Photometric variability in V773 Tau has typically been attributed to the B component (D2003; Figure 3), and interpreted as changing line-of-sight extinction from circum-B material. This interpretation is at least complicated both by potential B multiplicity, and by the physical size of the A-B orbit (15.3 AU, Table 4). Dynamical studies (e.g. Artymowicz & Lubow, 1994; Pichardo et al., 2005) indicate that stable regions for diffuse material are offset from binaries by several times the orbital semi-major axis. Presumably the outer radius of any stable circum-B orbit should be on the order of 15 / 3 5 AU. Similarly, the typical size of a putative B subsystem should be several times smaller than this 5 AU scale – probably 1 AU – making the working model for B a short-period binary. In this picture, circumbinary material in the approximately 2–5 AU range would be responsible for both the near-infrared excess and photometric variability of B. The large amount of dust needed to explain both extinction and variability (see below) raises the question whether it could remain dynamically stable in the region between B as a putative short-period binary and the larger A-B orbit, and whether such a reservoir of material would show other observable signatures such as detectable thermal IR and millimeter flux. As a system V773 Tau shows a large mid-IR flux above photspheric levels (e.g. Prusti et al., 1992, D2003, Spitzer Taurus Legacy program, Padgett et al. 2011 in prep), and Andrews & Williams (2005) lists significant flux at 850 m and 1.3 mm. However the presence of the V773 Tau C component (D2003, Woitas, 2003) significantly complicates the interpretation of these flux measurements. A spatially-resolved mm study with a sensitive facility such as ALMA would clarify the distribution of circumstellar material in the V773 Tau system.
If the putative B variability is due to changing line-of-sight extinction, this degree of variability is extraordinary. To account for the amplitude of the -variability shown in Figure 3, a variation in of up to 25 mag (assuming ISM-like dust opacity) would be indicated. Such large excursions seem discrepant with the results of the SED modeling above. A more plausible alternative might be an optically-thick structure – perhaps a disk that may or may not be perturbed by complicated dynamics – obscuring the line-of-sight to B components, allowing only a small amount of scattered light to reach the observer. Variability on short timescale could be related to one of the components of B temporarily coming into direct view along its orbit, akin to the KH 15D system (Herbst et al., 2010, and references therein). The current sampling of the light curve for B is too sparse to decisvely test this hypothesis. In either case, this large attenuation could explain why no clear detection of B is seen in extensive optical spectroscopic monitoring (Welty, 1995, B2007, Table 2.2).
If the inference of B multiplicity and circum-B material is correct, then the V773 Tau system seems remarkably similar to the HD 98800 (catalog HD 98800) system, where circumbinary material is found around one but not both binaries in the system (Prato et al., 2001). In HD 98800 the inner B and outer A-B orbit significantly complicates the dynamics of B circumbinary material, leading to an inference of disk truncation and warping (Boden et al., 2005; Akeson et al., 2007; Verrier & Evans, 2007; Pichardo et al., 2008). The apparent increasing system complexity raises questions of stability in V773 Tau. While more information on the B and C components will be necessary to address the specific stability of V773 Tau, it is clear that such complex systems are a common outcome of the star formation process, and can remain stable for Gyr (e.g. Duquennoy & Mayor, 1991; Tokovinin, 2008; Raghavan et al., 2010).
References
- Allard et al. (2000) Allard, F. et al. 2000, ApJ 539, 366.
- Akeson et al. (2007) Akeson, R. et al. 2007, ApJ 670, 1240.
- Andrews & Williams (2005) Andrews, S. & Williams, J. 2005, ApJ 631, 1134.
- Artymowicz & Lubow (1994) Artymowicz, P. & Lubow, S. 1994 ApJ 421, 651.
- Boden et al. (2000) Boden, A., et al. 2000, ApJ 536, 880.
- Boden et al. (2005) Boden, A. et al. 2005, ApJ 635, 442.
- Boden et al. (2007) Boden, A. et al. 2007, ApJ 670, 1214 (B2007).
- Chauvin et al. (2010) Chauvin, G. et al. 2010, A&A 509, 53.
- D’Antona & Mazzitelli (1997) D’Antona, F. & Mazzitelli, I. 1997, Mem. S.A.It., 68, 807
- Duchêne et al. (2003) Duchêne, G. et al. 2003, ApJ 592, 288 (D2003).
- Duquennoy & Mayor (1991) Duquennoy, A. & Mayor, M. 1991, A&A 248, 485.
- Feigelson et al. (1994) Feigelson, E. et al. 1994, ApJ 432, 373.
- Figer et al. (2003) Figer, D. et al. 2003, ApJ 599, 1193.
- Ghez et al. (1993) Ghez, A., Neugebauer, G., & Matthews, K. 1993, AJ 106, 2005.
- Ghez et al. (1997) Ghez, A., White, R., & Simon, M. 1997, ApJ 490, 353.
- Ghez et al. (2008) Ghez, A. et al. 2008, ApJ 689, 1044.
- Hartigan et al. (1994) Hartigan, P., Strom, K., & Strom, S. 1994, ApJ 427, 961.
- Herbst et al. (2010) Herbst, W. et al. 2010, AJ 140, 2025.
- Ivanov et al. (2004) Ivanov, V. et al. 2004, ApJS 151, 387.
- Kleinman & Hall (1986) Kleinman, S. & Hall, D. 1986, ApJS 62, 501.
- Konopacky et al. (2010) Konopacky, Q. et al. 2010, ApJ 711, 1087.
- Kutner et al. (1986) Kutner, M., Rydgren, A., & Vrba, F. 1986, AJ 92, 575.
- Latham (1992) Latham, D. W. 1992, in IAU Coll. 135, Complementary Approaches to Double and Multiple Star Research, ASP Conf. Ser. 32, eds. H. A. McAlister & W. I. Hartkopf (San Francisco: ASP), 110
- Latham et al. (2002) Latham, D. W. et al. 2002 AJ 124, 1144.
- Leinert et al. (1993) Leinert, C. et al. 1993, A&A 278, 129.
- Lejeune et al. (1997) Lejeune, T. et al. 1997, A&AS 125, 229.
- Lenzen et al. (2003) Lenzen, R. et al. 2003, Proc. SPIE 944, 4841.
- Lestrade et al. (1999) Lestrade, J-F, et al. 1999, A&A 344, 1014 (L1999).
- Mason et al. (2001) Mason, B. et al. 2001, AJ 122, 3466.
- Montalbán & D’Antona (2006) Montalbán, J. & D’Antona, F. 2006, MNRAS 370, 1823.
- Martín et al. (1994) Martín, E. et al. 1994, A&A 282, 503.
- Massi et al. (2002) Massi, M., Menten, M., & Neidhofer, J. 2002, A&A 382, 152.
- Massi et al. (2006) Massi, M. et al. 2006, A&A 453, 959.
- Massi et al. (2008) Massi, M. et al. 2006, A&A 480, 489.
- McLean et al. (2000) McLean, I. et al. 2000, Proc SPIE 4008, 1048.
- O’Neal et al. (1990) O’Neal, D. et al. 1990, AJ 100, 1610.
- Onishi et al. (1998) Onishi, T. et al. 1998, ApJ 502, 296.
- Padgett (1996) Padgett, D. 1996, ApJ 471, 847.
- Palla & Stahler (1999) Palla, F. & Stahler, S. 1999, ApJ 525, 772.
- Palla & Stahler (2001) Palla, F. & Stahler, S. 2001, ApJ 553, 299.
- Palla & Stahler (2002) Palla, F. & Stahler, S. 2002, ApJ 581, 1194.
- Pichardo et al. (2005) Pichardo, B. et al. 2005, MNRAS 359, 521.
- Pichardo et al. (2008) Pichardo, B. et al. 2008, MNRAS 391, 815.
- Pickles (1998) Pickles, A. 1998, PASP 110, 863.
- Phillips et al. (1996) Phillips, R. et al. 1996, AJ 111, 918.
- Prato et al. (2001) Prato, L. et al. 2001, ApJ 549, 590.
- Prusti et al. (1992) Prusti, T. et al. 1992, A&A 259, 537.
- Raghavan et al. (2010) Raghavan, D. et al. 2010, ApJS 190, 1.
- Rayner et al. (2009) Rayner, J. Cushing, M., & Vacca, W. 2009, ApJS 185, 289.
- Rousset et al. (2003) Rousset, G. et al. 2003, Proc. SPIE 4839, 140.
- Rydgren et al. (1976) Rydgren, A. Strom, S., & Strom, K. 1976, ApJS 30, 307.
- Siess et al. (2000) Siess L., Dufour E., & Forestini M. 2000, A&A 358, 593.
- Stefanik et al.. (1999) Stefanik, R. P., Latham, D. W., & Torres, G. 1999, in Precise Stellar Radial Velocities, IAU Coll. 170, ASP Conf. Ser., 185, eds. J. B. Hearnshaw & C. D. Scarfe (San Francisco: ASP), 354.
- Tamazian et al. (2002) Tamazian, V. et al.. 2002, ApJ 578, 925 (T2002).
- Tokovinin (2008) Tokovinin, A. 2008, MNRAS 389, 925.
- Torres et al. (1997) Torres, G. et al. 1997, AJ, 114, 2764.
- Torres et al. (2002) Torres, G. et al. 2002, AJ 124, 1716.
- Torres et al.. (2003) Torres, G. et al. 2003, AJ 125, 825.
- Torres et al.. (2011) Torres, R. et al. 2011, ApJ submitted (T2011).
- Verrier & Evans (2007) Verrier, P. & Evans, N. 2007, MNRAS 390, 1377.
- Wallace & Hinkle (1996) Wallace, L. & Hinkle, K. 1996, ApJS 107, 312.
- Walker & Walstencroft (1988) Walker, H. & Walstencroft, R. 1988, PASP 100, 1509.
- Webb et al. (1999) Webb, R. et al. 1999, ApJ 512, L63.
- Welty (1995) Welty, A. 1995, AJ 110, 776 (W1995).
- White & Ghez (2001) White, R. & Ghez, A. 2001, ApJ 556, 265.
- Wizinowich et al. (2000) Wizinowich, P. et al. 2000, Proc. SPIE 4007, 2.
- Woitas (2003) Woitas, J. 2003, A&A 406, 685.