REPORT FROM NA49
Abstract
The signatures of the onset of deconfinement, found by the NA49 experiment at low SPS energies, are confronted with new results from the Beam Energy Scan (BES) program at BNL RHIC and CERN LHC results. Additionally, new NA49 results on chemical (particle ratio) fluctuations, azimuthal angle fluctuations, intermittency of di-pions, etc. are presented.
1 Introduction
The NA49 experiment [1] at the CERN SPS, taking data in 1994-2002, studies an important region of the phase diagram of strongly interacting matter. First, the energy threshold for deconfinement (minimum energy to create a partonic system) was found at low SPS energies [2, 3]. Second, theoretical QCD-based calculations suggest that the critical point of strongly interacting matter is located at energies accessible at the CERN SPS accelerator (i.e. MeV, MeV) [4]).
2 Onset of deconfinement
The NA49 energy scan program (completed in 2002) was motivated by predictions of the Statistical Model of the Early Stage (SMES) [2] assuming that the energy threshold for deconfinement is located at low SPS energies. Several structures in excitation functions were expected within the SMES: a kink in the increase of the pion yield per participant nucleon (change of slope due to increased entropy as a consequence of the activation of partonic degrees of freedom), a sharp peak (horn) in the strangeness to entropy ratio, and a step in the inverse slope parameter of transverse mass spectra (constant temperature and pressure in a mixed phase). Such signatures were indeed observed in collisions by the NA49 experiment [3], thus locating the onset of deconfinement (OD) energy around 30 GeV ( GeV).
2.1 Verification of NA49 results and interpretation by STAR and ALICE
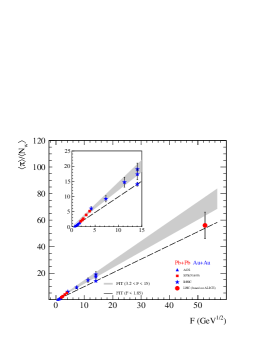
Until recently the evidence of OD was based on the results of a single experiment. Recently new results on central Pb+Pb collisions at the LHC [5] and data on central Au+Au collisions from the RHIC BES program [6] were released. Figure 1 shows an update of the kink plot, where BES points follow the line for collisions and the LHC point 111the mean pion multiplicity at LHC was estimated based on the ALICE measurement of charged particle multiplicity, see [7] for details., within a large error, does not contradict extrapolations from high SPS and RHIC energies.
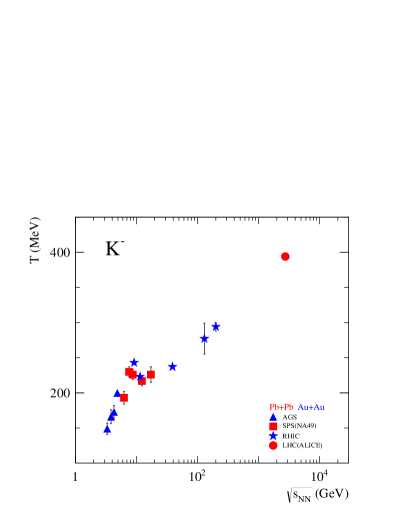
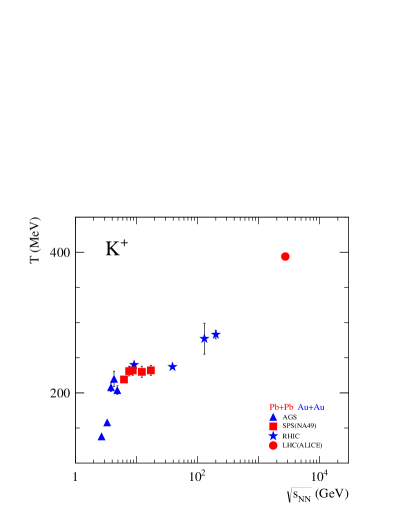
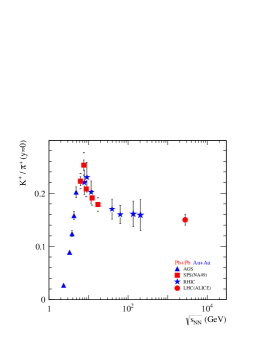
Figure 2 shows inverse slope parameters of kaon transverse mass spectra. The LHC points and the RHIC BES points confirm the step structure expected for the onset of deconfinement. The yield (near midrapidity) is presented in Fig. 3. As seen, RHIC results confirm NA49 measurements at the onset of deconfinement. Moreover, LHC (ALICE) data demonstrate that the energy dependence of hadron production properties shows rapid changes only at low SPS energies, and a smooth evolution is observed between the top SPS (17.2 GeV) and the current LHC (2.76 TeV) energies. All three structures confirm that results agree with the interpretation of the NA49 structures as due to OD. Above the onset energy only a smooth change of QGP properties with increasing energy is expected.
3 New NA49 results on fluctuations
Fluctuations and correlations may serve as a signature of the onset of deconfinement. Close to the phase transition the Equation of State changes rapidly which can impact the energy dependence of fluctuations. Moreover, fluctuations and correlations can help to locate the critical point (CP) of strongly interacting matter. This is in analogy to critical opalescence, where we expect enlarged fluctuations close to the CP. For strongly interacting matter a maximum of fluctuations is expected when freeze-out happens near the CP. Therefore the CP should be searched above the onset of deconfinement energy, found by NA49 to be 30 GeV ( GeV).
3.1 Particle ratio fluctuations
NA49 used to measure dynamical particle ratio fluctuations. is defined as the difference between the relative widths of particle ratio distributions for data and for artificially produced mixed events, where only statistical fluctuations are present (see [8] for details).
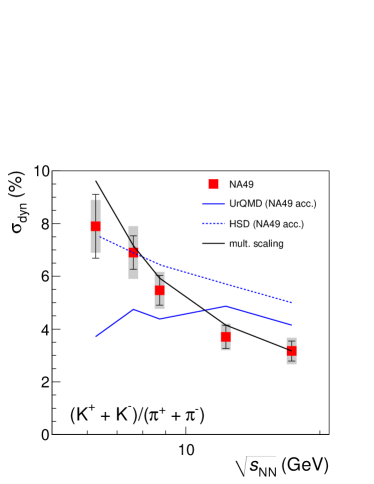
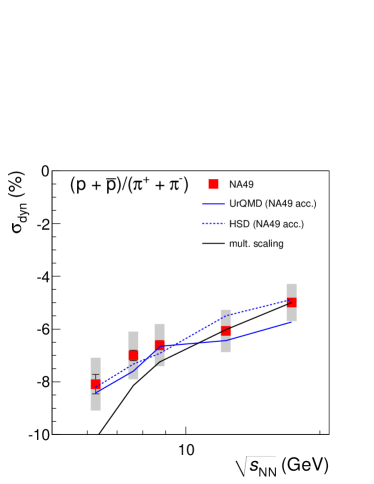
The energy dependence of event-by-event fluctuations of the particle ratios and (for the 3.5% most central Pb+Pb collisions) is shown in Fig. 4. fluctuations show positive values of . The steep rise towards low SPS energies is not reproduced by the UrQMD model. The HSD model catches the trend but over-predicts high energy SPS results. The ratio shows negative dynamical fluctuations. This behavior is reproduced by hadronic models and understood in terms of correlations due to nucleon resonance decays.
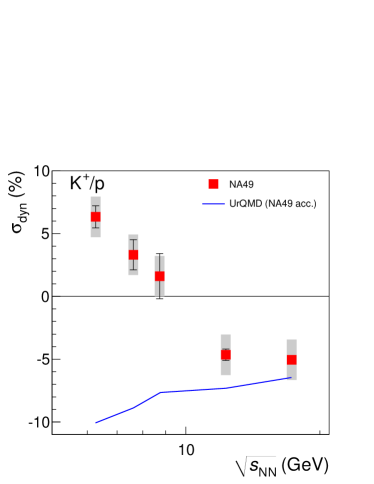
An unexpected result was obtained for event-by-event fluctuations (Fig. 5). Dynamical fluctuations change sign close to the onset of deconfinement energy. A jump to positive values at lowest SPS energies is followed by a negative plateau at higher SPS energies. Such structure is not described by hadronic models (UrQMD and HSD). Additionally we show fluctuations in which no contributions from resonance production are expected. The relation of this intriguing result to the onset of deconfinement is not known yet.
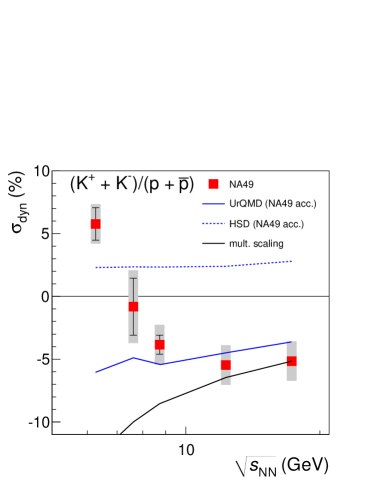
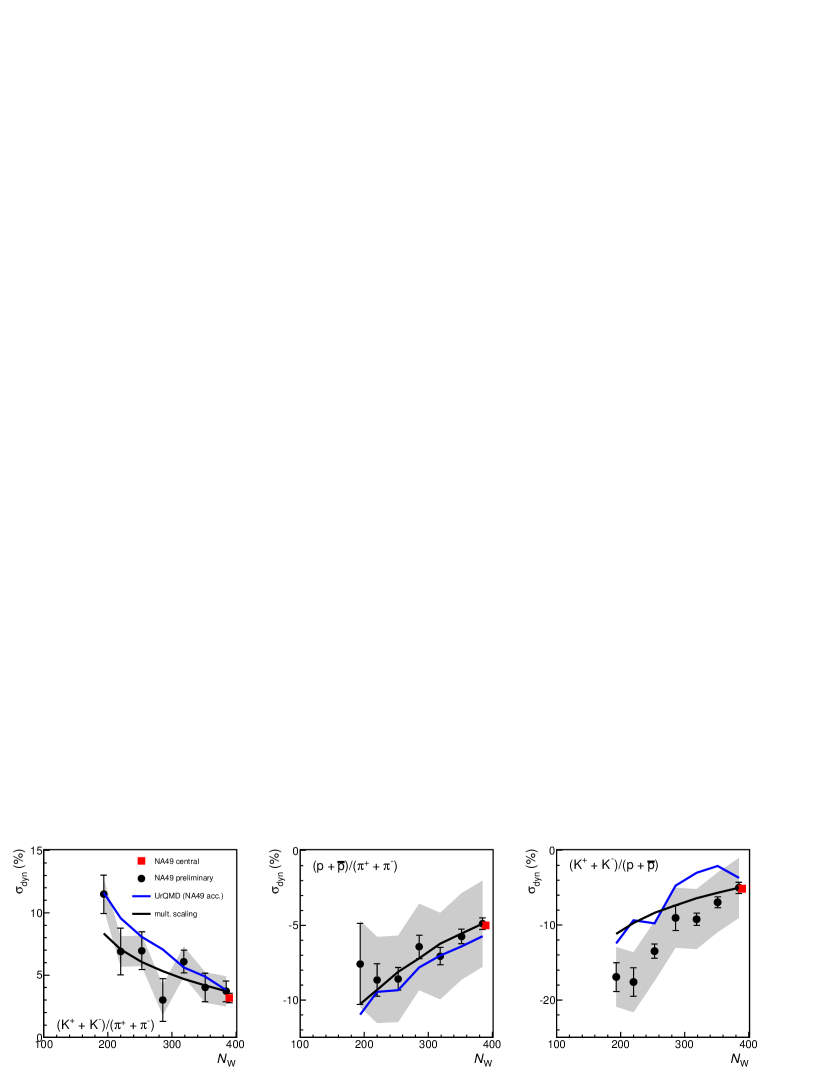
It has been suggested [9] that can be separated into two terms: a correlation strength term and a term purely dependent on multiplicities. In case of unchanged correlations (invariant correlation strength) the general expectation is , where , etc. Such scaling is presented in Figs. 4, 5 as black solid lines. One can see that scaling works very well for and fluctuations. The change of sign in fluctuations excludes any simple scaling based on average multiplicities. The above scaling assumed invariant correlation strength, therefore the NA49 results suggest that the underlying correlation between kaons and protons is changing with energy.
The centrality dependence of event-by-event particle ratio fluctuations at 158 GeV ( = 17.3 GeV) is presented in Fig. 6. The absolute values of fluctuations rise towards peripheral collisions, as in UrQMD. The same multiplicity scaling (as in Figs. 4, 5) seems to hold for all three particle ratio fluctuations (black, solid lines in Fig. 6). This is compatible with the hypothesis that at constant energy the underlying correlations are not significantly changing with the system size.
3.2 Average and multiplicity fluctuations
At the CP enlarged fluctuations of multiplicity and mean transverse momentum are expected [10]. The NA49 experiment used the scaled variance of multiplicity distributions and the measure to quantify multiplicity and average fluctuations, respectively (see [11] for details). The position of the chemical freeze-out point in the () diagram can be varied by changing the energy and the size of the colliding system [12, 11]. decreases from p+p to Pb+Pb interactions at top SPS energy and decreases with increasing energy in Pb+Pb collisions. Therefore NA49 analyzed the energy () dependence of and for central Pb+Pb collisions, and their system size () dependence (p+p, central C+C, Si+Si, and Pb+Pb) at the highest SPS energy.
There are no indications of the CP in the energy dependence of multiplicity and mean fluctuations in central Pb+Pb collisions. However, the system size dependence of both measures at 158 GeV shows a maximum for C+C and Si+Si interactions [11]. The peak is even two times higher for all charged than for negatively charged particles [11] as expected for the CP [10]. This result is consistent with a CP location near the freeze-out point of p+p interactions at the top SPS energy (178 MeV, MeV) (the theoretical magnitude of the CP effect has a maximum close to Si+Si instead of p+p system due to the fact that the correlation length in the model monotonically decreases with decreasing size of the colliding system (see [11] for details).
3.3 Azimuthal angle fluctuations
The main motivation of studying azimuthal event-by-event fluctuations was to search for plasma instabilities [13], critical point and onset of deconfinement, and flow fluctuations [14]. NA49 evaluated the measure of fluctuations (instead of using , as in section 3.2, one uses azimuthal angle ). There are several background effects that can influence the measure, among them resonance decays, flow, (di-)jets, momentum conservation, quantum statistics. All of them were studied in [15].
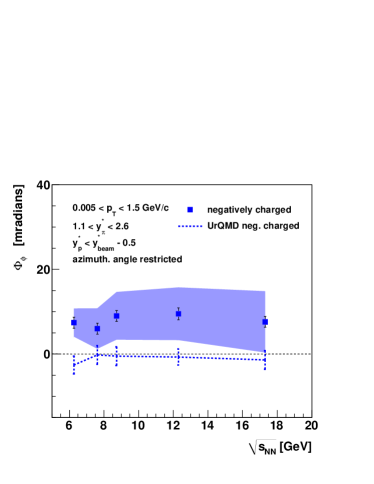
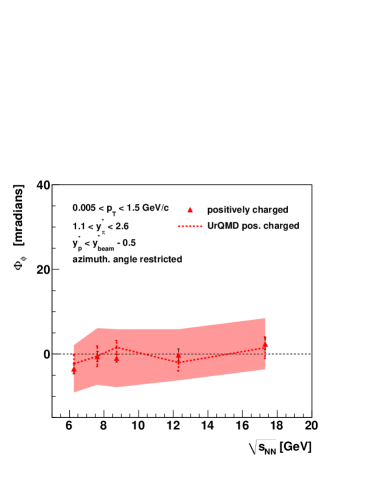
Figure 7 shows the energy dependence of for the 7.2% most central Pb+Pb interactions. Color bands represent systematic errors. The values for positive particles are consistent with zero but for negative particles is positive. No collision energy dependence of the fluctuations is observed.
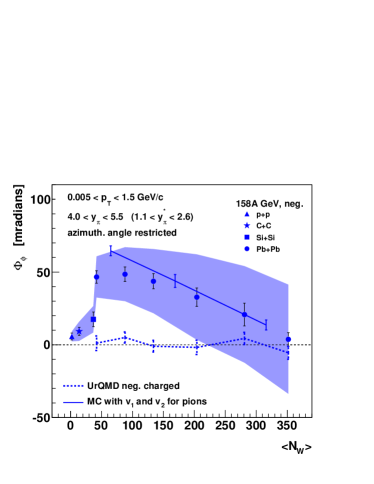
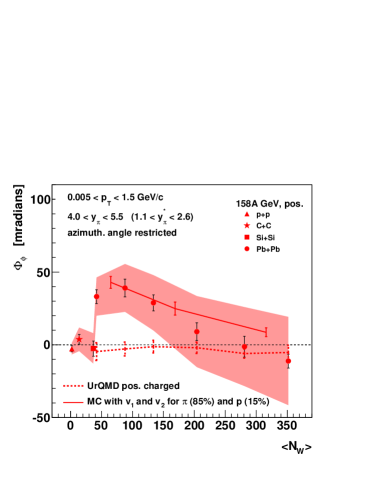
The system size and centrality dependence of at the top SPS energy is presented in Fig. 8. For Pb+Pb collisions, the sample of events was split into six centrality classes. Figure 8 shows positive values with a maximum for peripheral Pb+Pb interactions. The data are not explained by the UrQMD model. However, the magnitude of is reproduced by the effect of directed and elliptic flow [18]. The difference between positive and negative particles is also reproduced and it is caused by a 15% admixture of protons among positive particles (in the MC model calculation [18] and values for pions and protons at forward rapidity were taken from [19]).
3.4 Pion-pion intermittency signal
It was suggested that the analog of critical opalescence may be detectable through intermittency analysis in space. Significant -field fluctuations are expected at the CP (density fluctuations of zero mass -particles produced in abundance at the CP) [20]. particles at may reach the two-pion threshold () and then decay into two pions, therefore density fluctuations of di-pions with close to the two pion mass incorporate –field fluctuations at the CP. Local density fluctuations are expected both in configuration and momentum space.

The NA49 experiment searched for an intermittency signal in transverse momentum space of reconstructed di-pions ( pairs) with invariant mass just above [21]. The analysis was performed for p+p, C+C and Si+Si interactions at 158 GeV. First, for each event all possible pairs with in a small kinematic window above two-pion threshold were selected. Then second factorial moments in transverse momentum space were computed for real data and for artificially produced mixed events where only statistical fluctuations are present. The combinatorial background subtracted (by use of mixed events) moments in transverse momentum space are expected to follow a power-law behavior , with for systems freezing-out at CP [20].
Figure 9 shows that for Si+Si at the top SPS energy measures fluctuations approaching in size the prediction of critical QCD (the remaining departure, instead of , may be due to freezing out at a distance from the CP). As expected, the analysis of Si+Si events generated via the HIJING model shows no intermittency signal (). NA49 (net)proton intermittency analysis is in progress.
4 Summary
The NA49 discovery of the energy threshold for deconfinement is now confirmed. The results from the RHIC Beam Energy Scan agree with NA49 measurements on the onset of deconfinement. LHC data confirm the interpretation of the structures observed at low SPS energies as due to onset of deconfinement.
New NA49 results on fluctuations were presented. The energy and the system size dependence of and fluctuations can be described in a simple multiplicity scaling model. In contrast, fluctuations show a deviation from this scaling and change sign close to the onset of deconfinement energy; is the underlying correlation physics changing with energy? For central collisions fluctuations of average , multiplicity, and multiplicity of low mass pairs tend to a maximum in Si+Si collisions at 158 GeV. Thus the critical point may be accessible at SPS energies. This result is a strong motivation for future experiments and in fact, the NA49 efforts will be continued by the ion program of the NA61/SHINE experiment [22].
Acknowledgments: This work was partially supported by Polish Ministry of Science and Higher Education under grant N N202 204638.
References
- [1] S. Afanasiev et al. (NA49 Collab.), Nucl. Instrum. Meth. A430, 210 (1999).
- [2] M. Gaździcki and M. I. Gorenstein, Acta Phys. Polon. B30, 2705 (1999).
- [3] C. Alt et al. (NA49 Collab.), Phys. Rev. C77, 024903 (2008).
- [4] Z. Fodor and S. D. Katz, JHEP 0404, 050 (2004).
-
[5]
J. Schukraft (for ALICE Collab.), J. Phys.
G38, 124003 (2011);
A. Toia (for ALICE Collab.), J. Phys. G38, 124007 (2011). -
[6]
L. Kumar (for STAR Collab.), J. Phys. G38, 124145 (2011);
B. Mohanty (for STAR Collab.), J. Phys. G38, 124023 (2011). - [7] A. Rustamov, https://indico.cern.ch/conferenceDisplay.py?confId=144745
- [8] T. Schuster (for NA49 Collab.), J. Phys. G38, 124096 (2011) and ref. therein.
- [9] V. Koch and T. Schuster, Phys. Rev. C81, 034910 (2010).
- [10] M. Stephanov, K. Rajagopal, E. V. Shuryak, Phys. Rev. D60, 114028 (1999).
- [11] K. Grebieszkow (for NA49 Collab.), Nucl. Phys. A830, 547C (2009) and references therein.
- [12] F. Beccatini, J. Manninen, M. Gaździcki, Phys. Rev. C73, 044905 (2006).
- [13] St. Mrówczyński, Phys. Lett. B314, 118-121 (1993).
- [14] St. Mrówczyński and E. V. Shuryak, Acta Phys. Polon. B34, 4241 (2003).
-
[15]
St. Mrówczyński, Acta Phys. Polon. B31, 2065 (2000);
T. Cetner, K. Grebieszkow, St. Mrówczyński, Phys. Rev. C83, 024905 (2011). - [16] T. Anticic et al. (NA49 Collab.), Phys. Rev. C79, 044904 (2009).
- [17] T. Anticic et al. (NA49 Collab.), Phys. Rev. C70, 034902 (2004).
- [18] K. Grebieszkow and St. Mrówczyński, arXiv:1110.4910
- [19] C. Alt et al. (NA49 Collab.), Phys. Rev. C68, 034903 (2003).
- [20] N. G. Antoniou et al., Nucl. Phys. A761, 149 (2005).
- [21] T. Anticic et al. (NA49 Collab.), Phys. Rev. C81, 064907 (2010).
- [22] M. Gaździcki (for NA49 and NA61 Collab.), J. Phys. G38, 124024 (2011).