The limited role of mergers in the black hole to bulge mass relation
Abstract
We examine the intrinsic scatter in the correlation between black hole masses and their host bulge masses, and find that it cannot be accounted for by mergers alone. A simple merger scenario of small galaxies leads to a proportionality relation between the late-time black hole and bulge masses, with intrinsic scatter (in linear scale) increasing along the ridge line of the relation as the square root of the mass. By examining a sample of 86 galaxies with well measured black hole masses, we find that the intrinsic scatter increases with mass more rapidly than expected from the merger-only scenario. We discuss the possibility that the feedback mechanism that operated during galaxy formation involved the presence of a cooling flow.
keywords:
black hole physics – galaxies: bulges1 Introduction
Relations between a supermassive black hole (SMBH) mass, , and properties of its host galaxy have been studied intensively for more than a decade. Two of the galactic properties most commonly correlated with are the stellar mass of the spheroidal component (which we refer to as the bulge), (e.g. Kormendy & Richstone 1995; Magorrian et al. 1998; Laor 2001; Hu 2009; Graham & Spitler 2009), and its stellar velocity dispersion, (e.g. Gebhardt et al. 2000; Merritt & Ferrarese 2001; Graham 2008a, b; Hu 2008; Shen et al. 2008; Gültekin et al. 2009). These relations are often assumed to have the form of a power law (i.e. linear when plotted on a log-log scale).
However, due to the scarcity of data, large measurement error and intrinsic scatter, there is still no consensus on which galactic parameter has the best correlation with . Some studies examine different combinations of and ; Feoli et al. (2011), for example, argued that is better correlated with the energy parameter, , than with or with alone. Soker & Meiron (2011) found that a momentum-like parameter is well correlated with , as predicted by the penetrating-jet feedback model (Soker 2009; although this mechanism is based on energy balance).
Some studies consider the – relationship to be the fundamental one, and further argue that mergers between many low mass galaxies from an initially uncorrelated sample can lead to the observed correlation (Peng, 2007; Jahnke & Macciò, 2011; Gaskell, 2011). Peng (2007) claimed that the scatter decreases in logarithmic scale toward higher masses; motivated by his view that ‘fine tuning’ is required in feedback, he claimed that AGN feedback is neither necessary nor desirable to produce the observed correlation. Jahnke & Macciò (2011) added star formation to the growth of galaxies by mergers, and found the decrease in the relative scatter (i.e. in ) to be slower than when only mergers are considered; however, the decrease in the scatter they obtained was still faster than the observed behaviour.
Following these arguments, we examine the scatter increase based on mergers. We expect, as will be further explained in Section 3, that if only mergers cause BH growth, the intrinsic scatter of BH masses will increase as the square root of number of mergers while the mass increases as (thus, the relative scatter will decrease as ). Note that this refers to the intrinsic scatter on linear scale rather than logarithmic scale; the reason for discussing the intrinsic scatter in mass-mass relationships in linear scale will also be made clear in Section 3. We also note that in this work, of a particular galaxy is the number of building blocks that merged over time to form it (cf. ‘generation number’, which is ).
In the current paper, we examine the behaviour of the scatter in the – relationship with mass in order to asses the importance of mergers. The sample of galaxies is discussed in Section 2, and the results in Section 3. In Section 4 we discuss the implications of the results to the feedback mechanism and give a brief summary.
2 The Sample
Our sample of 86 galaxies was compiled from various sources which provided black hole masses , velocity dispersions , and bulge masses . Most objects (60 galaxies) were taken from Graham (2008b) with updated values from Graham et al. (2011). Values of were taken from Feoli et al. (2011) and references therein (table 1 there). Six galaxies with from Gültekin et al. (2009) and from table 2 of Feoli et al.; seven galaxies from Hu (2009, also listed in table 3 of Feoli et al.); five galaxies were taken from Greene et al. (2010); five and three SMBH masses were taken from Peterson et al. (2004) and Bentz et al. (2009) respectively, with and values from Wandel (2002). We adopted the value of 0.18 dex for the error in as Feoli et al.. The error in was taken to be 10 per cent as in Graham et al. (2011). Measurement errors in are as they appeared in the sources listed above. We list all the data used in Table 2.
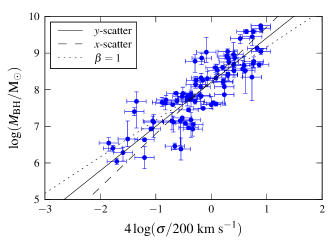
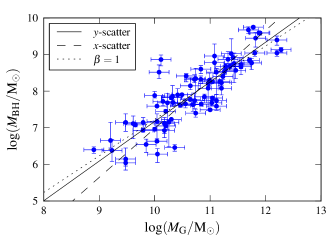
In Fig. 1 we present two correlations that have been thoroughly studied for the past decade: – and –. Previous studies have firmly established that black hole mass is tightly correlated with bulge mass and with the stellar velocity dispersion, with power law relationships commonly assumed (e.g. Kormendy & Richstone 1995; Magorrian et al. 1998; Laor 2001; Wandel 2002; Hu 2009; Graham & Spitler 2009; Graham et al. 2011; Greene et al. 2010; Gültekin et al. 2009; Gebhardt et al. 2000; Merritt & Ferrarese 2001; Tremaine et al. 2002).
In addition to these widely examined relationships, other correlations have been considered in the literature (e.g. Mancini & Feoli 2011). Feoli et al. (2011), for example, suggested that correlates better with than or . Soker & Meiron (2011) presented the momentum parameter as a galactic property which has a proportionality relation with in the penetrating jet feedback mechanism; they verified this relation using a sample of 49 galaxies. We repeat the analysis of the latter (–) and show that this relation holds also for our wider sample of 86 galaxies, as seen in Fig. 2.
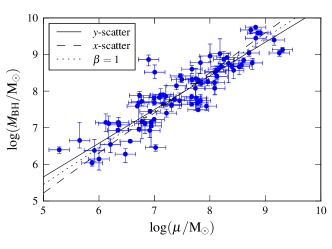
The best-fitting parameters for each correlation are calculated in three ways, or scatter models. A constant residual, , (the intrinsic scatter) is added (as an error) in one of three directions until the sum of square residuals is equal the number of degrees of freedom (the methodology is described in more detail in Soker & Meiron 2011). This method of estimating the intrinsic scatter is due to Tremaine et al. (2002), who considered scatter in just the SMBH mass. The three scatter models considered here give somewhat different results, but none is preferable as the true direction of the scatter depends on the physical mechanism that leads to the correlation (Novak et al., 2006), and cannot be determined from the data. The three scatter models are: (1) -scatter where the is the residual variance in (as in Tremaine et al. 2002 and most studies thereafter); (2) -scatter where is the scatter in the galactic property; and (3) orthogonal scatter where the scatter is added orthogonally to the ridge line. In Table 1 we give three parameters for each of the three correlations in three scatter models. They are similar to those obtained in recent years (e.g. Soker & Meiron 2011, Graham et al. 2011).
| Correlation | Model | |||
|---|---|---|---|---|
| – | -scatter | 0.35 | ||
| -scatter | 0.35 | |||
| orth-scatter | 0.35 | |||
| – | -scatter | 0.32 | ||
| -scatter | 0.38 | |||
| orth-scatter | 0.34 | |||
| – | -scatter | 0.28 | ||
| -scatter | 0.37 | |||
| orth-scatter | 0.29 |
3 The Scatter
We first clarify two confusing issues. One is that the (total) ‘scatter’ of the data points (quantified by the root mean square of the residuals from the best fitting curve) is not the same as the intrinsic scatter, which is a measure of the natural spread of the data. The total scatter has an intrinsic component but is larger due to measurement errors. From here on, we will denote the rms of the residuals by (not to be confused with the stellar velocity dispersion, which will not be mentioned further) and the intrinsic scatter by as in Section 2. The second issue is that while in other works (as well as the previous Section of this paper) the intrinsic scatter was estimated from the logarithmic data and was thus dimensionless, from here on, we will consider the scatter (extrinsic and intrinsic) in linear scale.
We now examine the hypothesis that the correlations are mainly due to mergers. Let us consider a simple scenario of growth through mergers: the building blocks are galaxies with equal initial bulge mass , and initial black hole masses with some distribution with an expected value and variance . After mergers, the bulge mass is , and the black hole masses are normally distributed around with variance . The central limit theorem asserts that will be distributed normally for a given (or equivalently, a given ), independently of the initial distribution, as long as . Thus, this model leads to a proportionality relation between black hole and bulge mass: , with intrinsic scatter which increases as . This result, while derived from a very simplistic model, is consistent with the results of Hirschmann et al. (2010), who studied the evolution of the intrinsic scatter with redshift using cosmological halo merger trees (Genel et al., 2009); this is because the only ‘physics’ involved is convergence toward a Gaussian distribution.
Since , then obviously the square roots of the masses also satisfy a proportionality relation: . The scatter of for a given can be calculated by error propagation:
| (1) |
Thus, this model for galaxy–SMBH co-evolution, which is based on mergers alone predicts an – relation with scatter that does not depend on mass. Since the black hole masses (or their square root) form a normal distributed for a given bulge mass, this is a ‘’-type scatter; relaxing the assumption that the initial bulge masses are identical would lead to a scatter in a different direction.
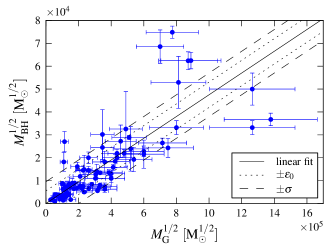
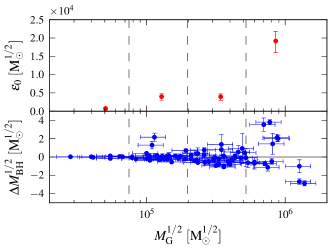
The hypothesis that the scatter of is constant can be easily tested even with current measurements. Fig. 3 (left) shows the – correlation (the data is the same as Fig. 1, but on linear rather than logarithmic scale). The solid line is the best fitting proportionality relation (zero intercept); the dotted and dashed lines are the intrinsic and total scatter on for all the data, respectively.
The residuals are plotted in the bottom right panel of Fig. 3. It is easy to see that the total scatter around the ridge line increases with bulge mass, but the intrinsic scatter needs be calculated. We divided the dataset into four bins in with equal logarithmic width, containing (from low to high mass) 8, 29, 35 and 14 objects. For each bin we calculated the intrinsic scatter on required to bring the reduced sum of square residuals (from the line calculated from the entire dataset) to 1. The errors on are calculated from the shape of the distribution as explained in Soker & Meiron (2011). As the upper right panel of Fig. 3 shows, the intrinsic scatter increases toward higher masses, in contradiction to the prediction of the mergers-only model discussed above.
4 Discussion and Summary
Our objective was to examine the claim that the SMBH mass to bulge mass (–) correlation is predominantly a result of mergers of low mass galaxies. The merging process leads to an intrinsic scatter in the – relation which is uniform as given by equation (1). We checked this prediction with a sample of 86 galaxies, listed in Table 2. Some properties of the sample are presented in Figs. 1 and 2, and in Table 1. In Fig. 3 we show the – correlation and the residuals.
Our main result is that the intrinsic scatter increases with mass more rapidly than expected in a merger-only scenario. Since mergers occur between all types of galaxies, we include all types of galaxies in our study. However, we checked our analysis for ellipticals, spirals, barred, unbarred, AGNs and inactive galaxies and found the main conclusion to hold for each subgroup separately.
While biasing is always a worry when considering these correlations (especially given the scarcity of data), it does not seem like a selection effect can artificially produce the result of our Fig. 3: the pure merger scenario is only true when the residuals are scattered uniformly; this uniform scatter cannot be smaller than what we see at the high mass end, which is in units of . Missing galaxies at the high end (e.g. small ) can only increase the scatter. At the low mass end, it is only reasonable that we ‘miss’ black holes with masses below the ridge line, but even if they exist, they cannot be scattered over since at the low mass end, is smaller than that. Also, note the recent work by Gültekin et al. (2011), who investigated the possibility that selection effects (namely missing very low mass SMBHs) bias the measurements, and reached the conclusion that it is not likely that the published relations are biased. Our sample was not selected in any special way and largely overlaps with theirs.
Another argument why the pure merger scenario is discrepant with the observations is that the – relationship might not be a true proportionality relation, but have higher order terms. This is indicated by the fact that in two out of the three fitting methods (scatter models) for this relation in logarithmic scale, a slope of 1 (indicating a proportionality relation rather than an arbitrary power law) was more than three standard deviations from the best fitting slope (see Table 1).
We do not dispute the claim that mergers influence the – relations, where represents any property of the host galaxy. We only argue that based on our results, mergers cannot be the dominant cause of correlation. Rather, we expect this correlation to be determined mainly by a feedback mechanism that operates on all scales, from small galaxies to galaxy clusters.
Let us demonstrate a simple plausible implication of the hypothesis that the same feedback mechanism operates on all scales. It is hard to observe the processes that took place during galaxy formation at the high redshift universe, and many models exist, based on radiation and/or jets from AGNs and/or star formation, e.g. Silk & Rees (1998), King (2003), Soker (2009), and Silk & Nusser (2010). The situation is much better with cooling flow clusters, that show both star formation and AGN activity. The central galaxy of the Virgo cluster, M87 (NGC 4486), and the central galaxy of Fornax, NGC 1399, are two cooling flow clusters in our sample.
We take the energy in jets from AGN outbursts to be due to accretion on to the SMBH with an efficiency : . The jets energy is inferred from the energy required to inflate X-ray deficient cavities (bubbles). We here assume that the jet’s energy source is the accreted mass (but see McNamara et al. 2011). Under this assumption, McNamara et al. (2011) find the median value of the molecular mass in the central galaxy to mass accreted during AGN outburst ratio to be , where the scaling of is based on the results of Soker & Meiron (2011). This is very close to the ratio found in our sample. The feedback process in cooling flow clusters seems to be able to produce the – correlation. This might hint that the feedback mechanism that operated during galaxy formation involved the presence of a cooling flow, as suggested in an earlier paper (Soker, 2010).
This research was supported by the Asher Fund for Space Research at the Technion, and the Israel Science Foundation.
References
- Bentz et al. (2009) Bentz, M. C., Peterson, B. M., Pogge, R. W., & Vestergaard, M. 2009, ApJ, 694, L166
- Feoli et al. (2011) Feoli, A., Mancini, L., Marulli, F., & van den Bergh, S. 2011, General Relativity and Gravitation, 43, 1007
- Gaskell (2011) Gaskell, C. M. 2011, arXiv:1111.2067
- Gebhardt et al. (2000) Gebhardt, K., et al. 2000, ApJ, 539, L13
- Genel et al. (2009) Genel, S., Genzel, R., Bouché, N., Naab, T., & Sternberg, A. 2009, ApJ, 701, 2002
- Graham (2008a) Graham, A. W., 2008a, ApJ, 680, 143
- Graham (2008b) Graham, A. W., 2008b, PASA, 25, 167
- Graham & Spitler (2009) Graham, A. W., & Spitler, L. R. 2009, MNRAS, 397, 2148
- Graham et al. (2011) Graham, A. W., Onken, C. A., Athanassoula, E., & Combes, F. 2011, MNRAS, 412, 2211
- Greene et al. (2010) Greene, J. E., Peng, C. Y., Kim, M., et al. 2010, ApJ, 721, 26
- Gültekin et al. (2009) Gültekin, K., et al. 2009, ApJ, 698, 198
- Gültekin et al. (2011) Gültekin, K., Tremaine, S., Loeb, A., & Richstone, D. O. 2011, ApJ, 738, 17
- Hirschmann et al. (2010) Hirschmann, M., Khochfar, S., Burkert, A., et al. 2010, MNRAS, 407, 1016
- Hu (2008) Hu, J. 2008, MNRAS 386, 2242
- Hu (2009) Hu, J. 2009, arXiv:0908.2028
- Jahnke & Macciò (2011) Jahnke, K., & Macciò, A. V. 2011, ApJ, 734, 92:
- King (2003) King, A. 2003, ApJl, 596, L27
- Kormendy & Richstone (1995) Kormendy, J., & Richstone, D. 1995, ARAA, 33, 581
- Laor (2001) Laor, A. 2001, ApJ, 553, 677
- Magorrian et al. (1998) Magorrian, J., et al. 1998, AJ, 115, 2285
- Mancini & Feoli (2011) Mancini, L., & Feoli, A. 2011, arXiv:1110.3542
- McNamara et al. (2011) McNamara, B. R., Rohanizadegan, M., & Nulsen, P. E. J. 2011, ApJ, 727, 39
- Merritt & Ferrarese (2001) Merritt, D., & Ferrarese, L. 2001, ApJ, 547, 140
- Novak et al. (2006) Novak, G. S., Faber, S. M., & Dekel, A. 2006, ApJ, 637, 96
- Peng (2007) Peng, C. Y. 2007, ApJ, 671, 1098
- Peterson et al. (2004) Peterson, B. M., Ferrarese, L., Gilbert, K. M., et al. 2004, ApJ, 613, 682
- Shen et al. (2008) Shen, J., Vanden Berk, D. E., Schneider, D. P., & Hall, P. B. 2008, AJ, 135, 928
- Silk & Nusser (2010) Silk, J., & Nusser, A. 2010, arXiv:1004.0857
- Silk & Rees (1998) Silk, J., & Rees, M. J. 1998, AAP, 331, L1
- Soker (2009) Soker, N. 2009, MNRAS, 398, L41
- Soker (2010) Soker, N. 2010, MNRAS, 407, 2355
- Soker & Meiron (2011) Soker, N., & Meiron, Y. 2011, MNRAS, 411, 1803
- Tremaine et al. (2002) Tremaine, S., et al. 2002, ApJ, 574, 740
- Wandel (2002) Wandel, A. 2002, ApJ, 565, 762
| Galaxy | -high | -low | |||
|---|---|---|---|---|---|
| [km s-1] | [] | [] | [] | [] | |
| Milky Way | |||||
| NGC 821 | |||||
| NGC 2778 | |||||
| NGC 3379 | |||||
| NGC 3384 | |||||
| NGC 3608 | |||||
| NGC 4291 | |||||
| NGC 4473 | |||||
| NGC 4486 | |||||
| NGC 4564 | |||||
| NGC 4649 | |||||
| NGC 4697 | |||||
| NGC 5128 | |||||
| NGC 5845 | |||||
| Circinus | |||||
| Cygnus A | |||||
| NGC 221 | |||||
| NGC 224 | |||||
| NGC 1023 | |||||
| NGC 1300 | |||||
| NGC 1399 | |||||
| NGC 2787 | |||||
| NGC 3031 | |||||
| NGC 3079 | |||||
| NGC 3115 | |||||
| NGC 3227 | |||||
| NGC 3245 | |||||
| NGC 3377 | |||||
| NGC 3998 | |||||
| NGC 4151 | |||||
| NGC 4258 | |||||
| NGC 4261 | |||||
| NGC 4342 | |||||
| NGC 4374 | |||||
| NGC 4459 | |||||
| NGC 4486a | |||||
| NGC 4596 | |||||
| NGC 4945 | |||||
| NGC 5077 | |||||
| NGC 5252 | |||||
| NGC 6251 | |||||
| NGC 7052 | |||||
| NGC 7582 | |||||
| NGC 2974 | |||||
| NGC 3414 | |||||
| NGC 4552 | |||||
| NGC 4621 | |||||
| NGC 5813 | |||||
| NGC 5846 | |||||
| Abell 1836 | |||||
| Abell 3565 | |||||
| NGC 1068 | |||||
| IC 1459 | |||||
| NGC 2748 | |||||
| NGC 4350 | |||||
| NGC 4486B | |||||
| NGC 4742 | |||||
| NGC 7332 | |||||
| NGC 7457 | |||||
| NGC 7469 | |||||
| NGC 1194 | |||||
| NGC 2960 | |||||
| NGC 4388 | |||||
| NGC 6264 | |||||
| NGC 6323 | |||||
| NGC 3585 | |||||
| NGC 3607 | |||||
| NGC 4026 | |||||
| NGC 4594 | |||||
| NGC 5576 | |||||
| NGC 4303 | |||||
| NGC 524 | |||||
| NGC 1316 | |||||
| NGC 2549 | |||||
| PGC 49940 | |||||
| IC 4296 | |||||
| NGC 3393 | |||||
| IC 2560 | |||||
| NGC 3516 | |||||
| NGC 4051 | |||||
| NGC 5548 | |||||
| 3C 120 | |||||
| Mrk 79 | |||||
| Mrk 110 | |||||
| Mrk 590 | |||||
| Mrk 817 |