Probing Phases and Quantum Criticality using Deviations from the Local Fluctuation-Dissipation Theorem
Introduction Cold atomic gases in optical lattices are emerging as excellent laboratories for testing models of strongly interacting particles in condensed matter physics. Currently, one of the major open questions is how to obtain the finite temperature phase diagram of a given quantum Hamiltonian directly from experiments. Previous work in this direction required quantum Monte Carlo simulations to directly model the experimental situation in order to extract quantitative information, clearly defeating the purpose of an optical lattice emulator. Here we propose a new method that utilizes deviations from a local fluctuation dissipation theorem to construct a finite temperature phase diagram, for the first time, from local observables accessible by in situ experimental observations. Our approach extends the utility of the fluctuation-dissipation theorem from thermometry to the identification of quantum phases, associated energy scales and the quantum critical region. We test our ideas using state-of-the-art large-scale quantum Monte Carlo simulations of the two-dimensional Bose Hubbard model.
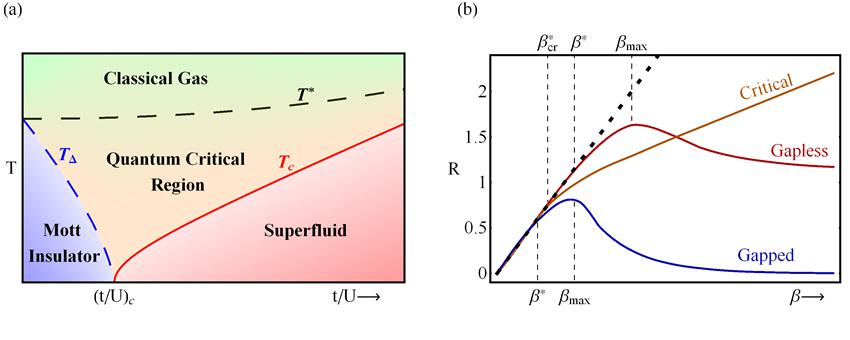
As thermal fluctuations decrease, interactions between particles dominate and drive systems into emergent quantum phases of matter such as superfluids, Mott insulators, magnetically ordered phases, and spin liquids[1, 2, 3, 4]. Not only are these phases with their associated excitations interesting, but the transition between quantum phases opens up a quantum critical region dominated by large fluctuations. The large fluctuations arise from new degrees of freedom that must form as the system transits from one phase to the other, tuned by a coupling parameter as illustrated in Fig. 1.
Quantum gases confined in an optical lattice offer a unique platform to study such quantum phase transitions since the coupling strength is easily tuned by the laser intensity or the magnetic field. Detection and characterization of these systems has, until recently, been limited to time-of-flight observations. Experiments on bosons in optical lattices, emulating the Bose Hubbard model (BHM), have shown signatures of the coherent superfluid (sharp peaks) and of the Mott state (broad, featureless distributions) [1, 5]. Further theoretical investigation has indicated that sharp peaks in the momentum distribution can occur even in the non-superfluid phase and there is a wealth of information about quantum critical fluctuations in the nature of these peaks [6, 7].
The primary bottleneck in obtaining a more quantitative comparison with theory has proven to be a definitive measurement of the temperature and a diagnostic of the all-important quantum critical regime. Some preliminary identifications have been made, but they require input from individually tailored large-scale quantum Monte Carlo (QMC) simulations [8, 9].
In this Letter, we provide the theoretical framework for the application of a local fluctuation dissipation (LFD) theorem to experiments to gain fundamental insights into the nature of the phases, their low-lying excitations and quantum criticality. Motivated by the success of recent experiments[10, 11, 12, 13, 14] to access the local density in situ, we define a LFD ratio as the ratio of the local compressibility to local number fluctuations at site , defined by
| (1) | |||||
Remarkably, from the temperature dependence of this single quantity , we propose that it is possible to estimate the temperature of the onset of quantum effects , the temperature of quantum phase ordering and the quantum critical region, for a general quantum Hamiltonian. We test our proposal on the 2D BHM using large-scale QMC simulations and summarize our central results for phase identification in Fig. 1(b) and in the finite-temperature phase diagram in Fig. 4, obtained solely from this LFD ratio. This explicit demonstration opens up the possibility of finding such phase diagrams for general quantum Hamiltonians directly from experimental data. We thus provide the crucial missing link in the grand challenge to emulate strongly correlated materials such as the high temperature superconductors using ultracold atoms in optical lattices.
Fluctuation-Dissipation Theorem (FDT): The full quantum FDT relates the imaginary response function to the dynamic structure factor at inverse temperature and is given by
| (2) |
Here we specialize to perturbations of the density and the density-density correlation function . A conserved quantity, such as the total number of particles , commutes with the Hamiltonian, so is independent of . As discussed in the supplement, this leads to the exact expression . The zero frequency response function equals where is the thermodynamic compressibility, and the equal-time correlation function equals where is the total number fluctuations. Equating the two gives
| (3) |
While equation (3) resembles the classical FDT, it is crucial to note that it is valid even in the quantum regime since is a conserved quantity.
There are two ways to probe the system locally. We could locally perturb the system with a small change in the chemical potential at site and measure the resulting local density variation . This procedure leads to the single site form of the classical FDT, that is only valid at high temperatures since the density on a given site is not conserved. Both forms of the FDT relations in equation (3) and in the single site form discussed above enable thermometry [15, 16, 9], but serve a limited purpose in revealing other properties of the system.
We propose that a more useful quantity, sensitive to the nature of the phase and to various energy scales, is the local fluctuation-dissipation (LFD) ratio defined in equation (Probing Phases and Quantum Criticality using Deviations from the Local Fluctuation-Dissipation Theorem). The essential difference is that involves which is the measured change of the local density in response to a global chemical potential variation, and as such is sensitive to long range order and phase transitions, as opposed to which is the local response to a local perturbation. For a homogeneous system, is the same as the thermodynamic compressibility (up to factors of ). Although we investigate in a uniform system below, it is important to keep in mind the applicability to inhomogeneous systems as created in trapped atomic gases. Assuming local density approximation, and can be extracted directly from the density profile [17].
In the following, we demonstrate the potential for to map out finite temperature phase diagrams by evaluating in the BHM. Bosons trapped in an optical lattice and confined in a potential are described by
| (4) |
Here are boson annihilation (creation) operators, indicates nearest neighbor sites, is the chemical potential on site for a parabolic confining potential, and and set the hopping and interaction energy scales, respectively. We simulate the BHM at finite temperatures with worldline QMC using the directed loop algorithm on up to site lattices [18]. We establish the essential ideas in a uniform system for clarity, but the results are easily extended to the nonuniform system by using the local density approximation.
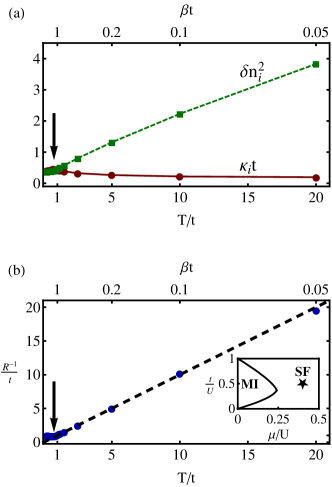
Classical Regime: At high temperatures, , the system is in a non-interacting classical regime. Here the inverse LFD ratio is determined primarily by the density fluctuations that increase linearly with temperature ( remains finite and independent of ). As decreases to the regime , the system remains classical. Interaction effects cause both and to deviate from the high-T ideal gas limit but the inverse LFD ratio remains approximately linear in (see Fig. 2).
can also be used to test for equilibration of the system in different regions. For bosons in optical lattices, the Mott-like center is sometimes observed to be at a significantly different temperature from the superfluid or normal wings [19]. In such situations, successive local measurements of can be useful to garner information about rate-limiting processes for achieving equilibrium.
Onset of Quantum Effects : The deviation of from linear behavior defines the temperature at which quantum effects first become evident. For bosonic systems at low density we observe bunching (see supplement Fig. 1), an enhancement of occupancy at a site, due to quantum statistics and manifested as .
At higher density, the bunching tendency from statistics competes with inter-boson repulsion that tends to keep bosons apart. In this regime, density correlations between sites are anti-correlated (see supplement Fig. 2). It can be shown in general that which implies that for anti-correlated density fluctuations, as seen in Fig. 2.
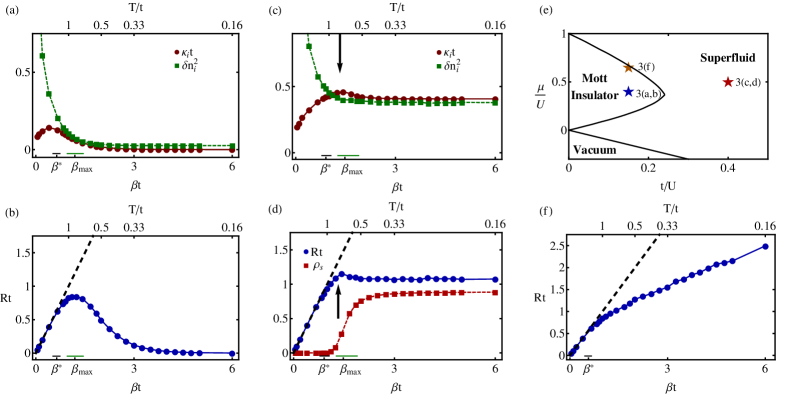
Phases: Understanding the behavior of and , the observables composing the LFD ratio, is essential for understanding the signatures of the phases in (see Fig. 3 for typical MI and SF systems). The peak in at a temperature is a generic feature of the system entering an ordered phase.
Superfluid : The gapless collective excitations in the SF cause both and to approach a constant value as . As the system condenses at , the compressibility , a long wavelength response function, exhibits a peak because of critical fluctuations. Since the appearance of long-range phase coherence does not affect the smoothly decreasing local , the peak in mirrors the peak in near . Comparison with the SF calculated directly from our QMC simulations, determined by the vanishing of the superfluid density, confirms that , illustrated in Fig. 3(d).
Mott Insulator : The Mott gap suppresses the low energy excitations contributing to , causing to vanish as . On the other hand, in spite of the Mott gap, the local number fluctuations remain finite down to the lowest temperatures because of local quantum fluctuations. As the temperature is increased, in contrast to the SF-normal phase transition, the MI crosses over into the normal state with no transition and therefore shows no specific signature in . Thus, the peaks of and do not necessarily line up. We identify the peak in with the MI crossover temperature as confirmed again by QMC simulations, where corresponds to vanishingly small compressibility (see Fig. 4(a,b)). We further determine the zero temperature energy gap to add a particle or a hole, whichever is smaller [20] by fitting or by within the MI. The extracted agrees very well with QMC simulations[21] deep in the MI (Fig. 3(e)), but differ on approaching the critical points, which we attribute mainly to finite temperature and size effects.
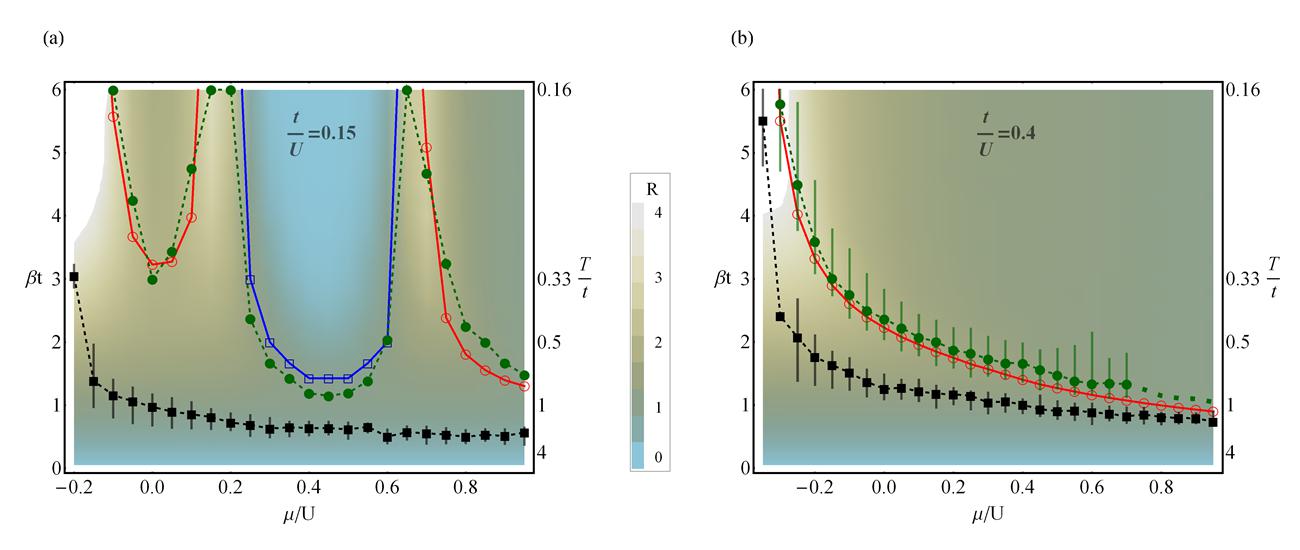
We put together our knowledge of the signatures in in the various quantum and classical phases to construct the phase diagram in Figs. 4(a,b) at couplings above and below . The density in each diagram changes from vacuum to particles per site.
Critical Regime: The degeneracy temperature depends on and and is reassuringly independent of the underlying critical points (see Fig. 4(a)). In the temperature range between and , quantum critical fluctuations lead to with a slope distinctly less than unity (Fig. 4(e)), and and also display nontrivial behavior. This region is clearly largest near the critical points in Fig. 4(a), but the proximity of the critical coupling opens up a quantum critical region at intermediate density and temperature in Fig. 4(b) as well. For both couplings, the window of critical behavior narrows as the density increases, reflecting a change from quantum criticality (proximity to quantum critical point) to classical criticality (as expected near the SF-normal phase transition).
In conclusion, while both the thermodynamic and the local FDT are exact relations useful for estimating the temperature, what is new in our proposal is the construction of a LFD ratio defined in equation (Probing Phases and Quantum Criticality using Deviations from the Local Fluctuation-Dissipation Theorem), that involves measuring local density fluctuations in response to a global chemical potential change. We show that is sensitive to far more than just the temperature. As proof of principle, we have demonstrated that identifies phases and critical regimes as well as estimates the Mott mobility gap . It should therefore be possible to experimentally map out finite temperature phase diagrams, as in Fig. 4(a,b), without the need for individualized QMC simulations. It is also possible to extend to other quantities such as probing spin susceptibility and corresponding spin fluctuations for magnetic systems. Given the very fundamental basis on which the LFD ratio is constructed, we expect it to be an ideal candidate for probing phases and quantum criticality of general quantum Hamiltonians.
Acknowledgments
This work was financially supported by the NSF DMR-0907275 and ICAM (ED), ARO W911NF-08-1-0338 (NT) and the DARPA OLE program.
References
- [1] M. Greiner, O. Mandel, T. Esslinger, T. W. Hansch, and I. Bloch, “Quantum phase transition from a superfluid to a mott insulator in a gas of ultracold atoms,” Nature, vol. 415, pp. 39–44, Jan. 2002.
- [2] P. W. Anderson, P. A. Lee, M. Randeria, T. M. Rice, N. Trivedi, and F. C. Zhang, “The physics behind high-temperature superconducting cuprates: the ’plain vanilla’ version of RVB,” Journal of Physics: Condensed Matter, vol. 16, pp. R755–R769, June 2004.
- [3] “Towards a complete theory of high tc,” Nat Phys, vol. 2, pp. 138–143, Mar. 2006.
- [4] S. Yan, D. A. Huse, and S. R. White, “Spin-liquid ground state of the s = 1/2 kagome heisenberg antiferromagnet,” Science, vol. 332, no. 6034, pp. 1173–1176, 2011.
- [5] I. B. Spielman, W. D. Phillips, and J. V. Porto, “Condensate fraction in a 2D bose gas measured across the Mott-Insulator transition,” Physical Review Letters, vol. 100, p. 120402, Mar. 2008.
- [6] Y. Kato, Q. Zhou, N. Kawashima, and N. Trivedi, “Sharp peaks in the momentum distribution of bosons in optical lattices in the normal state,” Nat Phys, vol. 4, no. 8, pp. 617–621, 2008.
- [7] R. B. Diener, Q. Zhou, H. Zhai, and T. Ho, “Criterion for bosonic superfluidity in an optical lattice,” Physical Review Letters, vol. 98, p. 180404, May 2007.
- [8] S. Trotzky, L. Pollet, F. Gerbier, U. Schnorrberger, I. Bloch, N. V. Prokof/’ev, B. Svistunov, and M. Troyer, “Suppression of the critical temperature for superfluidity near the mott transition,” Nat Phys, vol. 6, pp. 998–1004, Dec. 2010.
- [9] S. Fang, C. Chung, P. N. Ma, P. Chen, and D. Wang, “Quantum criticality from in situ density imaging,” Physical Review A, vol. 83, p. 031605, Mar. 2011.
- [10] W. S. Bakr, J. I. Gillen, A. Peng, S. Folling, and M. Greiner, “A quantum gas microscope for detecting single atoms in a hubbard-regime optical lattice,” Nature, vol. 462, pp. 74–77, Nov. 2009.
- [11] J. F. Sherson, C. Weitenberg, M. Endres, M. Cheneau, I. Bloch, and S. Kuhr, “Single-atom-resolved fluorescence imaging of an atomic mott insulator,” Nature, vol. 467, no. 7311, pp. 68–72, 2010.
- [12] C. Hung, X. Zhang, N. Gemelke, and C. Chin, “Observation of scale invariance and universality in two-dimensional bose gases,” Nature, vol. 470, pp. 236–239, Feb. 2011.
- [13] W. S. Bakr, A. Peng, M. E. Tai, R. Ma, J. Simon, J. I. Gillen, S. F lling, L. Pollet, and M. Greiner, “Probing the superfluid to mott insulator transition at the single-atom level,” Science, vol. 329, no. 5991, pp. 547–550, 2010.
- [14] N. Gemelke, X. Zhang, C. Hung, and C. Chin, “In situ observation of incompressible mott-insulating domains in ultracold atomic gases,” Nature, vol. 460, no. 7258, pp. 995–998, 2009.
- [15] Q. Zhou and T.-L. Ho, “Universal thermometry for quantum simulation,” Phys. Rev. Lett., vol. 106, p. 225301, May 2011.
- [16] P. N. Ma, L. Pollet, and M. Troyer, “Measuring the equation of state of trapped ultracold bosonic systems in an optical lattice with in situ density imaging,” Physical Review A, vol. 82, no. 3, p. 033627, 2010.
- [17] Q. Zhou, Y. Kato, N. Kawashima, and N. Trivedi, “Direct mapping of the finite temperature phase diagram of strongly correlated quantum models,” Physical Review Letters, vol. 103, no. 8, p. 085701, 2009.
- [18] Y. Kato and N. Kawashima, “Quantum monte carlo method for the Bose-Hubbard model with harmonic confining potential,” Physical Review E, vol. 79, p. 021104, Feb. 2009.
- [19] C.-L. Hung, X. Zhang, N. Gemelke, and C. Chin, “Slow mass transport and statistical evolution of an atomic gas across the superfluid˘mott-insulator transition,” Phys. Rev. Lett., vol. 104, p. 160403, Apr 2010.
- [20] M. P. A. Fisher, P. B. Weichman, G. Grinstein, and D. S. Fisher, “Boson localization and the superfluid-insulator transition,” Physical Review B, vol. 40, p. 546, July 1989.
- [21] B. Capogrosso-Sansone, S. G. S yler, N. Prokof’ev, and B. Svistunov, “Monte carlo study of the two-dimensional Bose-Hubbard model,” Physical Review A, vol. 77, p. 015602, Jan. 2008.