Uncovering Local Absorbed Active Galactic Nuclei with Swift and Suzaku
Abstract
Detection of absorbed active galactic nuclei and their properties remains an elusive and important problem in understanding the evolution and activation of black holes. With the very hard X-ray survey conducted by Swift’s Burst Alert Telescope – the first all-sky survey in 30 years – we are beginning to uncover the characteristics of obscured AGN. The synergy between Suzaku and Swift has been crucial in pinning down the X-ray properties of newly detected heavily obscured but bright hard X-ray sources. We review the X-ray and optical spectroscopic properties of obscured AGN in the local Universe, as detected in the Swift survey. We discuss the relative distribution of absorbed/unabsorbed sources, including “hidden” and Compton thick AGN populations. Among the results from the survey, we find that absorbed AGN are less luminous than unabsorbed sources. Optical spectra reveal that sources with emission line ratios indicative of LINERs/H II galaxies/composites are the least luminous objects in the sample, while optical absorbed and unabsorbed Seyferts have the same luminosity distributions. Thus, the least luminous sources are likely accreting in a different mode than the Seyferts.
Keywords:
active galaxies; Swift Gamma-ray burst satellite; X-ray surveys:
98.54.Cm,98.70.Qy1 Introduction
After over sixty years of research on active galaxies, there are still many unanswered questions remaining about the nature of black holes and their connection to the host galaxies. We do not yet understand why some black holes are active, while others are not, or whether all super massive black holes undergo a phase of activity at some point in their evolution. If all black holes do undergo an active phase, how does this affect the formation and evolution of the host galaxy? Further, at an even more basic level, what are the properties of active galaxies?
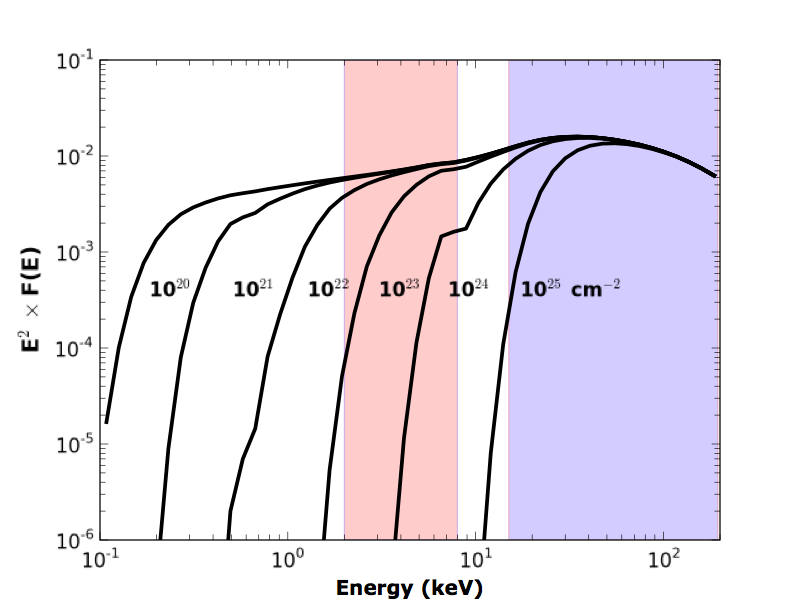
Selection methods of active galaxies present a major challenge in determining both the properties of active galactic nuclei (AGN) and their host galaxies (Mushotzky, 2004). Optical and soft X-ray surveys are greatly affected by dust and gas in the line of sight and therefore miss heavily obscured AGN. In the infrared, the AGN signature is difficult to disentangle from star-formation. The very hard X-rays, at energies above 10 keV, are an unambiguous indicator of AGN emission that is unaffected by all but the highest, Compton-thick (N cm-2), levels of obscuration (see Figure 1). Therefore, the very hard X-rays offer an excellent selection method for determining the basic properties of AGN.
With the launch of the Swift Gamma-ray burst satellite in 2004, the largest all-sky survey in the very hard X-rays is being conducted with the Burst Alert Telescope (BAT; sensitive in the 14–195 keV band). The current survey includes over 1000 sources, with more than 600 AGN (Tueller, in prep). However, the most well-studied sources from the Swift survey are the 102, , AGN detected in the 9-month catalog (Tueller et al., 2008). These sources are bright and nearby (), making them excellent targets for multi-wavelength observational studies. The X-ray (Winter et al., 2009a) and optical (Winter et al., 2010) spectroscopic properties of these sources are the subject of this article. In particular, X-ray follow-ups with the Suzaku satellite, which obtains simultaneous coverage in the soft through very hard X-rays, have been crucial in determining the properties of the most heavily obscured AGN detected with Swift.

2 The X-ray Spectral Properties of Swift-detected Active Galaxies
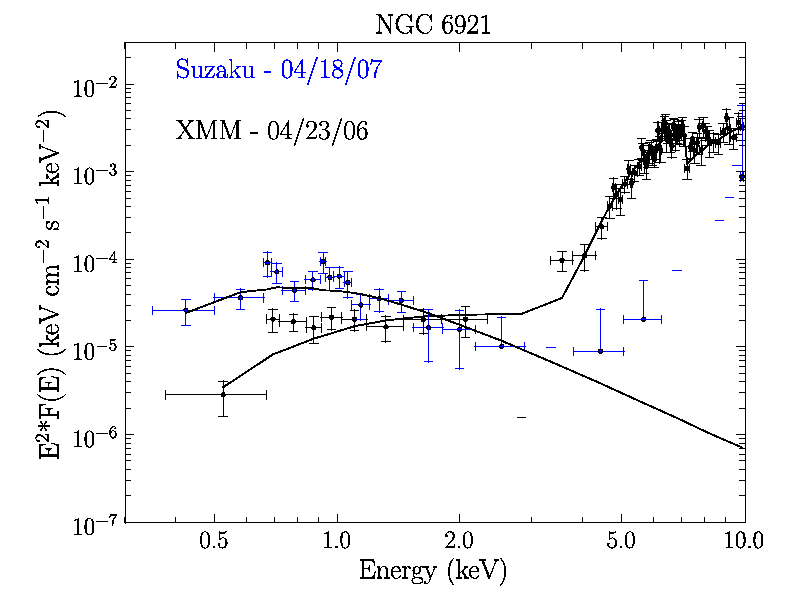
A combination of archival and follow-up X-ray spectroscopic observations in the 0.3–10 keV band were analyzed for all of the Swift BAT-detected AGN (Winter et al., 2009a). We fit available spectra from Suzaku, ASCA, XMM-Newton, Chandra, and the Swift XRT to determine the basic properties of our sample. We found that 45% of our sources are well-fit by a simple absorbed power-law model (similar to the spectra shown in Figure 1). The additional 55% of our sources required a more complex model, which we fit with a partial covering absorber model. In the partial covering absorber model, the absorber is assumed to cover only a fraction of the direct emission. We found that all of the sources with the highest measured column densities require the more complex model. The least absorbed sources, meanwhile, are well fit by the simple model.
An intriguing result from our X-ray analysis was that the fraction of absorbed sources changes with luminosity. In Figure 2, we show that there are fewer absorbed (N cm-2) sources at the highest luminosities (30%). However, more than 80% of the low luminosity AGN are obscured. A similar result was also found at higher redshift in the Chandra-selected AGN samples (Ueda et al., 2003; Steffen et al., 2003; Barger et al., 2005). We found that this relationship also exists in accretion rate, where there are more absorbed sources at the lowest accretion rates. This result provides a challenge to the unified model. In the unified model (Antonucci, 1993), both obscured and unobscured AGN are fundamentally the same. The difference in the observed spectra is caused simply by our viewing angle to the torus. However, if absorbed sources are less luminous/accreting at a lower rate, as recent results suggest, there must be a modification to this simple model to account for differences in accretion rates. In the following section, we discuss further clues to this problem from optical spectroscopic follow-ups.

As we mentioned, the most absorbed sources in the Swift sample have the most complex spectra. They are also less luminous than the unabsorbed AGN. In the following sub-sections, we discuss the properties of the most absorbed sources detected with Swift. Many of these, the hidden AGN, were detected as AGN for the first time with Swift’s BAT. The elusive Compton-thick sources, the most obscured AGN found in nature, are also discussed.
2.1 Hidden AGN
Hidden or buried AGN were first identified through Suzaku follow-ups of Swift detected sources (Ueda et al., 2007). Suzaku follow-ups were necessary, as little direct X-ray emission from these heavily absorbed sources is detected in the 0.3–10 keV band. Simultaneous spectra with the Suzaku XIS (sensitive to the soft through hard X-rays) and pin (sensitive keV) allow for determinations of the basic X-ray properties, including the column density of obscuring gas. The initial analysis of two hidden sources in Ueda et al. (2007) found that these are heavily obscured AGN with NH from cm-2 that are likely buried in a geometrically thick torus. Optical spectroscopy shows weak H and [O III] emission lines.
From our characterization of the X-ray properties of the entire Swift selected sample, we found that this class of AGN is significant. We find that 24% of local AGN are “hidden”. Analysis of the available 0.3–10 keV spectra are ambiguous on whether these heavily obscured sources are Compton-thick. Therefore, we obtained Suzaku spectroscopy of a sample of 5 hidden AGN to determine their properties.
The Suzaku spectra of the hidden sources, which were all detected as AGN for the first time with Swift, reveal that they are not Compton-thick (Winter et al., 2009b). The combination of the Suzaku XIS and pin spectra reveal column densities from N cm-2. The Compton thick signature of strong Fe K emission lines, with keV, are not observed. Although they do have flat power-law indices (), another indicator of a reflection dominated spectrum. Compton-thick sources are likely to show little variability since they are so heavily obscured that only reflected emission is viewed in the X-ray band. We find that the hidden sources are very variable (see Figure 3), but that this variability is observed more in the hard/very hard X-rays than in the soft X-rays (where little emission is detected). This is in contrast to unabsorbed sources, which are most variable in the soft X-rays.
Therefore, we find that hidden AGN are heavily obscured sources that are not Compton-thick. This population is important, as we find that 24% of the Swift-detected AGN are in this class. However, the multi-wavelength properties are not well-known, as these sources are likely missed in optical/softer X-ray surveys.

2.2 Compton-thick AGN
The detection of heavily obscured AGN is a main goal of the Swift AGN survey. We find that the most heavily obscured AGN, Compton-thick sources, are difficult to detect even at the highest X-ray energies. X-ray analysis of the 9-month survey reveal that a few Compton thick sources are detected, including well-known sources like Cen A, NGC 1275, and NGC 6240. Characterizing the properties of such sources is difficult, however, as Compton-thick AGN are complicated. Using discriminators of flat power-law indices, strong Fe K and high column densities, we find that 6% of the Swift BAT-detected AGN are Compton-thick (Winter et al., 2009a).
Independent analysis of the Swift BAT spectra confirms this rate (%) (Burlon et al., 2011). However, Burlon et al. (2011) determine that if the distribution of AGN is corrected for absorption, the corrected detection rate of Compton-thick AGN from Swift is much higher (%). The Compton-thick rate is an important prediction for models of the cosmic X-ray background, which account for the observed 30 keV emission with a significant fraction (10–15%) of Compton-thick AGN (Gilli et al., 2007). While Swift is detecting some of these sources, we are still missing most of these AGN. We must look to future very hard X-ray surveys, like NUSTAR, to uncover the most heavily obscured population. However, in the softer X-rays, keV, we find that the X-ray properties in the Swift sample perfectly account for the slope of the CXB measured by Marshall et al. (1980).


3 Clues to the Nature of Low Luminosity AGN from Optical Spectroscopy
To determine the optical spectroscopic properties of the Swift very hard X-ray detected AGN, we analyzed spectra of our sources from the Sloan Digital Sky Survey and our own follow-ups from the Kitt Peak National Observatory’s 2.1-m telescope (Winter et al., 2010). Our sample consisted of 81% of the “northern” Swift-detected AGN. To determine the optical emission line properties, we first modeled the continuum emission from the host galaxy using the stellar population models of Bruzual and Charlot (2003) and the method of Tremonti et al. (2004). The narrow and broad lines were decomposed, using Gaussian model fits to the continuum subtracted spectra.
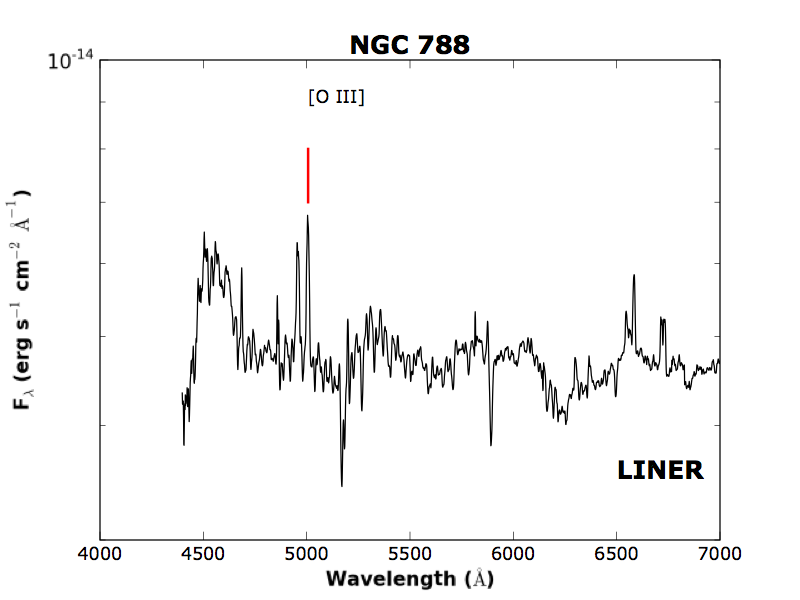
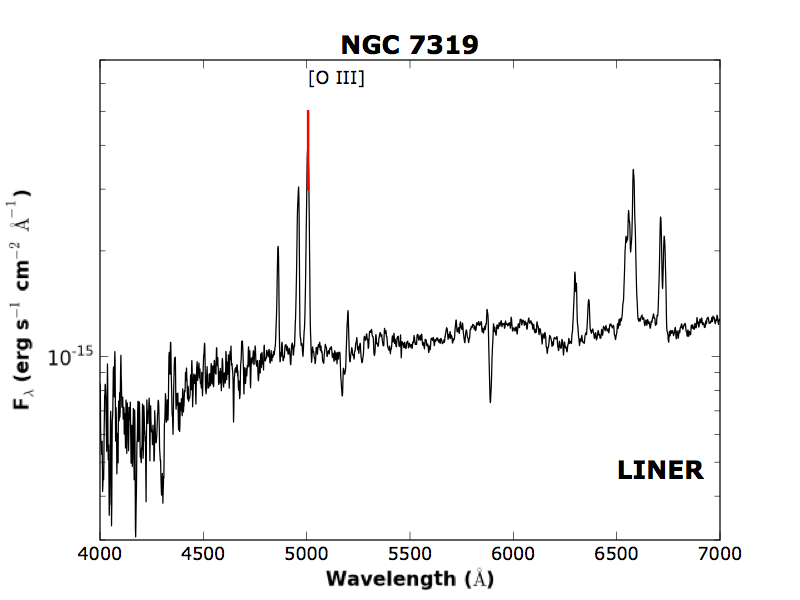
We used the narrow emission-line diagnostics of Baldwin et al. (1981) and Veilleux and Osterbrock (1987) (see Figure 4 for an emission line diagnostic plot). We find that the narrow line sources consist of 66% Seyferts, 16% LINERs, 13% ambiguous, 3% composite H II/AGN, and 3% H II galaxies. The non-Seyfert sources and the LINERs in particular (examples shown in Figure 5), are more heavily absorbed. The average X-ray column density for the LINERs is cm-2, whereas the average column density for the absorbed Swift sources is cm-2. Additionally, we find that the non-Seyferts are among the lowest luminosity sources in the sample. If we look at the distribution of luminosities for the broad line AGN versus the narrow line Seyferts, we find that the luminosity distributions are consistent with being drawn from the same population. Therefore, the luminosities of optical Seyferts are consistent with the unified model. We find that the optical LINERs/composites/H II galaxies are not consistent. These sources do not fit in the standard unified model picture and may be accreting in a different mode (e.g., radiatively inefficient accretion mode as discussed in Ho (2008)). Many of these sources are classified in the X-rays as “hidden” AGN.
4 Summary
The Swift all-sky, very hard X-ray survey is uncovering a large sample of absorbed AGN that are missed in optical/softer X-ray surveys. Among the new absorbed sources, we identify that 24% of the very hard X-ray AGN are “hidden”/buried. Suzaku follow-ups, which allow for simultaneous coverage in the soft through very hard X-rays, of hidden AGN proved crucial for determining the column densities and basic X-ray properties of this class. Hidden AGN are heavily obscured, Compton-thin sources. Meanwhile, Swift finds that Compton-thick sources account for only % of the sample – showing that these sources are faint even in the 14–195 keV band.
In the X-rays, absorbed AGN are less luminous than unabsorbed AGN. However, optical spectroscopic follow-ups show that the absorbed sources classified as Seyferts have the same luminosity distributions as the optical broad line AGN. The optical LINERs/H II galaxies/composites are among the most obscured and lowest luminosity sources. These are the absorbed AGN that are not consistent with the unified model and are possibly accreting in a different mode than the Seyferts. These results will continue to be tested through Suzaku and optical spectroscopic follow-ups of the additional 500+ AGN detected in the newest Swift catalog – offering a new view on obscured AGN in the local Universe.
References
- Mushotzky (2004) R. Mushotzky, “How are AGN Found?,” in Supermassive Black Holes in the Distant Universe, edited by A. J. Barger, 2004, vol. 308 of Astrophysics and Space Science Library, pp. 53–+.
- Tueller et al. (2008) J. Tueller, R. F. Mushotzky, S. Barthelmy, J. K. Cannizzo, N. Gehrels, C. B. Markwardt, G. K. Skinner, and L. M. Winter, ApJ 681, 113–127 (2008), 0711.4130.
- Winter et al. (2009a) L. M. Winter, R. F. Mushotzky, C. S. Reynolds, and J. Tueller, ApJ 690, 1322–1349 (2009a), 0808.0461.
- Winter et al. (2010) L. M. Winter, K. T. Lewis, M. Koss, S. Veilleux, B. Keeney, and R. F. Mushotzky, ApJ 710, 503–539 (2010), 1001.0049.
- Ueda et al. (2003) Y. Ueda, M. Akiyama, K. Ohta, and T. Miyaji, ApJ 598, 886–908 (2003), arXiv:astro-ph/0308140.
- Steffen et al. (2003) A. T. Steffen, A. J. Barger, L. L. Cowie, R. F. Mushotzky, and Y. Yang, ApJL 596, L23–L26 (2003), arXiv:astro-ph/0308238.
- Barger et al. (2005) A. J. Barger, L. L. Cowie, R. F. Mushotzky, Y. Yang, W.-H. Wang, A. T. Steffen, and P. Capak, AJ 129, 578–609 (2005), arXiv:astro-ph/0410527.
- Antonucci (1993) R. Antonucci, ARA&A 31, 473–521 (1993).
- Ueda et al. (2007) Y. Ueda, S. Eguchi, Y. Terashima, R. Mushotzky, J. Tueller, C. Markwardt, N. Gehrels, Y. Hashimoto, and S. Potter, ApJL 664, L79–L82 (2007), arXiv:0706.1168.
- Winter et al. (2009b) L. M. Winter, R. F. Mushotzky, Y. Terashima, and Y. Ueda, ApJ 701, 1644–1664 (2009b).
- Burlon et al. (2011) D. Burlon, M. Ajello, J. Greiner, A. Comastri, A. Merloni, and N. Gehrels, ApJ 728, 58–+ (2011), 1012.0302.
- Gilli et al. (2007) R. Gilli, A. Comastri, and G. Hasinger, A&A 463, 79–96 (2007), arXiv:astro-ph/0610939.
- Marshall et al. (1980) F. E. Marshall, E. A. Boldt, S. S. Holt, R. B. Miller, R. F. Mushotzky, L. A. Rose, R. E. Rothschild, and P. J. Serlemitsos, ApJ 235, 4–10 (1980).
- Bruzual and Charlot (2003) G. Bruzual, and S. Charlot, MNRAS 344, 1000–1028 (2003), arXiv:astro-ph/0309134.
- Tremonti et al. (2004) C. A. Tremonti, T. M. Heckman, G. Kauffmann, J. Brinchmann, S. Charlot, S. D. M. White, M. Seibert, E. W. Peng, D. J. Schlegel, A. Uomoto, M. Fukugita, and J. Brinkmann, ApJ 613, 898–913 (2004), arXiv:astro-ph/0405537.
- Baldwin et al. (1981) J. A. Baldwin, M. M. Phillips, and R. Terlevich, PASP 93, 5–19 (1981).
- Veilleux and Osterbrock (1987) S. Veilleux, and D. E. Osterbrock, ApJS 63, 295–310 (1987).
- Ho (2008) L. C. Ho, ARA&A 46, 475–539 (2008), 0803.2268.