Anisotropy in the matter distribution beyond the baryonic
acoustic oscillation scale
Abstract
Tracing the cosmic evolution of the Baryonic Acoustic Oscillation (BAO) scale with galaxy two point correlation functions is currently the most promising approach to detect dark energy at early times. A number of ongoing and future experiments will measure the BAO peak with unprecedented accuracy. We show based on a set of N-Body simulations that the matter distribution is anisotropic out to , far beyond the BAO scale of , and discuss implications for the measurement of the BAO. To that purpose we use alignment correlation functions, i.e., cross correlation functions between high density peaks and the overall matter distribution measured along the orientation of the peaks and perpendicular to it. The correlation function measured along (perpendicular to) the orientation of high density peaks is enhanced (reduced) by a factor of compared to the conventional correlation function and the location of the BAO peak shifts towards smaller (larger) scales if measured along (perpendicular to) the orientation of the high density peaks. Similar effects are expected to shape observed galaxy correlation functions at BAO scales.
Subject headings:
large-scale structure of universe — methods: numerical1. Introduction
The Baryonic Acoustic Oscillations (BAO) constitute a characteristic feature within the large scale structure of the Universe and can serve as standard ruler for constraining the properties of dark energy (e.g., Blake & Glazebrook, 2003; Linder, 2003; Seo & Eisenstein, 2003; Wang, 2006; McDonald & Eisenstein, 2007; Seo & Eisenstein, 2007; Seo et al., 2008, 2009; Kazin et al., 2012). The BAO in the baryon-photon fluid of the pre-recombination era imprint the sound horizon distance at decoupling as a typical scale in the matter correlation function or power spectrum (Peebles & Yu, 1970; Sunyaev & Zeldovich, 1970; Eisenstein & Hu, 1999; Bashinsky & Bertschinger, 2002). These oscillations were detected in the cosmic microwave background (e.g., Page et al., 2003) and in the spatial distribution of galaxies (Eisenstein et al., 2005; Cole et al., 2005) and have been confirmed by a number of subsequent studies (e.g., Percival et al., 2007; Cabré & Gaztañaga, 2009; Sánchez et al., 2009; Percival et al., 2010; Reid et al., 2010; Kazin et al., 2010).
The next generation of large galaxy surveys, like the Panoramic Survey Telescope & Rapid Response System (Pan-STARRS, Kaiser et al. 2002), the Dark Energy Survey (DES, The Dark Energy Survey Collaboration 2005), the Baryonic Oscillation Spectroscopic Survey (BOSS, Schlegel et al. 2009), BigBOSS (Schlegel et al., 2011), the Hobby Eberly Telescope Dark Energy Experiment (HETDEX, Hill et al. 2004) and the space based Euclid mission (Cimatti et al., 2009), will cover volumes much larger than current datasets, allowing for much more accurate determinations of the BAO.
In the two-point correlation function the BAO are visible as a unique broad and quasi Gaussian peak (Matsubara, 2004). However, the determination of the shape and location of the peak may be affected by sample variance (Cabré & Gaztañaga, 2009; Martínez et al., 2009; Kazin et al., 2010; Cabré & Gaztañaga, 2011), non linear effects and the bias of the tracer galaxy population (Smith et al., 2003; Crocce & Scoccimarro, 2006; Angulo et al., 2008; Crocce & Scoccimarro, 2008; Seo et al., 2008). These difficulties lead Prada et al. (2011) to suggest to use the zero-crossing of the two point correlation located at as standard ruler instead of the peak location. Yet, several observations do not show the theoretically predicted zero-crossing at all (Martínez et al., 2009; Kazin et al., 2010). At this stage it is unclear whether this discrepancy is caused by systematic effects or cosmic variance or whether it represents a challenge for the concordance CDM model (Sylos Labini et al., 2009; Sánchez et al., 2009; Kazin et al., 2010).
One basic assumption for interpretation of the BAO measurements is that the matter distribution is isotropic at the relevant scales (). In this work we use alignment correlation functions (Paz et al., 2008; Faltenbacher et al., 2009) to show that the amplitudes of the two-point correlation function measured along the orientations of the high density peaks are larger than those derived from spherically averaged (conventional) clustering analysis out to scales of and discuss possible effects on measurements of the BAO.
2. Methodology
We use a set of large scale dark matter simulations which follow the evolution of the cosmic density field including its collapse into high density peaks. Based on their orientations we compute the alignment cross correlation function with the over all mass distribution out to . In this section we briefly discuss the simulations, the computation of density peak orientations and the definition of the alignment correlation function.
2.1. Simulations
We used GADGET-2 (Springel, 2005) to carry out 50 -simulations based on the same concordant CDM cosmology but different realizations of the initial density field. The total volume of the ensemble is almost 70 times larger than the volume used for the detection of the BAO signal by Eisenstein et al. (2005). The cosmological parameters correspond to those used for the Millennium Simulation (Springel et al., 2005): matter density parameter, ; cosmological constant term, ; power spectrum normalization, ; spectral slope, ; and Hubble parameter, . For each run particles are used resulting in a mass resolution of for the dark matter particles. A Plummer-equivalent softening of was employed. An analysis based on a much lower force resolution showed very similar results.
2.2. Orientations of high density peaks
Density peaks are identified by using a friends-of-friends (FoF, Davis et al., 1985) group-finder with linking parameter times the mean particle separation. In each realization there are about 30,000 FoF-groups with masses greater than . The orientations are derived by evaluating the eigenvalues of the second moment of the mass tensor. In the following the direction of principal axis associated with the largest eigenvalue is referred to as the (3D) orientation of the density peak. Observationally 3D orientations are difficult to determine, therefore, we also use projected orientations. These are determined by collapsing the mass distribution of the density peak along the line of sight (here equivalent to the z-axis) and, consecutively, computing the eigenvectors of inertia tensor for the two dimensional mass distribution. Despite the poor force resolution the orientations of the density peaks are expected to trace the large scale tidal field well (see below).
2.3. Alignment correlation functions
Two-point correlation functions, , are a primary tool for quantifying the clustering properties of cosmological structures (e.g. Peebles, 1980).We employ an extension of the two-point cross-correlation function which can be used to quantify spatial alignment of objects in one sample with respect to orientations assigned to the objects in the other sample (see, Paz et al., 2008; Faltenbacher et al., 2009; Schneider et al., 2011). Given a sample of objects in question (Sample ), a sample of reference objects (Sample ) and a random sample (Sample ) we can define the alignment two point cross correlation function
| (1) |
where indicates the distance, , is the angle between the orientation of the objects in Sample and the line connecting to objects in either of the two other samples. and are the number of points contained in the reference and random sample, and are the counts of cross pairs between the indicated samples for given and . The conventional correlation function is the average of the alignment correlation function over the full range of values.
Taking symmetries into account the value of ranges from zero (along the orientation of the main object) to 90 degrees (perpendicular to its orientation). Thus, higher amplitudes of the alignment correlation functions at small values of indicate that the reference objects are more likely to be aligned along orientation of the main objects. In contrast, higher amplitudes at larger angles indicate that the reference objects are more likely to be located perpendicular to the orientation of the main objects.
We employ the alignment correlation functions, more exactly, the average of the alignment correlation function within given angular ranges, to quantify the large-scale alignment between the matter distribution in the Universe and the orientation of high density peaks (). The reference samples are generated from 10% random subsets of the overall particle distributions. If real-space correlations are considered we use the three dimensional orientation and separation vector to determine . Alternatively, if observational consequences are discussed we use projected orientations but still 3D distances since the effects of reshift-space distortions are small.
3. Results
In this section we present our findings for the alignment correlation functions in real- and redshift-space and for redshifts z=0 and 0.6.
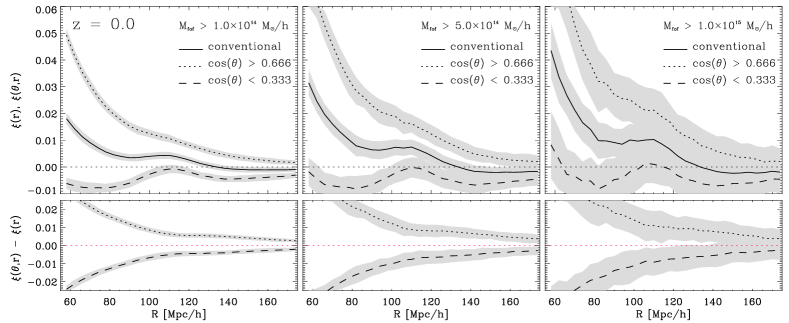
Fig. 1 shows the conventional and alignment two point cross correlation functions (upper panels) and the residuals of the alignment correlation functions about the conventional correlation function (lower panels) employing different lower mass cuts (, and ) for the high density peaks in the main sample. Solid lines show the conventional correlation functions. Dotted and dashed lines represent the correlation functions along and perpendicular to the orientations of the density peaks. The gray regions represent the cosmic variance. Interestingly, the cosmic variance in the lower panels is slightly smaller, this is because the differences between conventional and alignment correlation functions are independent of their absolute values. To check for systematic or numerical errors we have repeated the above analysis with randomly interchanged orientations within each realization. In this case we do not detect any significant difference between the conventional and alignment correlation functions.
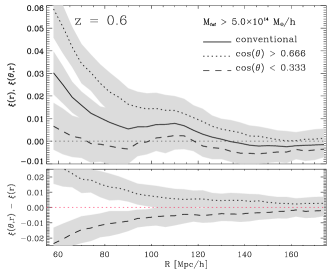
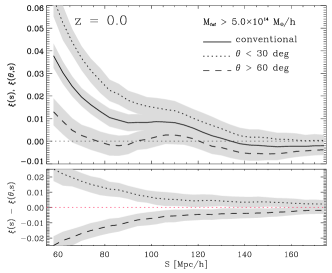
The left panel of Fig. 2 displays conventional and alignment correlation functions for density peaks with masses larger than at . The right panel of Fig. 2 represents the correlation functions based on projected orientations. Here, the angles used to select the pairs along and perpendicular to the orientations of the density peaks are computed between the projected orientations and the projected distance vectors. Distances are computed in redshift space using the distant observer approximation. In this case the differences in the amplitudes between the conventional and the alignment correlation functions are somewhat reduced but still significant beyond the BAO scale.
In conclusion, the alignment correlation function between dark matter density peaks with masses and the overall matter distribution reveals anisotropies at scales larger than far beyond the BAO scale. The difference between conventional correlation functions and correlation functions measured along and perpendicular to the orientations of the peaks is most pronounced for the most massive peaks in real-space at . But it remains visible at earlier time and also if projected orientations are used.
4. Discussion
The findings presented here are based on N-Body simulations however
qualitative similar effects are expected to shape the observed galaxy
correlation functions at scales up to . Potential
observational implications are:
Large-scale anisotropy and structure of two point
correlation functions: Our results indicate that matter is
distributed anisotropically out to separations far larger then the BAO
scale. At any given pair separation the conventional correlation
function is the average of the alignment correlation function over the
whole range of . We find that the alignment correlation
function measured along high density peaks does not fall below zero
(for separations ) which is counterbalanced by negative
amplitudes at much smaller separations for measurements perpendicular
to it. At the BAO scale galaxy two point correlation
functions can be interpreted as the average of a more highly clustered
component along the direction of high density peaks and a less
clustered component perpendicular to it.
Shape and location of the BAO peak: At BAO scales the
amplitudes of the correlation functions between high density peaks and
the overall matter distribution are significantly higher if measured
along the orientation of the peaks. In this case the BAO peak is composed
of a hump on top of the declining but still positive correlation
function. The signal perpendicular to the orientations is dominated
by the BAO hump itself with negligible underlying clustering signal. The
location of the BAO peak is found at somewhat smaller (larger) scales if
measured parallel (perpendicular) to the orientation of high density
peaks. For the measurements along
the density peak orientations the BAO hump is transformed into a plateau-like
feature. If the survey volume is dominated by large filamentary
structures the shape of the conventional correlation function should
be close to that found for the parallel signal shown here. This may
relate to a study by Kazin et al. (2010) who find no apparent peak in 6%
of their mock samples.
Zero crossing and large scale power:
Several publications report the non-detection of zero-crossing out to
scales of which indicates (unexpected) large scale power
(e.g., Martínez et al., 2009; Kazin et al., 2010; Sylos Labini et al., 2009). We find similar
results for the correlation functions measured along the orientations
of high density peaks. Furthermore, the alignment cross correlation
function measured along the orientations of high density peaks at
shows zero-crossing in contrast to the behavior at . The
WiggleZ redshift-space correlation function at
(Blake et al., 2011) shows a crossover as well. Whether these
analogies are coincidental remains to be explored in future
work.
Direct measurement of anisotropy:
With the advent of enormous cluster catalogs (e.g., Hao et al., 2010; Gilbank et al., 2011) it should in principle be possible to directly measure
the large scale anisotropies with alignment correlation functions if
cluster orientations can be determined with sufficient accuracy. An
anisotropy signal may even be extracted simply by using orientations
of the cluster central luminous red galaxies because the orientations
of central galaxies and host systems are correlated
(Faltenbacher et al., 2009; Okumura et al., 2009; Schneider et al., 2011).
Improvement of BAO measurements:
If the directional effects reported here are observable it would be
worthwhile considering to measure the BAO peak perpendicular to the
orientations of galaxy clusters (or luminous red galaxies) since in
this direction the BAO peak is better confined.
Acknowledgements
We would like to thank the anonymous referee for very helpful comments. This work is sponsored by NSFC (no. 11173045), Shanghai Pujiang Program (no. 11PJ1411600) and the CAS/SAFEA International Partnership Program for Creative Research Teams (KJCX2-YW-T23). AF acknowledges support from the South African SKA project. The simulations used for this paper were performed on the Blade Centre cluster of the Computing Center of the Max-Planck-Society in Garching, and ICC Cosmology Machine COSMA4, which is part of the DiRAC Facility jointly funded by STFC, the Large Facilities Capital Fund of BIS, and Durham University.
References
- Angulo et al. (2008) Angulo, R. E., Baugh, C. M., Frenk, C. S., & Lacey, C. G. 2008, MNRAS, 383, 755
- Bashinsky & Bertschinger (2002) Bashinsky, S. & Bertschinger, E. 2002, Phys. Rev. D, 65, 123008
- Blake et al. (2011) Blake, C., Davis, T., Poole, G. B., Parkinson, D., Brough, S., Colless, M., Contreras, C., Couch, W., & et al.,. 2011, MNRAS, 415, 2892
- Blake & Glazebrook (2003) Blake, C. & Glazebrook, K. 2003, ApJ, 594, 665
- Cabré & Gaztañaga (2009) Cabré, A. & Gaztañaga, E. 2009, MNRAS, 393, 1183
- Cabré & Gaztañaga (2011) —. 2011, MNRAS, 412, L98
- Cimatti et al. (2009) Cimatti, A., Robberto, M., Baugh, C., Beckwith, S. V. W., Content, R., Daddi, E., De Lucia, G., Garilli, B., & et al.,. 2009, Experimental Astronomy, 23, 39
- Cole et al. (2005) Cole, S., Percival, W. J., Peacock, J. A., Norberg, P., Baugh, C. M., Frenk, C. S., Baldry, I., Bland-Hawthorn, J., & et al.,. 2005, MNRAS, 362, 505
- Crocce & Scoccimarro (2006) Crocce, M. & Scoccimarro, R. 2006, Phys. Rev. D, 73, 063519
- Crocce & Scoccimarro (2008) —. 2008, Phys. Rev. D, 77, 023533
- Davis et al. (1985) Davis, M., Efstathiou, G., Frenk, C. S., & White, S. D. M. 1985, ApJ, 292, 371
- Eisenstein & Hu (1999) Eisenstein, D. J. & Hu, W. 1999, ApJ, 511, 5
- Eisenstein et al. (2005) Eisenstein, D. J., Zehavi, I., Hogg, D. W., Scoccimarro, R., Blanton, M. R., Nichol, R. C., Scranton, R., Seo, H.-J., & et al.,. 2005, ApJ, 633, 560
- Faltenbacher et al. (2009) Faltenbacher, A., Li, C., White, S. D. M., Jing, Y.-P., Shu-DeMao, & Wang, J. 2009, Research in Astronomy and Astrophysics, 9, 41
- Gilbank et al. (2011) Gilbank, D. G., Gladders, M. D., Yee, H. K. C., & Hsieh, B. C. 2011, AJ, 141, 94
- Hao et al. (2010) Hao, J., McKay, T. A., Koester, B. P., Rykoff, E. S., Rozo, E., Annis, J., Wechsler, R. H., Evrard, A., Siegel, S. R., Becker, M., Busha, M., Gerdes, D., Johnston, D. E., & Sheldon, E. 2010, ApJS, 191, 254
- Hill et al. (2004) Hill, G. J., Gebhardt, K., Komatsu, E., & MacQueen, P. J. 2004, in The New Cosmology: Conference on Strings and Cosmology, ed. . C. N. P. R. E. Allen, D. V. Nanopoulos, Vol. 743, 224–233
- Kaiser et al. (2002) Kaiser, N., Aussel, H., Burke, B. E., Boesgaard, H., Chambers, K., Chun, M. R., Heasley, J. N., Hodapp, K.-W., & et al.,. 2002, in Society of Photo-Optical Instrumentation Engineers (SPIE) Conference Series, ed. J. A. T. . S. Wolff, Vol. 4836, 154–164
- Kazin et al. (2010) Kazin, E. A., Blanton, M. R., Scoccimarro, R., McBride, C. K., Berlind, A. A., Bahcall, N. A., Brinkmann, J., Czarapata, P., & et al.,. 2010, ApJ, 710, 1444
- Kazin et al. (2012) Kazin, E. A., Sánchez, A. G., & Blanton, M. R. 2012, MNRAS, 419, 3223
- Linder (2003) Linder, E. V. 2003, Physical Review Letters, 90, 091301
- Martínez et al. (2009) Martínez, V. J., Arnalte-Mur, P., Saar, E., de la Cruz, P., Pons-Bordería, M. J., Paredes, S., Fernández-Soto, A., & Tempel, E. 2009, ApJ, 696, L93
- Matsubara (2004) Matsubara, T. 2004, ApJ, 615, 573
- McDonald & Eisenstein (2007) McDonald, P. & Eisenstein, D. J. 2007, Phys. Rev. D, 76, 063009
- Okumura et al. (2009) Okumura, T., Jing, Y. P., & Li, C. 2009, ApJ, 694, 214
- Page et al. (2003) Page, L., Nolta, M. R., Barnes, C., Bennett, C. L., Halpern, M., Hinshaw, G., Jarosik, N., Kogut, A., & et al.,. 2003, ApJS, 148, 233
- Paz et al. (2008) Paz, D. J., Stasyszyn, F., & Padilla, N. D. 2008, MNRAS, 389, 1127
- Peebles (1980) Peebles, P. J. E. 1980, The large-scale structure of the universe, ed. P. J. E. Peebles
- Peebles & Yu (1970) Peebles, P. J. E. & Yu, J. T. 1970, ApJ, 162, 815
- Percival et al. (2007) Percival, W. J., Cole, S., Eisenstein, D. J., Nichol, R. C., Peacock, J. A., Pope, A. C., & Szalay, A. S. 2007, MNRAS, 381, 1053
- Percival et al. (2010) Percival, W. J., Reid, B. A., Eisenstein, D. J., Bahcall, N. A., Budavari, T., Frieman, J. A., Fukugita, M., Gunn, J. E., & et al.,. 2010, MNRAS, 401, 2148
- Prada et al. (2011) Prada, F., Klypin, A., Yepes, G., Nuza, S. E., & Gottloeber, S. 2011, ArXiv e-prints
- Reid et al. (2010) Reid, B. A., Percival, W. J., Eisenstein, D. J., Verde, L., Spergel, D. N., Skibba, R. A., Bahcall, N. A., Budavari, T., & et al.,. 2010, MNRAS, 404, 60
- Sánchez et al. (2009) Sánchez, A. G., Crocce, M., Cabré, A., Baugh, C. M., & Gaztañaga, E. 2009, MNRAS, 400, 1643
- Schlegel et al. (2011) Schlegel, D., Abdalla, F., Abraham, T., Ahn, C., Allende Prieto, C., Annis, J., Aubourg, E., Azzaro, M., & et al.,. 2011, ArXiv e-prints
- Schlegel et al. (2009) Schlegel, D., White, M., & Eisenstein, D. 2009, in astro2010: The Astronomy and Astrophysics Decadal Survey, Vol. 2010, 314–+
- Schneider et al. (2011) Schneider, M. D., Frenk, C. S., & Cole, S. 2011, ArXiv e-prints
- Seo et al. (2009) Seo, H.-J., Eckel, J., Eisenstein, D. J., Mehta, K., Metchnik, M., Padmanabhan, N., Pinto, P., Takahashi, R., & et al.,. 2009, ArXiv e-prints
- Seo & Eisenstein (2003) Seo, H.-J. & Eisenstein, D. J. 2003, ApJ, 598, 720
- Seo & Eisenstein (2007) —. 2007, ApJ, 665, 14
- Seo et al. (2008) Seo, H.-J., Siegel, E. R., Eisenstein, D. J., & White, M. 2008, ApJ, 686, 13
- Smith et al. (2003) Smith, R. E., Peacock, J. A., Jenkins, A., White, S. D. M., Frenk, C. S., Pearce, F. R., Thomas, P. A., Efstathiou, G., & Couchman, H. M. P. 2003, MNRAS, 341, 1311
- Springel (2005) Springel, V. 2005, MNRAS, 364, 1105
- Springel et al. (2005) Springel, V., White, S. D. M., Jenkins, A., Frenk, C. S., Yoshida, N., Gao, L., Navarro, J., Thacker, R., & et al.,. 2005, Nature, 435, 629
- Sunyaev & Zeldovich (1970) Sunyaev, R. A. & Zeldovich, Y. B. 1970, Ap&SS, 7, 3
- Sylos Labini et al. (2009) Sylos Labini, F., Vasilyev, N. L., Baryshev, Y. V., & López-Corredoira, M. 2009, A&A, 505, 981
- The Dark Energy Survey Collaboration (2005) The Dark Energy Survey Collaboration. 2005, ArXiv Astrophysics e-prints
- Wang (2006) Wang, Y. 2006, ApJ, 647, 1