The young open cluster Berkeley 55**affiliation: Partially based on observations collected at the Nordic Optical Telescope and the William Herschel Telescope (La Palma)
Abstract
We present photometry of the highly reddened and poorly studied open cluster Berkeley 55, revealing an important population of B-type stars and several evolved stars of high luminosity. Intermediate resolution far-red spectra of several candidate members confirm the presence of one F-type supergiant and six late supergiants or bright giants. The brightest blue stars are mid-B giants. Spectroscopic and photometric analyses indicate an age Myr. The cluster is located at a distance kpc, consistent with other tracers of the Perseus Arm in this direction. Berkeley 55 is thus a moderately young open cluster with a sizable population of candidate red (super)giant members, which can provide valuable information about the evolution of intermediate-mass stars.
1 Introduction
After exhaustion of H in their cores, stars evolve toward lower , becoming, according to their masses, red giants or supergiants (RSGs). Both high- and intermediate-mass stars are subject to complex physical processes in their later evolution, which result in important changes in their observable characteristics (, ). As a consequence, their evolutionary tracks trace loops in the HR diagrams (e.g., Chiosi et al., 1992). The shape of these loops depends on the physics of the stellar interior, generally modeled via poorly understood parameters (e.g., Chiosi et al., 1992; Mowlavi & Forestini, 1994; Salasnich et al., 1999; Meynet & Maeder, 2000). The extent of semi-convection and overshooting has very important consequences on many aspects of stellar evolution, most notably the ratio of initial mass to white dwarf mass (e.g., Jeffries, 1997; Weidemann, 2000) and the boundary between stars that leave white dwarfs as remnants and those that explode as supernovae (SNe; e.g., Poelarends et al., 2008).
M-type supergiants represent the final evolutionary stage of moderately massive stars, with typical initial masses in the 8–25 range (Levesque et al., 2005). Such objects are the immediate progenitors of Type II-P SNe, the most frequent type of supernova explosion in the Local Universe (Smartt, 2009; Smith et al., 2011). Most of the explosions come from low-mass RSGs, stars with initial masses . The lower mass limit for a star to produce a supernova has been estimated at (Smartt et al., 2009). Nevertheless, stars with lower masses are also classified as supergiants, generally K Ib objects, showing that the morphological separation between red supergiants and red giants does not coincide exactly with the boundary between high- and intermediate-mass stars.
Since stars become more luminous as they experience blue loops and later enter the AGB branch, a given star may appear first as a bright giant and later in its evolution as a supergiant. Open clusters with large populations of evolved stars can help constrain the inputs of models and therefore improve our understanding of such basic questions. Identification and study of such clusters is thus an important astrophysical issue.
To this aim, we have analyzed a sample of poorly-studied, cataloged, optically-visible clusters in the Northern Hemisphere, using 2MASS data (, 2006). We made use of the index, a reddening-free parameter, defined as , which has been proved to be a very useful tool for identification of intrinsically blue stars (see, e.g., Comerón & Pasquali, 2005; Negueruela & Schurch, 2007) and separation of luminous red stars from red dwarfs (Negueruela et al., 2011). Berkeley 55 (Be 55) was readily identified as containing an obvious clump of red luminous stars associated with a sequence of intrinsically blue stars.
Be 55 is a faint, compact open cluster in the constellation Cygnus. The WEBDA database111At http://www.univie.ac.at/webda/ provides coordinates RA: 21h 16m 58s, Dec: (, ). Maciejewski & Niedzielski (2007) presented photometry of an extended field around the obvious cluster core and found it to be extremely compact, with . They derived a distance kpc and an age (315 Myr), which was later used by Tadross (2008) to calibrate a fit to the 2MASS data in the region. However, the cluster looks too compact for this age and distance, while the isochrone fit of Tadross (2008) would suggest that most of the evolved cluster members are AGB stars, an extremely unusual situation.
In this paper, we present photometry of the cluster area and a spectroscopic survey of likely members, showing that its population is much younger than implied by the single-color fit of Maciejewski & Niedzielski (2007). From our new data, we show that Be 55 is a young () open cluster with a rich population of evolved stars.
2 Observations and data
2.1 Optical photometry
photometry of Be 55 was obtained in service mode using ALFOSC on the Nordic Optical Telescope at the Roque de los Muchachos Observatory (La Palma, Spain) on the night of June 14th, 2010. In imaging mode, the camera covers a field of and has a pixel scale of /pixel.
One standard field from the list of Landolt (1992), PG 1323086, was observed twice during the night in order to provide standard stars for the transformation. Since the number of measurements was too low to trace the extinction during the night, we used the median extinction coefficients for the observatory, after verifying that the two measurements of the standards were fully compatible with these values. The images were processed for bias and flat-fielding corrections with the standard procedures using the CCDPROC package in IRAF222IRAF is distributed by the National Optical Astronomy Observatories, which are operated by the Association of Universities for Research in Astronomy, Inc., under cooperative agreement with the National Science Foundation. Aperture photometry using the PHOT package inside DAOPHOT (IRAF, DAOPHOT) was developed on these fields with the same aperture, 21 pixels, for each filter.
Images of Be 55 were taken in 2 series of different exposure times to obtain accurate photometry for a magnitude range. The log of observations is presented in Table 1. The reduction of the images of Be 55 was done with IRAF routines for the bias and flat-field corrections. Photometry was obtained by point-spread function (PSF) fitting using the DAOPHOT package (Stetson, 1987) provided by IRAF. The apertures used are of the order of the FWHM. In this case, we used a value of 5 pixels for all images in the and filters and a value of 4 pixels for the filter images.
| Berkeley 55 | RA = 21h 16m 59.9s | DEC = |
|---|---|---|
| (J2000) | (J2000) |
| Exposure times (s) | ||
| Filter | Long times | Short times |
| 900 | 250 | |
| 200 | 60 | |
| 40 | 10 | |
In order to construct the PSF empirically, we automatically selected bright stars (typically 25 stars). After this, we reviewed the candidates and discarded those that did not fulfill all the best conditions for a good PSF star. Once we had the list of PSF stars (), we determined an initial PSF by fitting the best function between the 5 options offered by the PSF routine inside DAOPHOT. We allowed the PSF to be variable (in order 2) across the frame to take into account the systematic pattern of PSF variability with position on the chip.
We needed to perform aperture correction for each frame in all filters. Finally, we obtained the instrumental magnitudes for all stars. Using the standard stars and the median extinction coefficients for the observatory, we carried out the transformation of the instrumental magnitudes to the standard system by means of the PHOTCAL package inside IRAF.
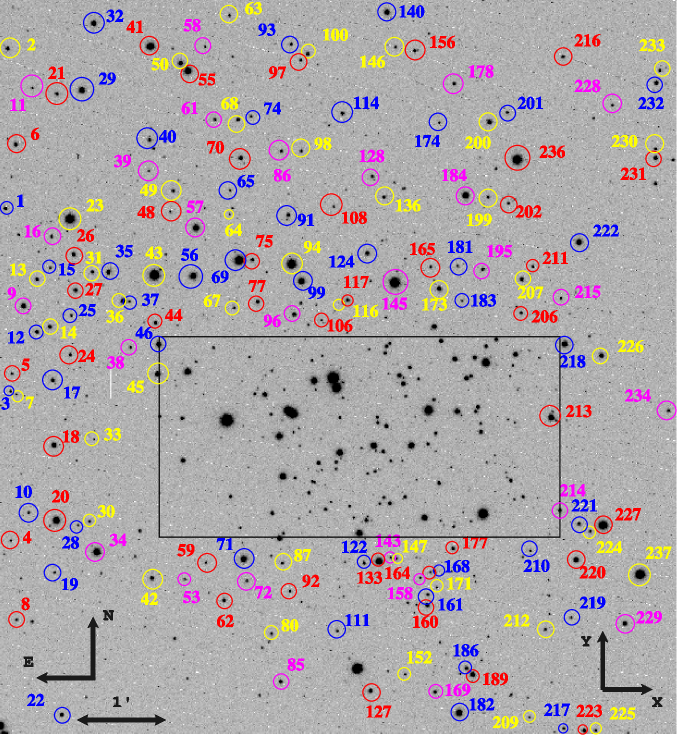
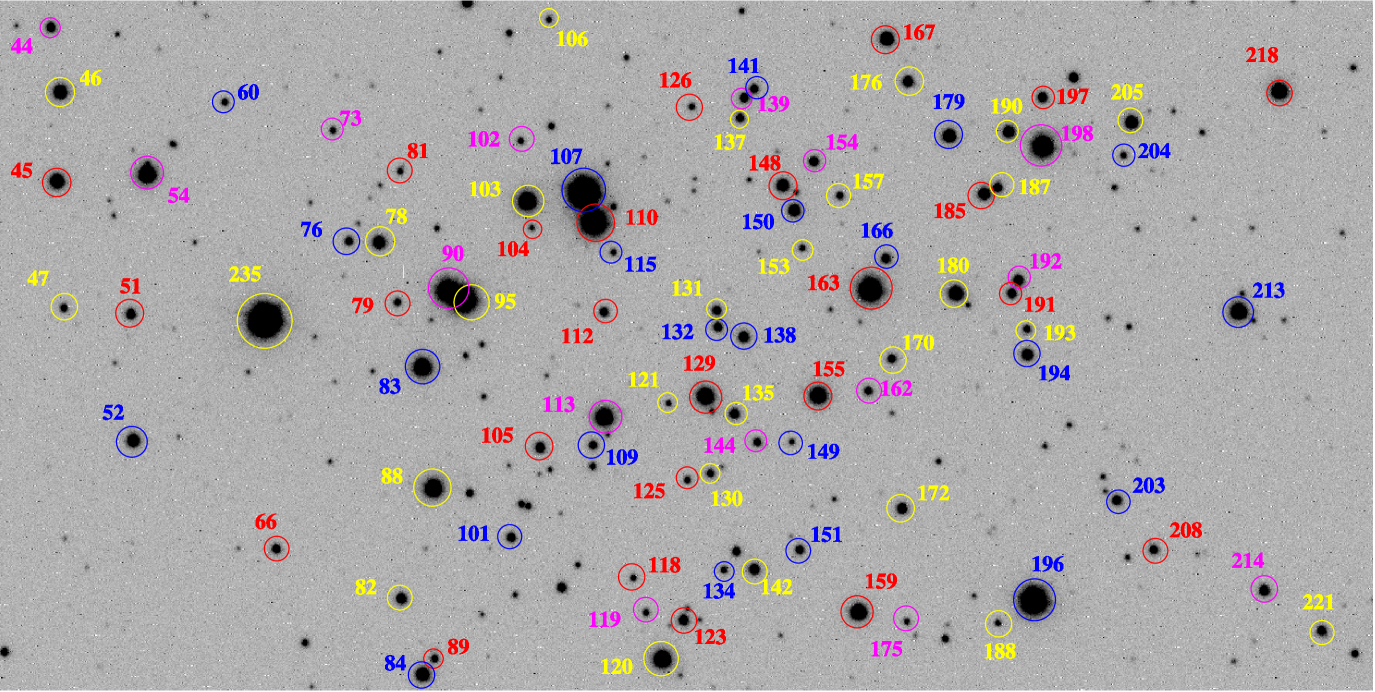
The number of stars that we could detect in all filters is limited by the long exposure time in the filter. We identify all stars with good photometry in all three filters on the image in Figures 1 and 2. In Table 6, we list their and positions as seen in Fig. 1, and their identification with objects in the 2MASS catalog. The designation of each star is given by the number indicated on the images (Fig. 1 and Fig. 2). We have photometry for 237 stars in the field. In Table 7, we list the values of , and with the standard deviation and the number of measurements for each magnitude or index.
We can compare our photometry with the only existing dataset, that of Maciejewski & Niedzielski (2007). We find average differences (literature this work) in of . This shows important dispersion, but no systematic effects. The average difference in is , suggesting a small systematic difference, though not much higher than the standard deviation. We note that, with a pixel size of and a reported typical seeing around , the photometry of Maciejewski & Niedzielski (2007) may be subject to important crowding effects near the cluster core.
2.2 2MASS data
We obtained photometry from the 2MASS catalog. The completeness limit of this catalog is set at . None of the stars analyzed is bright enough to come close to the non-linear regime for 2MASS. We used the 2MASS data to select targets for spectroscopy.
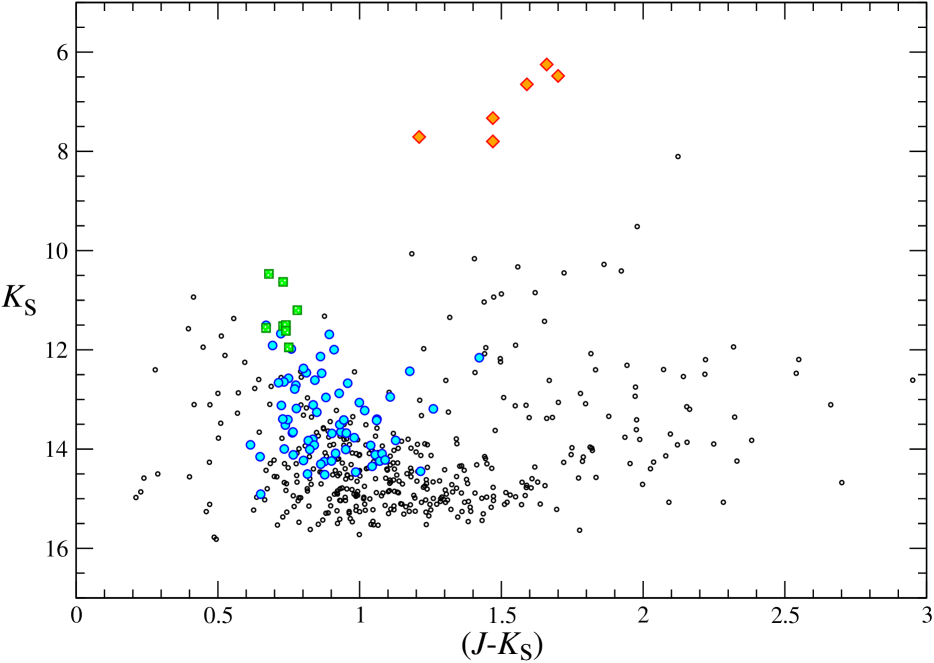
We selected our targets using 2MASS data. We took a circle of radius around the cluster center and built the corresponding diagram (displayed in Fig. 3). All the stars with (shown as diamonds) are clumped together in a small region of the diagram. Their is in all cases. This shows that they are not field red dwarfs or red clump giants, and suggests that they may be luminous red stars (Negueruela et al., 2011). We also used the index to separate early-type stars (cf. Comerón & Pasquali, 2005; Negueruela & Schurch, 2007). As they are expected to show , we select stars with (shown as filled circles and squares in Fig. 3). This range is intended to account for the typical errors in 2MASS (generally mag in a given color for stars with ) and also include emission-line stars, which typically have (e.g., Negueruela et al., 2007). This selection clearly shows all early-type stars in the field to concentrate around , forming an approximately vertical sequence with a sharp blue edge at (Fig. 3).
We performed the same analysis for 2MASS data on concentric circles of increasing radii around the same position, finding no significant increase in the number of candidate members. This is in good agreement with the estimation by Maciejewski & Niedzielski (2007) of a very concentrated cluster with . Extending the search to , we only find one candidate that seems to fall together with the red clump, both in the and diagrams. This is 2MASS J21165198+5150410, which we consider a candidate member below (under the name S61).
2.3 Spectroscopy
We obtained spectra in the far red of the brightest early-type candidates (identified as green squares in Fig. 3) and the seven candidate red luminous stars using the red arm of the ISIS double-beam spectrograph, mounted on the 4.2-m William Herschel Telescope (WHT) in La Palma (Spain). The instrument was fitted with the R600R grating and the Red+ CCD. This configuration covers the 7600 – 9000Å range in the unvignetted section of the CCD with a nominal dispersion of 0.5Å/pixel. Observations were taken during a service night on 26th July 2007 and then completed during a run on 21st August 2007. In July, the CCD was unbinned, and a slit was used. In August, the CCD was binned by a factor 2 in the spectral direction, and a slit was used. In both cases, the resolution element is expected to be 4 unbinned pixels. This has been checked by measuring the width of arc lines, which is on average Å for both configurations. The resolving power of our spectra is therefore .
A log of these observations is presented in Table 2, where each star is given an identification starting with S, and the correspondence with the numbering in the photometry is indicated. In addition to the stars targeted, two other photometric members also fell inside the slit by chance. One of them, #213 (S19 in Fig. 8), is a bright member which turns out to be a Be star. The other one, #170, is very faint and the spectrum is noisy, simply confirming that it is a B-type star.
| Star | Phot11Cross-correlation with numbering system in Table 7. | Exposure | Date | Time | SNR22 The SNR has been estimated for the B-type stars from the RMS of fits to continuum regions. In the red supergiants, where there are no spectral windows free of lines, it is an extrapolation based on the count rate. The SNR is for each 0.5Å binned pixel. |
| Time (s) | (UT) | ||||
| S1332MASS J21165840+5143262, saturated in our photometry. | 200 | 21 Aug 2007 | 01:07 | 300 | |
| S2 | 196 | 400 | 26 Jul 2007 | 00:43 | 340 |
| S3 | 163 | 400 | 26 Jul 2007 | 00:43 | 220 |
| S4 | 110 | 400 | 26 Jul 2007 | 01:12 | 260 |
| S5 | 107 | 400 | 26 Jul 2007 | 01:12 | 310 |
| S6 | 145 | 400 | 26 Jul 2007 | 00:58 | 330 |
| S61 | 200 | 21 Aug 2007 | 01:13 | 370 | |
| S7 | 94 | 400 | 26 Jul 2007 | 01:12 | 140 |
| S8 | 99 | 1000 | 21 Aug 2007 | 01:27 | 110 |
| S9 | 198 | 400 | 26 Jul 2007 | 00:58 | 110 |
| S10 | 83 | 1000 | 21 Aug 2007 | 01:27 | 140 |
| S12 | 113 | 600 | 26 Jul 2007 | 01:24 | 90 |
| S13 | 129 | 600 | 26 Jul 2007 | 01:24 | 90 |
| S15 | 159 | 1000 | 21 Aug 2007 | 02:01 | 90 |
| S16 | 133 | 1000 | 21 Aug 2007 | 02:01 | 100 |
All spectroscopic data were reduced using the Starlink software packages CCDPACK (Draper et al., 2000) and FIGARO (Shortridge et al., 2004). We used standard procedures for bias subtraction and flat-fielding (with internal halogen lamps). The spectra have been normalized to the continuum using DIPSO (Howarth et al., 1998).
3 Results
3.1 Observational HR diagram
We start the photometric analysis by plotting the and diagrams for all stars in the field. In Figure 4, we can observe that the cluster sequence (as defined by the spectroscopic members) is heavily contaminated by what seems to be foreground population.

3.1.1 The reddening law
The first step is determining whether the extinction law in the direction of the field is standard. We start by selecting the B-type stars observed spectroscopically. For them, we calculate the ratio using the calibration of intrinsic colors by FitzGerald (1970). For 6 stars, we find rather homogeneous values, with average , quite close to the standard value .
We also use the CHORIZOS ( code for parametrized modeling and characterization of photometry and spectroscopy) code developed by Maíz-Apellániz (2004). This code fits synthetic photometry derived from the spectral distribution of a stellar model convolved with an extinction law (Cardelli et al., 1988) to reproduce the observed magnitudes. We use our photometry and data from 2MASS. This set of photometric values is well suited to find the general shape of the extinction law (Maíz-Apellániz, 2004). On the other hand, the functional form of the law used by Cardelli et al. (1988), a 7th degree polynomial, may lead to an artificial bumpiness of the extinction law for high values of .
For the stars with spectral types, we use as input for CHORIZOS the photometry and the corresponding to the spectral type derived according to the calibrations of FitzGerald (1970). The output of CHORIZOS is the value of and the color excess . For all our stars, the preferred value of is close to 3.1, with little dispersion.
3.1.2 Membership determination
Since the extinction is close to standard, we can use the classical parameter (Johnson & Morgan, 1952) to estimate the spectral types for all the stars in the field. A first test with the stars with spectral types supports the use of , as the standard value 0.72 gives too early spectral types when compared to the spectroscopic ones (see below). Even such small difference in the ratio of color excesses, when combined with the high , introduces differences of about two subtypes.
Taking into account the photometric spectral types and the position of the stars in the CMDs, we select the likely members of Be 55. We identify 138 members, all with spectral types between b3 and a0. We proceed then to estimate the reddening for all the likely members with CHORIZOS. As input, we use the photometry and the corresponding to the photometric spectral type, according to the calibrations of FitzGerald (1970). We find that the average color excess is , where the error represents the dispersion in individual values amongst all 138 members in our photometric field.
In Fig. 5, we plot the dereddened diagram for likely members of Be 55. We perform a visual fit to the ZAMS from Mermilliod (1981) and from Schmidt-Kaler (1982), obtaining a distance modulus . In Table 3, we display the values of , and photometric spectral types for all photometric members.

| Star | Photometric spectral type | ||||
|---|---|---|---|---|---|
| 1 | 1.67 | 0.03 | 13.26 | 0.06 | b8 |
| 4 | 2.15 | 0.02 | 13.36 | 0.07 | b7 |
| 5 | 1.76 | 0.02 | 14.27 | 0.11 | b9 |
| 6 | 1.74 | 0.03 | 12.53 | 0.04 | b8 |
| 7 | 1.99 | 0.02 | 13.32 | 0.09 | b8 |
| 8 | 1.89 | 0.02 | 13.51 | 0.07 | b9 |
| 10 | 1.94 | 0.02 | 13.52 | 0.07 | b8 |
| … | … | … | … | … | … |
3.2 Spectroscopic analysis
Because of the high reddening, stars in Berkeley 55 are faint in , and intermediate-resolution spectra in the classification region would require long integrations with large apertures. Alternatively, we resort to the far red, where the stars are much brighter and classification criteria exist.
3.2.1 Bright red stars
Figure 6 shows the -band spectra of the 7 bright red stars in the field preselected as candidate members. Six of them have pretty similar spectra, typical of late-type stars, with S5 appearing clearly earlier.
| Star | Ca ii 8498.0Å | Ca ii 8542.1Å | Ca ii 8662.1 | Blend 8468Å |
|---|---|---|---|---|
| S1 | 3.2 | 5.2 | 4.0 | 1.4 |
| S2 | 3.0 | 5.3 | 4.0 | 1.3 |
| S3 | 2.7 | 4.9 | 3.6 | 1.0 |
| S4 | 3.6 | 5.0 | 3.6 | 1.2 |
| S522Note that the values for S5 must include the blended Paschen lines. | 2.9 | 6.0 | 4.9 | |
| S6 | 2.8 | 4.9 | 3.5 | 1.2 |
| S61 | 2.4 | 4.7 | 3.7 | 1.1 |
In late-type stars, at a given metallicity, the strength of the metallic spectrum increases with luminosity (Ginestet et al., 1994; Carquillat et al., 1997). Luminosity criteria at resolutions similar to ours are discussed in Negueruela et al. (2011). In particular, the strength of the Ca ii triplet is strongly correlated with luminosity (Díaz et al., 1989; Zhou, 1991), though it also depends on metallicity and spectral type. The intensity of the Ca ii triplet lines (see measurements in Table 4) shows without doubt that all our 7 objects are luminous stars.
The O i 7774Å triplet is seen in stars earlier than late G. Of all our bright red stars, S5 is the only one displaying this feature. On the other hand, none of our stars displays TiO bands in the spectral range measured, showing that they are earlier than M1 (e.g., Negueruela et al., 2011). For luminous stars in the G5–K5 range, the ratio between the Ti i 8683Å and the Fe i 8679Å lines is very sensitive to temperature (Carquillat et al., 1997). By using this criterion, we find all the stars to lie between G8 and K4, with the exception of S61, which is slightly later, though it is still earlier than M1, as the TiO bandhead at 8660Å is hardly detectable.
For spectral types G–K , Díaz et al. (1989) find that stars with a combined equivalent width (EW) for the two strongest Ca ii lines, EW(Ca ii 8542+Ca ii 8662)9Å are definitely supergiants, independently of metallicity or spectral type, though some supergiants may present slightly lower values of EW. This has recently been re-assessed for a larger sample (Negueruela et al., 2011). Attending to all the criteria and to direct comparison to the standards, S1 and S2 fall clearly in the supergiant region, though both have low luminosity. All the other objects lie in the region where both supergiants and bright giants are found. Attending to their morphology, we classify them as bright giants, with S4 closer to being a supergiant than the others. The spectral types finally derived are listed in Table 5.
In the case of S5, comparison to MK standards observed at similar resolution (e.g., Cenarro et al., 2001) suggests it is an F8 supergiant. The combined EW of the two strongest Ca ii lines is close to Å, but the Paschen lines are still present at this spectral type and thus Pa 13 and Pa 15 must be blended with Ca ii 8662Å and Ca ii 8542Å, respectively. By measuring the EWs of Pa 12, Pa 14 and Pa 17, we estimate that they contribute at most 1.5Å to the blend. Therefore S5 is a supergiant according to all calibrations of the Ca ii triplet (Díaz et al., 1989; Mallik, 1997; Zhou, 1991). The calibration of against the EW of the O i 7774Å triplet (Arellano Ferro et al., 2003) indicates for this object , with a large uncertainty. This is consistent with the expectations for a such a supergiant, especially if it is moving redwards for the first time. In view of this, we accept the morphological classification F8 Ib. This object must thus lie on the instability strip.

| ID | Spectral | 11The typical uncertainty of the photometry is 0.02 mag in and 0.03 mag in . | |||
| type2,32,3footnotemark: | |||||
| S1 | K1 Ib | 6.25 | 1.66 | 0.68 | 0.98 |
| S2 | K0 Ib | 6.65 | 1.59 | 0.63 | 0.96 |
| S3 | G8 II | 7.80 | 1.47 | 0.56 | 0.91 |
| S4 | K0 Ib-II | 7.33 | 1.47 | 0.63 | 0.84 |
| S5 | F8 Ib | 7.71 | 1.21 | 0.35 | 0.86 |
| S6 | K4 II | 6.48 | 1.70 | 0.90 | 0.80 |
| S61 | M0.5 II | 6.15 | 1.55 | 1.04 | 0.51 |
| S7 | B3–4 III (b4) | 10.47 | 0.68 | 0.83 | |
| S8 | B6–8 III (b5) | 11.52 | 0.73 | 0.81 | |
| S9 | B3–4 IIIshell | 10.63 | 0.73 | ||
| S10 | B5–7 III–IV (b5) | 11.20 | 0.78 | 0.88 | |
| S12 | B3–5 IV–V (b4) | 11.50 | 0.74 | 0.87 | |
| S13 | B3–5 IV–V (b5) | 11.62 | 0.74 | 0.87 | |
| S15 | B4–5 IV–V (b5) | 11.95 | 0.75 | 0.87 | |
| S16 | B5–7 III–IV (b5) | 11.56 | 0.67 | 0.79 |
3.2.2 Blue stars
Figure 7 shows spectra of stars with intrinsically blue spectra, while Fig. 8 shows the spectra of two stars with emission lines. The brightest early-type objects are S7 and S9. The -band is not rich in classification features for B-type stars (Andrillat et al., 1995; Munari & Tomasella, 1999). Moderately accurate spectral types can be achieved for supergiants, but stars close to the main sequence are poorer in spectral features and can only receive approximate classifications (Negueruela et al., 2010a). Apart from the strength and width of Paschen lines, the main criterion is the presence of He i lines, which are only moderately strong in supergiants and are hardly seen in mid and late main-sequence B-type stars. All the spectra displayed are clearly dominated by broad Paschen lines and are therefore B-type stars of low or moderate luminosity. The only exception is S9, which looks like an A-type supergiant. However, the presence of O i 8448Å in emission betrays this as a Be star. Some Be shell stars have absorption spectra (due to the circumstellar disk seen close to edge on) that strongly resemble A-type supergiants (Andrillat et al., 1988).

Star S7 has very well defined Paschen lines and resembles rather closely the B5 II star in Fig. 7, though it has lower luminosity. The narrow O i 8448Å indicates a slow rotator and most likely a giant. This is confirmed by the sharpness of the Paschen lines (compare to the B3 V star). We estimate a spectral type B3–4 III. S16 is very similar, though it rotates faster or has a lower luminosity. S10 is a fast rotator, but is likely a giant as well, as a weak He i 8779Å seems to be present. S12, S13 and S15 are closer to the main sequence. The fact that O i 8448Å is weak compared to Paschen 18 places them close to B3. The spectrum of S19 (Fig. 8) is very noisy, but Oi 8448Å is clearly in emission. Therefore it is a Be star. According to Andrillat et al. (1988), late Be stars do not show this line in emission, but only filled-in. Therefore this star is B5 Ve or earlier. Based on the same criterion and its brightness, S9 is likely to be a shell star of spectral type similar to S7. Finally, S8 looks later than all the others, though its reddening is similar to those of the other B stars. A summary of estimated spectral types is given in Table 5.

Caron et al. (2003) developed a method to classify B-type stars by comparing the EWs of the Paschen lines. Application of those criteria suggest slightly later spectral types for our stars, though not all criteria suggest the same result (something expected, as they are only approximate). Following them, S7 would be B5 III, S8 and S10 would be B8 III, and the rest of the stars would be B5 V. These small differences are in all likelihood due to the continuum determination, which is somewhat subjective, and in the case of the Paschen lines (with their very broad wings) may depend to some degree on SNR and resolution.
3.3 Infrared extinction
From the spectral types derived, we can calculate individual infrared reddenings. For the red (super)giants, we use the calibration of Straižys & Lazauskaitė (2009), which uses 2MASS colors. For the blue stars, we use the same calibration, assuming that giants have the same colors as main-sequence stars. For the F supergiant, we use the value from Koornneef (1983). The values derived are shown in Table 5. The reddening seems to be moderately variable across the face of the cluster. The values for the supergiants show a higher dispersion than those of the blue stars, but the average reddening for the 6 red (super)giants (excluding the outlier S61) is (the error is the standard deviation), while the average for 7 B-type stars without emission lines is , fully compatible within their errors. Using the calibrations of Winkler (1997) or Wegner (1994) for the blue stars produces slightly different individual values, but compatible averages.
Comparison of the (Table 3) and excesses for these objects (Table 5) confirms that the extinction law in this direction is close to the galactic average, for which . It is also interesting to note that the B-type stars spectroscopically observed consistently have below the cluster average. This suggest that some of the faint late-B stars taken as photometric members could be background objects.
3.4 Cluster age
The dereddened CMD for Be 55 (Fig. 5) shows that stars brighter than start deviating from the ZAMS. This absolute magnitude corresponds to spectral type B4 V (e.g., Turner, 1980), in good agreement with the determination of spectral types, which indicate that the brightest B-type stars are B3–6 III-IV objects. With such a turn-off, the cluster is expected to have an age Myr. We can improve on this value by fitting isochrones in the different observational CMDs to the position of the red stars and the turn-off.

A fundamental issue is the correct determination of color excesses at such high reddenings. Figure 9 shows the observational diagram for the cluster together with isochrones for (40 Myr) and (50 Myr) from Marigo et al. (2008). Both isochrones fit well the position of the main sequence and the turn-off. S7 appears as a mild blue straggler, which is consistent with its spectral type (a B3–4 III giant when the turn-off is at B4 V). S9 may also be a blue straggler, but shell stars are known to have anomalous colors. The isochrones have been reddened following the procedure described in Girardi et al. (2008), which takes into account color effects for late-type stars. In spite of this, the position of the K (super)giants does not fit the red clump very well for any of the two isochrones. This is likely due to the difficulty in reproducing the extinction law with the polynomial approximation of Cardelli et al. (1988).
Figure 10 shows the CMD for cluster members, with photometry from 2MASS. Isochrones from Marigo et al. (2008) for the same ages are shown, reddened by , the value found for the blue spectroscopic members. All members selected from their colors fall to the right of the isochrones, confirming that this excess corresponds to the less reddened members. Some likely members seem to have much higher color excesses, suggesting that they are either Be stars or background B-type stars (though this is not generally supported by their photometric spectral types). In this CMD, the K (super)giants occupy positions in very good agreement with the 50 Myr isochrone.

The bright star S61, situated from the cluster core falls together with the red (super)giants in this CMD. However, its position does not fit well with its spectral type, later than all the other evolved stars. As seen in Table 5, its reddening is rather lower than that of confirmed members. Its magnitude, taken from Maciejewski & Niedzielski (2007), is compatible with the low reddening. Therefore this object could be a foreground star as well as a cluster member with much lower reddening. This should be checked via radial velocity measurements333Even though our spectra were not taken to measure radial velocities, direct cross-correlation between the spectra of S1 and S61 (the two objects observed with the same configuration) suggests that their radial velocities are very similar.
4 Discussion
We have presented spectroscopy of a sizable sample of stars in the open cluster Berkeley 55, revealing a population of 7 low-luminosity supergiants or bright giants (one of them, not a certain member), 4 mid-B giants and a main sequence starting around B4 V.
4.1 Cluster parameters
Only two previous studies of the cluster have been published. Maciejewski & Niedzielski (2007) derive an age of Myr. Tadross (2008) used their result to calibrate his fitting procedure and therefore derives a similar age of 300 Myr, from a fit to the 2MASS data alone. This age is completely incompatible with the observed population, as stars earlier than B5 are only seen in clusters younger than 100 Myr. Clusters with Myr have stars of spectral type B6 around the main-sequence turn-off (e.g., NGC 7790, Matthews et al. 1995; Berkeley 58, Turner et al. 2008).
The difference between our age determination and that of Maciejewski & Niedzielski (2007) is almost certainly due to the identification of the evolved population. The decontaminated in Maciejewski & Niedzielski (2007) does not show a clump of red stars, as in our Fig. 4. Some of the (super)giants seem to be blended in their images and do not appear in their original photometry. The others are not conspicuous when a wide field is considered, because of contamination by field interlopers with similar color. The stars forming this clump, however, cannot be overlooked when the infrared data are considered. S1 is the brightest star in within of the cluster center, and there are only 5 field stars with magnitudes comparable to the 7 red (super)giants. The 7 candidate members form a clearly separated clump in the /, / and / diagrams, and have similar (and unusual) spectral types. Though accurate radial velocities will be needed to confirm individual memberships, there can be no doubt that they represent the population of evolved stars in the cluster. The small systematic offset in between our photometry and that of Maciejewski & Niedzielski (2007) is unlikely to have biased their age determination. It is simply very difficult to obtain an accurate fit when photometry in only two bands is available.
At Galactic longitude , a distance kpc (corresponding to our ) seems compatible with tracers of the Perseus arm, though some Galactic models suggest a higher distance for this feature. Spiral tracers in this direction are scarce. NGC 7067 () has distance estimates of 3.6 kpc (Yadav & Sagar, 2004) and 4.4 kpc (Hassan, 1973). NGC 7128 (), with (4 kpc), is another likely tracer at some distance from Be 55 (Balog et al., 2001).
As the age of Berkeley 55 is Myr, the red stars in the cluster should have initial masses (Marigo et al., 2008), or slightly higher if they started their lives rotating quickly (cf. Meynet & Maeder, 2000). Such stars define the boundary between intermediate-mass and massive stars, and therefore can provide important constraints for stellar evolution models. Milky Way clusters with similar ages and rich populations of RSGs (or bright giants) are relatively scarce. NGC 6649 ( Myr; Turner 1981) with one Cepheid and four red (super)giants is one of the few examples. NGC 6664 (also 50 Myr; Schmidt 1982) has a similar population, but is less well studied. As a consequence, the sample of Galactic RSGs studied by Levesque et al. (2005) contains almost no stars in the range. The presence of 7 candidate evolved members makes Berkeley 55 a very suitable target to study the physical effects operating during the He-core burning phase of intermediate-mass stars.
4.2 The lowest mass for a supergiant
As mentioned in the introduction, the separation between red supergiants and red bright giants is morphological, and does not coincide with the separation between high-mass and low-mass stars. Of course, making such a distinction necessarily implies dividing a continuum into artificial boxes444It should be noted that many authors classically count luminosity class II objects as supergiants. In spite of that, defining an age limit after which clusters do not contain RSGs seems interesting, as new clusters are being discovered where high extinction renders only the bright red stars accessible for spectroscopy (e.g., Negueruela et al., 2010b; Davies et al., 2011).
Looking at the lists of yellow evolved stars in clusters from Harris (1976) or Sowell (1984, 1987), it is difficult to set an age limit after which Ib supergiants are not seen. A few objects have been classified as K Ib supergiants in clusters Myr old, but in all cases there are alternative lower-luminosity classifications based on more recent data (for example, star 164 in NGC 129, classified K2.5 II-III by Keenan & McNeil 1989555This star seems not to be a member, based on its radial velocity (Memilliod et al., 2008), though it was considered a member for a long time (see references in Turner, 1992).; or star 110 in NGC 2516, classified M1.5 IIa by Keenan & Pitts 1985). Most classical Cepheids appear as F/G Ib supergiants. Many clusters containing Cepheids are sparsely populated and have the Cepheid as only supergiant (e.g., Turner, 1996). In clusters with larger populations, the ratio of F/G supergiants to later spectral types is very variable. For example, NGC 7790 contains three F-type Cepheids, but no red (super)giants, while NGC 6067 (with two Cepheid members) contains a large number of red giants and supergiants (Mermilliod, 1987).
If we consider a number of clusters for which accurate ages in the range of interest have been derived through careful photometric analysis or equivalent methods, we find by decreasing age, that NGC 2516 ( Myr), which has no Cepheids, contains four bright red giants, with luminosity classes II or III (Keenan & Pitts, 1985; González & Lapasset, 2000). IC 4725, which is Myr old, contains one Cepheid supergiant and two class II red giants (Keenan & Pitts, 1985; Mermilliod, 1987). Berkeley 82, with an age Myr contains two yellow bright stars with spectral types G2 II/Ib and K2 II (Forbes, 1986), while Harvard 20 contains a G5 Ib supergiant at Myr (Turner, 1980). On the other hand, NGC 6664, with an age Myr, contains several objects classified as bright giants by Harris (1976). Finally, NGC 6067 contains red stars with luminosity classes II and Ib, leading Mermilliod (1987) to doubt its estimated age Myr, which is also in contradiction with the observed period of its fundamental-mode Cepheid member V340 Nor.
In view of this, it seems that red stars close to the clump position are classified as K supergiants in clusters up to 50–60 Myr, while some stars are classified as such in somewhat older clusters. No cluster older than Myr seems to contain a bona-fide K supergiant. Stars with F and G spectral types, such as Cepheids, are classified as supergiants at older ages, e.g., SZ Tau (F5-9 Ib) in NGC 1647 ( Myr; Turner, 1992).
The classifications derived for stars in Be 55 seem to confirm these trends, with stars on both sides of the divide at an age Myr.
References
- Andrillat et al. (1988) Andrillat, Y., Jaschek, M., & Jaschek, C. 1988, A&AS, 72, 129
- Andrillat et al. (1995) Andrillat, Y., Jaschek, C., & Jaschek, M. 1995, A&AS, 112, 475
- Arellano Ferro et al. (2003) Arellano Ferro, A., Giridhar, S., & Rojo Arellano, E. 2003, RMxAA, 39, 3
- Balog et al. (2001) Balog, Z., Delgado, A. J., Moitinho, A., Fürész, G., Kaszás, G., Vinkó, J., & Alfaro, E. J. 2001, MNRAS, 323, 872
- Cardelli et al. (1988) Cardelli, J.A., Clayton, G.C., & Mathis, J.S. 1988, ApJL, 329, 33
- Caron et al. (2003) Caron, G., Moffat, A.F.J., St-Louis, N., Wade, G.A., & Lester, J.B. 2003, AJ, 126, 1415
- Carquillat et al. (1997) Carquillat, J.M., Jaschek, C., Jaschek, M., & Ginestet, N. 1997, A&AS, 123, 5
- Cenarro et al. (2001) Cenarro, A. J., Cardiel, N., Gorgas, J., Peletier, R.F., Vazdekis, A., & Prada, F. 2001, MNRAS, 326, 959
- Chiosi et al. (1992) Chiosi, C., Bertelli, G., & Bressan, A. 1992, ARA&A 30, 235
- Comerón & Pasquali (2005) Comerón, F., & Pasquali, A. 2005, A&A, 430, 541
- Davies et al. (2011) Davies, B., Bastian, N., Gieles, M., Seth, A.C., Mengel, S., & Konstantopoulus, S. 2011, MNRAS, 411, 1386
- Díaz et al. (1989) Díaz, A.I., Terlevich, E., & Terlevich, R., 1989, MNRAS, 239, 325
- Draper et al. (2000) Draper, P.W., Taylor, M., & Allan, A. 2000, Starlink User Note 139.12, R.A.L.
- FitzGerald (1970) Fitzgerald, M.P. 1970, A&A, 4, 234
- Forbes (1986) Forbes, D. 1986, PASP, 98, 218
- Ginestet et al. (1994) Ginestet, N., Carquillat, J.M., Jaschek, M., & Jaschek, C. 1994, A&AS, 108, 359
- Girardi et al. (2008) Girardi, L., et al. 2008, PASP, 120, 583
- González & Lapasset (2000) González, J.F., & Lapasset, E. 2000, AJ, 119, 2296
- Harris (1976) Harris, G.L.H. 1976, ApJS, 30, 451
- Hassan (1973) Hassan, S.M. 1973, A&AS, 9, 261
- Howarth et al. (1998) Howarth, I., Murray, J., Mills, D., & Berry, D.S. 1998, Starlink User Note 50.21, R.A.L.
- Jeffries (1997) Jeffries, R.D. 1997, MNRAS, 288, 585
- Johnson & Morgan (1952) Johnson, H.L., & Morgan, W.W. 1952, ApJ, 117, 313
- Keenan & Pitts (1985) Keenan, P.C., & Pitts, R.E. 1985, PASP, 97, 297
- Keenan & McNeil (1989) Keenan, P.C., & McNeil, R.C. 1989, ApJS, 71, 245
- Koornneef (1983) Koornneef, J. 1983, A&A, 128, 84
- Landolt (1992) Landolt, A.U. 1992, AJ, 104, 340
- Levesque et al. (2005) Levesque, E.M., Massey, P., Olsen, K.A.G., Plez, B., Josselin, E., Maeder, A., & Meynet, G. 2005, ApJ, 628, 973
- Maciejewski & Niedzielski (2007) Maciejewski, G. & Niedzielski, A. 2007, A&A, 467, 1065
- Maíz-Apellániz (2004) Maíz-Apellániz, J. 2004, PASP, 116, 859
- Mallik (1997) Mallik, S.V., 1997, A&AS, 124, 359
- Marigo et al. (2008) Marigo, P., Girardi, L., Bressan, A., Groenewegen, M.A.T., Silva, L., & Granato, G.L. 2008, A&A, 482, 883
- Matthews et al. (1995) Matthews, J.M., Gieren, W.P., Mermilliod, J.-C., & Welch, D.L. 1995, AJ, 110, 2280
- Mermilliod (1981) Mermilliod, J.-C. 1981, A&A, 97, 235
- Mermilliod (1987) Mermilliod, J.-C. 1987, A&AS, 70, 389
- Memilliod et al. (2008) Mermilliod, J.-C., Mayor, M., & Udry, S. 2008, A&A, 485, 303
- Meynet & Maeder (2000) Meynet, G., & Maeder, A. 2000, A&A, 361, 101
- Mowlavi & Forestini (1994) Mowlavi, N., & Forestini, M. 1994, A&A, 282, 843
- Munari & Tomasella (1999) Munari, U., & Tomasella, L. 1999, A&AS, 137, 521
- Negueruela & Schurch (2007) Negueruela, I., & Schurch, M.P.E. 2007, A&A, 461, 431
- Negueruela et al. (2007) Negueruela, I., Marco, A., Israel, G.L., & Bernabeu, G. 2007, A&A, 471, 485
- Negueruela et al. (2010a) Negueruela, I., Clark, J.S., & Ritchie, B.W. 2010a, A&A, 516, A78
- Negueruela et al. (2010b) Negueruela, I., González-Fernández, C., Marco, A., Clark, J.S., & Martínez-Núñez, S. 2010b, A&A, 513, A74
- Negueruela et al. (2011) Negueruela, I., González-Fernández, C., Marco, A., & Clark, J.S. 2011, A&A, 528, A59
- Poelarends et al. (2008) Poelarends, A.J.T., Herwig, F., Langer, N., & Heger, A. 2008, ApJ, 675, 614
- Salasnich et al. (1999) Salasnich, B., Bressan, A., & Chiosi, C. 1999, A&A, 342, 131
- Shortridge et al. (2004) Shortridge, K., et al. 2004, Starlink User Note 86.21, R.A.L.
- Sowell (1984) Sowell, J.R. 1984, ApJS, 55, 455
- Sowell (1987) Sowell, J.R. 1987, ApJS, 64, 241
- Schmidt (1982) Schmidt, E.G. 1982, AJ, 87, 1197
- Schmidt-Kaler (1982) Schmidt-Kaler, T., 1982, Landolt-Börnstein, N.S. VI, 2b
- (52) Skrutskie, M.F., et al. 2006, AJ, 131, 1163
- Smartt (2009) Smartt, S.J. 2009, ARA&A, 47, 63
- Smartt et al. (2009) Smartt, S.J., Eldridge, J.J., Crockett, R.M., & Maund, J.R. 2009, MNRAS, 395, 1409
- Smith et al. (2011) Smith, N., Li, W., Filippenko, A.V., & Chornock, R. 2011, MNRAS, in press
- Stetson (1987) Stetson, P.B. 1987, PASP, 99, 191
- Straižys & Lazauskaitė (2009) Straižys, V., & Lazauskaitė, R. 2009, Balt. Astr., 18, 19
- Tadross (2008) Tadross, A.L. 2008, MNRAS, 389, 285
- Turner (1980) Turner, D.G. 1980, PASP, 92, 840
- Turner (1981) Turner, D.G. 1981, AJ, 86, 222
- Turner (1992) Turner, D.G. 1992, AJ, 104, 1865
- Turner (1996) Turner, D.G. 1996, JRASC, 90, 82
- Turner et al. (1994) Turner, D.G., Mandushev, G.I., & Forbes, D. 1994, AJ, 107, 1796
- Turner et al. (2008) Turner, D.G., et al. 2008, MNRAS, 388, 444
- Valdes et al. (2004) Valdes, F., Gupta, R., Rose, J.A., Singh, H.P., & Bell, D.J. 2004, ApJS, 152, 251
- Wegner (1994) Wegner, W. 1994, MNRAS, 270, 229
- Weidemann (2000) Weidemann, V. 2000, A&A, 363, 647
- Winkler (1997) Winkler, H. 1997, MNRAS, 287, 481
- Yadav & Sagar (2004) Yadav, R.K.S., & Sagar, R. 2004, MNRAS, 349, 1481
- Zhou (1991) Zhou, X. 1991, A&A, 248, 367
| Star | (Pixels) | (Pixels) | RA (J2000) | Dec (J2000) | Name (2MASS) |
|---|---|---|---|---|---|
| 1 | 15.28 | 1446.924 | 319.327021 | 51.790562 | 21171848+5147260 |
| 2 | 21.685 | 1886.522 | 319.326885 | 51.813904 | 21171845+5148500 |
| 3 | 30.195 | 943.208 | 319.3254 | 51.763935 | 21171809+5145501 |
| 4 | 31.361 | 531.363 | 319.325026 | 51.742191 | 21171800+5144318 |
| 5 | 33.537 | 991.763 | 319.325118 | 51.766521 | 21171802+5145594 |
| 6 | 43.785 | 1622.479 | 319.324686 | 51.799866 | 21171792+5147595 |
| … | … | … | … | … | … |
| Star | |||||||
|---|---|---|---|---|---|---|---|
| 1 | 18.218 | 0.038 | 1.541 | 0.028 | 0.842 | 0.013 | 2 |
| 2 | 18.086 | 0.040 | 1.527 | 0.030 | 1.433 | 0.075 | 2 |
| 3 | 19.400 | 0.024 | 1.768 | 0.030 | 1.361 | 0.080 | 1 |
| 4 | 19.612 | 0.000 | 1.988 | 0.012 | 1.037 | 0.090 | 2 |
| 5 | 19.274 | 0.011 | 1.732 | 0.034 | 0.976 | 0.024 | 2 |
| 6 | 17.898 | 0.037 | 1.670 | 0.024 | 0.846 | 0.019 | 2 |
| 7 | 19.769 | 0.029 | 1.912 | 0.040 | 1.027 | 0.091 | 1 |
| 8 | 19.145 | 0.006 | 1.810 | 0.033 | 1.114 | 0.060 | 2 |
| 9 | 16.891 | 0.021 | 1.393 | 0.041 | 0.580 | 0.011 | 4 |
| … | … | … | … | … | … | … | … |