The LABOCA Survey of the Extended Chandra Deep Field South: Clustering of submillimetre galaxies
Abstract
We present a measurement of the spatial clustering of submillimetre galaxies (SMGs) at –3. Using data from the 870 m LABOCA submillimetre survey of the Extended Chandra Deep Field South, we employ a novel technique to measure the cross-correlation between SMGs and galaxies, accounting for the full probability distributions for photometric redshifts of the galaxies. From the observed projected two-point cross-correlation function we derive the linear bias and characteristic dark matter halo masses for the SMGs. We detect clustering in the cross-correlation between SMGs and galaxies at the level. Accounting for the clustering of galaxies from their autocorrelation function, we estimate an autocorrelation length for SMGs of Mpc assuming a power-law slope , and derive a corresponding dark matter halo mass of . Based on the evolution of dark matter haloes derived from simulations, we show that that the descendants of SMGs are typically massive ( 2–3 ) elliptical galaxies residing in moderate- to high-mass groups (). From the observed clustering we estimate an SMG lifetime of 100 Myr, consistent with lifetimes derived from gas consumption times and star-formation timescales, although with considerable uncertainties. The clustering of SMGs at is consistent with measurements for optically-selected quasi-stellar objects (QSOs), supporting evolutionary scenarios in which powerful starbursts and QSOs occur in the same systems. Given that SMGs reside in haloes of characteristic mass , we demonstrate that the redshift distribution of SMGs can be described remarkably well by the combination of two effects: the cosmological growth of structure and the evolution of the molecular gas fraction in galaxies. We conclude that the powerful starbursts in SMGs likely represent a short-lived but universal phase in massive galaxy evolution, associated with the transition between cold gas-rich, star-forming galaxies and passively evolving systems.
keywords:
galaxies: evolution – galaxies: high-redshift – galaxies: starburst – large-scale structure of the Universe – submillimetre.1 Introduction
Submillimetre galaxies (SMGs) are a population of high-redshift ultraluminous infrared galaxies (ULIRGs) selected through their redshifted far-infrared emission in the submillimetre waveband (e.g., Smail, Ivison & Blain, 1997; Barger et al., 1998; Hughes et al., 1998; Blain et al., 2002). The redshift distribution of this population appears to peak at (e.g., Chapman et al., 2003, 2005; Wardlow et al., 2011), so that SMGs are at their commonest around the same epoch as the peak in powerful active galactic nuclei (AGN) and specifically quasi-stellar objects (QSOs) (e.g., Richards et al., 2006; Assef et al., 2011). This correspondence may indicate an evolutionary link between SMGs and QSOs, similar to that suggested at low redshift between ULIRGs and QSOs by Sanders et al. (1988). However there is little direct overlap ( a few percent) between the high-redshift SMG and QSO populations (e.g., Page et al., 2004; Chapman et al., 2005; Stevens et al., 2005; Alexander et al., 2008; Wardlow et al., 2011). The immense far-infrared luminosities of SMGs are widely believed to arise from intense, but highly-obscured, gas-rich starbursts (e.g., Greve et al., 2005; Alexander et al., 2005; Pope et al., 2008; Tacconi et al., 2006, 2008; Ivison et al., 2011), suggesting that they may represent the formation phase of the most massive local galaxies: giant ellipticals (e.g., Eales et al., 1999; Swinbank et al., 2006).
SMGs and QSOs may thus represent phases in an evolutionary sequence that eventually results in the population of local massive elliptical galaxies. This is a compelling picture, but testing the evolutionary links is challenging due to the lack of an easily-measured and conserved observable to tie the various populations together. For example, the stellar masses of both QSOs and SMGs are difficult to measure reliably due to either the brightness of the nuclear emission in the QSOs (e.g., Croom et al., 2004; Kotilainen et al., 2009) or strong dust obscuration and potentially complex star-formation histories for the SMGs (e.g., Hainline et al. 2011; Wardlow et al. 2011; but see also Dunlop 2011; Michałowski et al. 2011), while the details of the high-redshift star formation that produced local massive elliptical galaxies are likewise poorly constrained (e.g., Allanson et al., 2009). Deriving dynamical masses for QSO hosts from rest-frame optical spectroscopy is difficult due to the very broad emission lines from the AGN, while dynamical mass measurements using CO emission in gas-rich QSOs are also challenging, due to the potential non-isotropic orientation of the QSO hosts on the sky and the lack of high-resolution velocity fields necessary to solve for this (Coppin et al., 2008), as well as the general difficulties in modeling CO kinematics (e.g., Tacconi et al., 2006; Bothwell et al., 2010; Engel et al., 2010).
Another possibility is to compare source populations via the masses of their central black holes. For QSOs and the population of SMGs that contain broad-line AGN, the black hole mass can be estimated using virial techniques based on the broad emission lines (e.g., Vestergaard, 2002; Peterson et al., 2004; Vestergaard & Peterson, 2006; Kollmeier et al., 2006; Shen et al., 2008). Such studies generally find that SMGs have small black holes relative to the local black hole-galaxy mass relations (e.g., Alexander et al., 2008; Carrera et al., 2011), while the black holes in QSOs tend to lie above the local relation, with masses similar to those in local massive ellipticals (e.g., Decarli et al., 2010; Bennert et al., 2010; Merloni et al., 2010). These results suggest that SMGs represent an earlier evolutionary stage, prior to the QSO phase in which the black hole reaches its final mass. However, high-redshift virial black hole mass estimates are highly uncertain (e.g., Marconi et al., 2008; Fine et al., 2010; Netzer & Marziani, 2010) and may suffer from significant selection effects (e.g., Lauer et al., 2007; Shen & Kelly, 2010; Kelly et al., 2010), and so conclusions about connections between populations are necessarily limited.
The difficulties discussed above lead us to take another route to compare SMGs to high-redshift QSOs and low-redshift ellipticals: through their clustering. Spatial correlation measurements provide information about the characteristic bias and hence mass of the haloes in which galaxies reside (e.g., Kaiser, 1984; Bardeen et al., 1986), and so provide a robust mass estimate that is free of many of the systematics in measuring stellar or black hole masses. The observed clustering of SMGs and QSOs can thus allow us to test whether these populations are found in similar haloes and so may evolve into each other over short timescales. With knowledge of how haloes evolve over cosmic time (e.g., Lacey & Cole, 1993; Fakhouri, Ma & Boylan-Kolchin, 2010), we can also explore the links to modern elliptical galaxies (e.g., Overzier et al., 2003), as well as the higher-redshift progenitors of SMGs. Clustering measurements can also provide constraints on theoretical studies that explore the nature of SMGs in a cosmological context. Recent models for SMGs as relatively long-lived ( 0.5 Gyr) star formation episodes in the most massive galaxies, driven by the early collapse of the dark matter halo (Xia et al., 2011), or powered by steady accretion of intergalactic gas (Davé et al., 2010), yield strong clustering for bright sources (850 m fluxes a few mJy) with correlation lengths Mpc. In contrast, models in which SMGs are short-lived bursts in less massive galaxies, with large luminosities produced by a top-heavy initial mass function, predict significantly weaker clustering with Mpc (Almeida, Baugh & Lacey, 2011).
Attempts to measure the clustering of SMGs from their projected two-dimensional distribution on the sky have for the most part been ambiguous (Scott et al., 2002; Borys et al., 2003; Webb et al., 2003; Weiß et al., 2009; Williams et al., 2011; Lindner et al., 2011). Weiß et al. (2009) used the largest, contiguous extragalactic 870-m survey (of the Extended Chandra Deep Field South; ECDFS), to derive the clustering of -mJy SMGs from their projected distribution on the sky. They estimated a correlation length of Mpc. Most recently, Williams et al. (2011) analysed a 1100-m survey of a region of the COSMOS field and placed 1- upper limits on the clustering of bright SMGs (with apparent 870-m fluxes –10 mJy) of –12 Mpc.
Other work has attempted to improve on angular correlation measurements by including redshift information. Using the spectroscopic redshift survey of 73 SMGs with 870-m fluxes of mJy spread across seven fields from Chapman et al. (2005), Blain et al. (2004) estimated a clustering amplitude from the numbers of pairs of SMGs within a 1000-km s-1 wide velocity window. They derived an effective correlation length of Mpc, suggesting that SMGs are strongly clustered. However their methodology was subsequently criticised by (Adelberger, 2005), who suggested that accounting for angular clustering of sources and the redshift selection function significantly increases the uncertainties. Using data from the Chandra Deep Field-North, Blake et al. (2006) computed the angular cross-correlation between SMGs and galaxies in slices of spectroscopic and photometric redshift. They obtained a significant SMG-galaxy cross-correlation signal, with hints that SMGs are more strongly clustered than the optically-selected galaxies, although with only marginal ( 2) significance. Previous work has therefore pointed toward SMGs being a strongly clustered population, but their precise clustering amplitude, along with their relationship to QSOs and ellipticals, remains uncertain.
To make improved measurements of the clustering of SMGs, we need either much larger survey areas (see Cooray et al. 2010 for a wide-field clustering measurement for far-IR detected sources) or the inclusion of redshift information (to allow us to reduce the effects of projection on our clustering measurements). To this end, we have reanalysed the Weiß et al. (2009) survey of ECDFS using new spectroscopic and photometric redshift constraints on the counterparts to SMGs (Wardlow et al., 2011) as well as a large catalogue of “normal” (less-active) galaxies in the same field. We employ a new clustering analysis methodology (Myers, White & Ball, 2009) to calculate the projected spatial cross-correlation between SMGs and galaxies, to obtain the tightest constraint to date on the clustering amplitude of SMGs.
This paper is organised as follows. In § 2 we introduce the SMG and galaxy samples, and in § 3 we give an overview of the methodology used to measure correlation functions and estimate dark matter (DM) halo masses. In § 4 we present the results, explore the effects of photometric redshift errors, compare with previous measurements, and discuss our results in the context of the physical drivers, lifetimes, and evolutionary paths of SMGs. In § 5 we summarise our conclusions. Throughout this paper we assume a cosmology with and . For direct comparison with other works, we assume km s-1 Mpc-1 (except for comoving distances and DM halo masses, which are explicitly given in terms of km s-1 Mpc). In order to easily compare to estimated halo masses in other recent works on QSO clustering (e.g., Croom et al., 2005; Myers et al., 2006; da Ângela et al., 2008; Ross et al., 2009), we assume a normalisation for the matter power spectrum of . All quoted uncertainties are (68% confidence).
2 SMG and galaxy samples
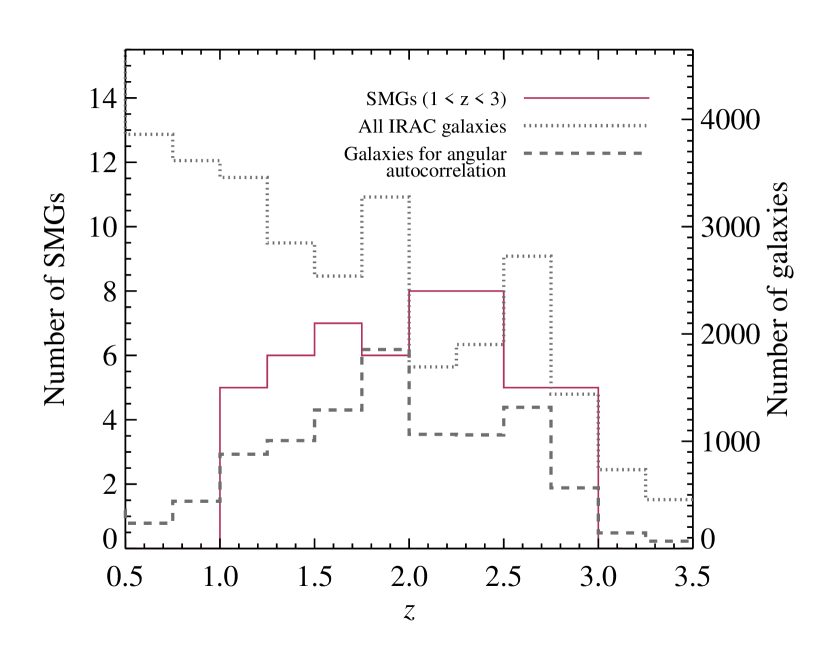
Our SMG sample comes from the survey of the ECDFS using the Large APEX BOlometer CAmera (Siringo et al., 2009, LABOCA) on the Atacama Pathfinder EXperiment (Güsten et al., 2006, APEX) 12-m telescope (the LABOCA ECDFS Submillimetre Survey, or LESS; Weiß et al. 2009). LESS mapped the full 0.35 deg2 ECDFS to a 870-m noise level of mJy beam-1 and detected 126 SMGs at significance (Weiß et al., 2009, equivalent to a false-detection rate of %). Radio and mid-infrared counterparts to LESS SMGs were identified by Biggs et al. (2011) using a maximum-likelihood technique. Spectroscopic and photometric redshifts were obtained for a significant fraction of these counterparts by Wardlow et al. (2011) and we refer the reader to that work for more details. For this study, we restrict our analysis to the 50 SMGs that have secure counterparts at –3 and do not lie close to bright stars (as discussed below). The upper limit of on the sample is included to maximize overlap in redshift space with the galaxy sample, in order to obtain a significant cross-correlation signal, while the lower bound of is included to prevent the SMG sample from being biased toward low redshifts. Of the SMGs in the sample, 22 SMGs (44%) have spectroscopic redshifts (Danielson et al., in preparation) and the remainder have photometric redshifts with a typical precision of (Wardlow et al., 2011). The 870-m flux distribution for the SMGs having secure counterparts (Biggs et al., 2011) is consistent with that for all LESS SMGs Weiß et al. (2009), indicating that the requirement that SMGs have secure counterparts does not strongly bias the fluxes of our SMG sample.
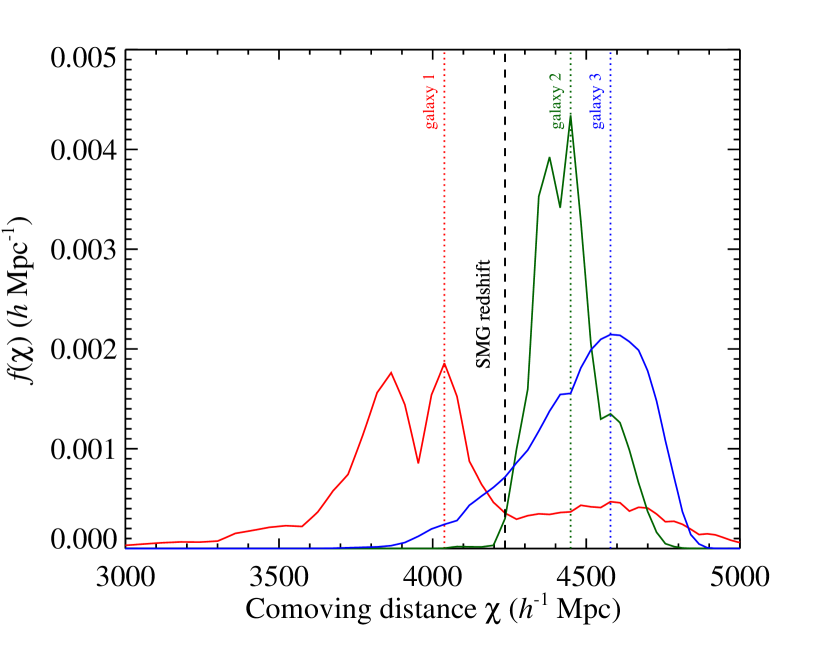
For the cross-correlation analysis, we also require a comparison population in the same field. For this we adopt the 50,000 galaxies detected in the Spitzer IRAC/MUSYC Public Legacy Survey in the Extended CDF-South (Damen et al., 2011). We use an IRAC selected sample to ensure that each galaxy has photometry in a sufficient number of bands, and over a wide enough wavelength range, to allow robust estimates of photometric redshift. Photo-s are calculated using template fits to the optical and IRAC photometry in an identical method to that used for the SMGs (see Wardlow et al. 2011). The fits are performed with hyper-z (Bolzonella, Miralles & Pelló, 2000) and the resulting redshift distribution, compared to that for the SMGs, is shown in Figure 2. The photometric analysis uses chi-squared minimisation, which allows the calculation of confidence intervals for the best-fit redshift. These can be presented as a probability distribution function (PDF) for the redshift, or equivalently, the comoving line-of-sight distance (calculated for our assumed cosmology). We define the PDF for each galaxy as , where . Examples of the PDFs for the galaxies are shown in Figure 3.
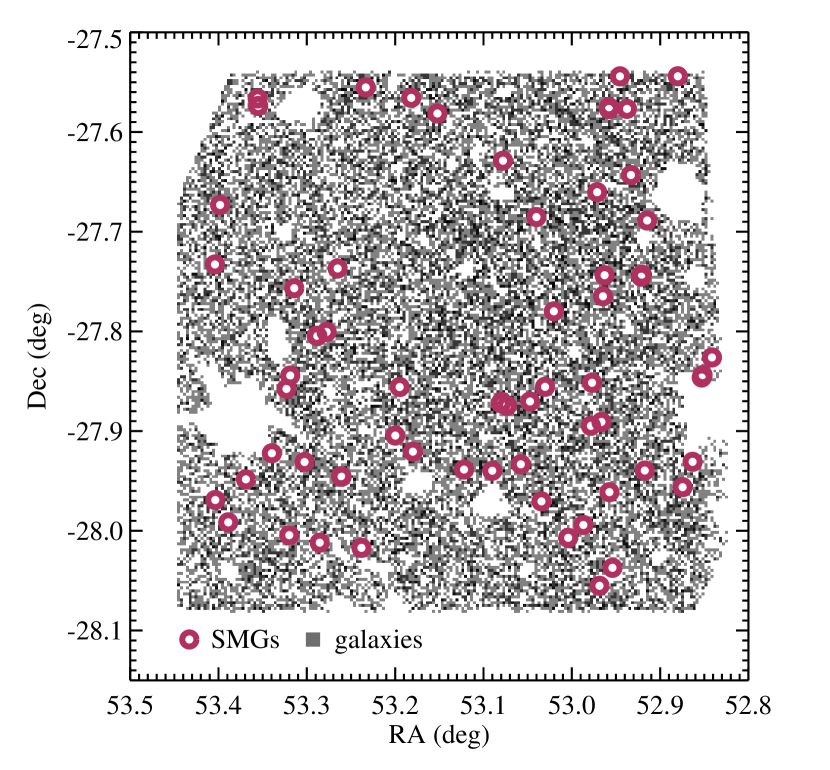
Finally, in order to calculate the correlation functions, we first create random catalogues of “galaxies” at random positions within the actual spatial coverage of our survey. Like many fields, the ECDFS contains several bright stars with large haloes, around which few galaxies are detected. Therefore, we use the background map produced by SExtractor (Bertin & Arnouts, 1996) from the combined IRAC image during the source extraction procedure to create a mask. This mask is applied to the random catalogues, the SMGs and the IRAC galaxies, so that the positions of the random galaxies are unbiased with respect to the SMG and IRAC galaxy samples, and thus the mask does not affect the cross-correlation measurement. As discussed in Biggs et al. (2011) and Wardlow et al. (2011), some of the SMG identifications were performed manually by examining the regions around the SMGs. These additional sources are excluded from the clustering analysis so as not to bias the results. The sky positions of the SMGs and galaxies that are outside the masked regions are shown in Figure 1.
3 Correlation analysis
To measure the spatial clustering of SMGs, we can in principle derive the autocorrelation of the SMGs themselves. However, as we have discussed, current SMG samples are too limited in size and available redshift information to make this feasible. Alternatively, we can measure the cross-correlation of a population with a sample of other sources (for example, less-active galaxies) which populate the same volume (e.g., Gawiser et al., 2001; Adelberger & Steidel, 2005; Blake et al., 2006; Coil et al., 2007; Hickox et al., 2009). The much larger number of galaxies in the ECDFS ( 1000 more than the SMGs in a comparable redshift range) allows far greater statistical accuracy in the measurement of clustering.
To calculate the real-space projected cross-correlation function between SMGs and galaxies we employ a method derived by Myers, White & Ball (2009). This method enables us to take advantage of the full photo- PDF for each galaxy, by weighting pairs of SMGs and galaxies based on the probability of their overlap in redshift space. This method allows us to calculate the SMG-galaxy cross-correlation using the full sample of IRAC galaxies, while the derive the clustering of the galaxies themselves using a smaller sample that is selected to match the overlap in the redshift distributions of the galaxies and SMGs. Our clustering analysis is identical in most respects to the QSO-galaxy cross-correlation study presented in Hickox et al. (2011, hereafter H11). Because the method is somewhat involved, we present only the key details here and refer the reader to H11 for a full discussion.
3.1 Cross-correlation method
The two-point correlation function is defined as the probability above Poisson of finding a galaxy in a volume element at a physical separation from another randomly chosen galaxy, such that
| (1) |
where is the mean space density of the galaxies in the sample. The projected correlation function is defined as the integral of along the line of sight,
| (2) |
where and are the projected comoving separations between galaxies in the directions perpendicular and parallel, respectively, to the mean line of sight from the observer to the two galaxies. By integrating along the line of sight, we eliminate redshift-space distortions owing to the peculiar motions of galaxies, which distort the line-of-sight distances measured from redshifts. has been used to measure correlations in a number of surveys (e.g., Zehavi et al., 2005; Li et al., 2006; Gilli et al., 2007; Coil et al., 2007, 2008; Wake et al., 2008a; Myers, White & Ball, 2009; Hickox et al., 2009; Coil et al., 2009; Gilli et al., 2009; Krumpe, Miyaji & Coil, 2010; Donoso et al., 2010; Hickox et al., 2011; Starikova et al., 2011; Allevato et al., 2011).
In the range of separations Mpc, for galaxies and QSOs is roughly observed to be a power-law,
| (3) |
with typically 1.8 (e.g., Zehavi et al., 2005; Coil et al., 2008, 2007; Ross et al., 2009). For sufficiently large such that we average over all line-of-sight peculiar velocities, can be directly related to (for a power law parameterisation) by
| (4) |
To calculate for the cross-correlation between SMGs and galaxies, we use the method of M09, which accounts for the photometric redshift probability distribution for each galaxy individually. Following M09, the projected cross-correlation function can be calculated using:
| (5) |
where
| (6) |
Here is the projected comoving distance from each SMG, for a given angular separation and radial comoving distance to the SMG of , such that . and are the number of SMG–galaxy and SMG–random pairs in each bin of , and and are the total numbers of SMGs and random galaxies, respectively. is defined as the average value of the radial PDF for each galaxy , in a window of size around the comoving distance to each spectroscopic source . We use Mpc to effectively eliminate redshift space distortions, although the results are insensitive to the details of this choice. We refer the reader to M09 and H11 for a detailed derivation and discussion of these equations. In this calculation as well as in the galaxy autocorrelation, we account for the integral constraint as described in H11. This correction increases the observed clustering amplitude by 15%.
3.2 Galaxy autocorrelation
To estimate DM halo masses for the SMGs, we calculate the relative bias between SMGs and galaxies, from which we derive the absolute bias of the SMGs relative to DM. As discussed below, calculation of absolute bias (and thus halo mass) requires a measurement of the autocorrelation function of the IRAC galaxies. The large size of the galaxy sample enables us to derive the clustering of the galaxies accurately from the angular autocorrelation function alone. Although we expect the photometric redshifts for the IRAC galaxies to be reasonably well-constrained (as discussed in § 2), by using the angular correlation function we minimize any uncertainties relating to individual galaxy photo-s for this part of the analysis. The resulting clustering measured for the galaxies has significantly smaller uncertainties than that for the SMG-galaxy cross-correlation.
We calculate the angular autocorrelation function using the Landy & Szalay (1993) estimator:
| (7) |
where , , and are the number of data-data, data-random, and random-random galaxy pairs, respectively, at a separation , where each term is scaled according to the total numbers of SMGs, galaxies, and randoms.
The galaxy autocorrelation varies with redshift, owing to the evolution of large scale structure, and because the use of a flux-limited sample means we select more luminous galaxies at higher . This will affect the measurements of relative bias between SMGs and galaxies, since the redshift distribution of the SMGs peaks at higher than that for the galaxies and so relatively higher- galaxies dominate the cross-correlation signal. To account for this in our measurement of galaxy autocorrelation, we randomly select galaxies based on the overlap of the PDFs with the SMGs in comoving distance (in the formalism of § 3.1 this is for each galaxy, averaged all SMGs). We select the galaxies so their distribution in redshift is equivalent to the weighted distribution for all galaxies (weighted by ). The redshift distribution of this galaxy sample is shown in Figure 2. We use this smaller galaxy sample to calculate the angular autocorrelation of IRAC galaxies.
3.3 Uncertainties and model fits
We estimate uncertainties on the clustering directly from the data using bootstrap resampling. Following H11, we divide the field into a small number of sub-areas (we choose ), and for each bootstrap sample we randomly draw a total of sub-areas (with replacement), which has been shown to best approximate the intrinsic uncertainties in the clustering amplitude (Norberg et al., 2009). To account for shot noise owing to the relatively small size of the SMG sample, we take the sets of bootstrap sub-areas and randomly draw from them (with replacement) a sample of sources (SMGs or galaxies) equal in size to the parent sample; only pairs including these sources are used in the resulting cross-correlation calculation. We use the bootstrap results to derive the covariance between different bins of , calculating the covariance matrix using Equation 12 of H11.
We fit the observed with two models: a power law and a simple bias model (described in § 3.4). We compute model parameters by minimising (taking into account the covariance matrix as in Equation 13 of H11) and derive 1 errors in each parameter by the range for which . We use the same formalism for computing fits to the angular correlation functions, where We convert and to real-space clustering parameters and following the procedure described in § 4.6 of H11.
3.4 Absolute bias and dark matter halo mass
The masses of the DM haloes in which galaxies and SMGs reside are reflected in their absolute clustering bias relative to the DM distribution. The linear bias is given by the ratio of the autocorrelation function of the galaxies (or SMGs) to that of the DM. We determine following the method outlined in § 4.7 of H11, similar to the approach used previously by a number of studies (e.g., Myers et al., 2006, 2007; Coil et al., 2007, 2008, 2009; Hickox et al., 2009); in what follows we briefly describe this procedure.
We first calculate the two-point autocorrelation of DM as a function of redshift. We use the halofit code of Smith et al. (2003) assuming our standard cosmology, and the slope of the initial fluctuation power spectrum, , to derive the DM power spectrum, and thus its projected correlation function , averaged over the redshift distribution for which the SMGs and galaxies overlap. We then fit the observed of the SMG-galaxy cross-correlation, on scales –15 Mpc, with a model comprising a simple linear scaling of . The best-fit linear scaling of the DM correlation function corresponds to , the product of the linear biases for the SMGs and galaxies, respectively. This simple model produces a goodness-of-fit comparable to that of the power-law model in which the slope is allowed to float.
To determine we therefore need to estimate . We obtain for the galaxies from their angular autocorrelation in a similar manner to that applied to the SMG–galaxy cross-correlation. Again we calculate the autocorrelation for the DM , by integrating the power spectrum from halofit using Equation (A6) of Myers et al. (2007). We fit the observed with a linear scaling of on scales ′–10 (corresponding to 0.3–10 Mpc at ). This linear scaling corresponds to and thus (combined with the cross-correlation measurement) yields the SMG bias . Finally, we convert and to using the prescription of Sheth, Mo & Tormen (2001), as described in H11. This characteristic corresponds to the top-hat virial mass (see e.g., Peebles, 1993, and references therein), in the simplified case in which all objects in a given sample reside in haloes of the same mass. This assumption is justified by the fact (as discussed below in § 4.4) that SMGs have a very small number density compared to the population of similarly-clustered DM haloes, such that it is reasonable that SMGs may occupy haloes in a relatively narrow range in mass. We note that this method differs from some prescriptions in the literature which assume that sources occupy all haloes above some minimum mass; this is particularly relevant for populations with high number densities that could exceed the numbers of available DM haloes over a limited mass range. Given the halo mass function at (e.g., Tinker et al., 2008) the derived minimum mass is typically a factor of 2 lower, for the same clustering amplitude, than the “average” mass quoted here.
4 Results and Discussion
| Power law fitc | Bias model fitd | Halo masse | |||||||
|---|---|---|---|---|---|---|---|---|---|
| Subset | ( Mpc) | () | () | () | |||||
| SMGs | 50 | 2.02 | 0.8 | 0.7 | |||||
| galaxies | 11,241 | 2.13 | 1.8 | 1.8 | |||||
| a Number of objects in the SMG sample and in the galaxy sample used for the galaxy autocorrelation. |
| b Median redshift for the SMG sample and for the galaxy sample used for the galaxy autocorrelation. |
| c Power law model parameters are for the autocorrelation of SMGs (derived from SMG-galaxy projected spatial cross-correlation, along with the galaxy angular autocorrelation) and galaxies (derived from their angular autocorrelation). |
| d Parameters derived from the observed linear fit of the DM model to the observed correlation function, in order to obtain the the absolute bias for the SMGs and galaxies (denoted and , respectively). The linear scaling from the fit corresponds to for the SMG-galaxy cross-correlation, and for the galaxy autocorrelation, which in turn yield and . |
| e DM halo mass derived from the absolute bias, using the method described in § 3.4. |
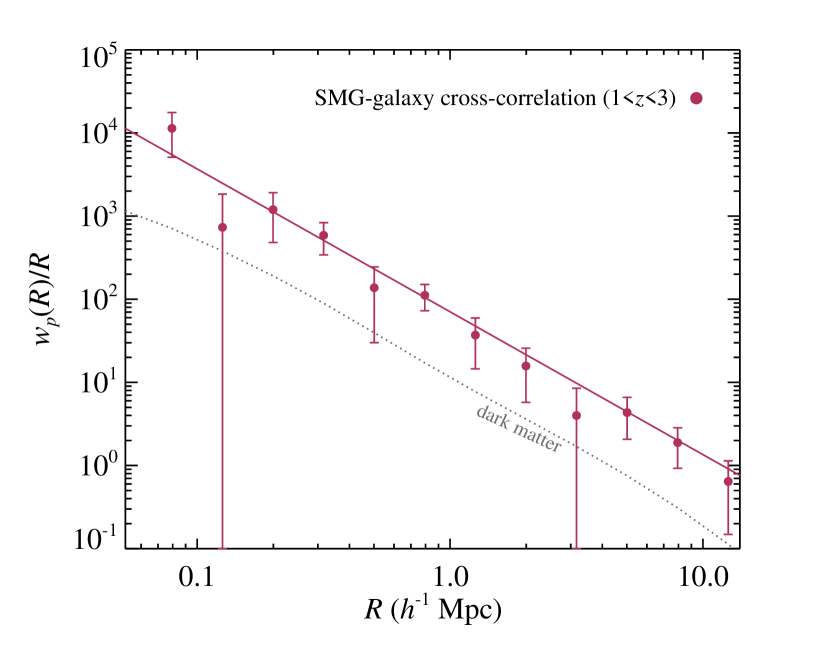
The projected cross-correlation function of the SMG sample with the IRAC galaxies is shown in Figure 4. We plot the best-fit power-law model, and show the correlation function of the DM calculated as in § 3.4, which we fit to the data through a linear scaling. The power-law and linear bias fit parameters are presented in in Table 1. For SMGs the observed real-space projected cross-correlation is well-detected on all scales from 0.1–15 Mpc, and the power-law fits return , similar to many previous correlation function measurements for galaxies (e.g., Zehavi et al., 2005; Coil et al., 2008) and QSOs (e.g., Coil et al., 2007; Ross et al., 2009). The best-fit parameters for the SMG-galaxy cross-correlation are Mpc, . If we fix the value of to 1.8, we obtain Mpc, corresponding to a clustering signal that is significant at the 4 level, the most significant measurement of SMG clustering to date. From the fit of the DM model, we obtain .
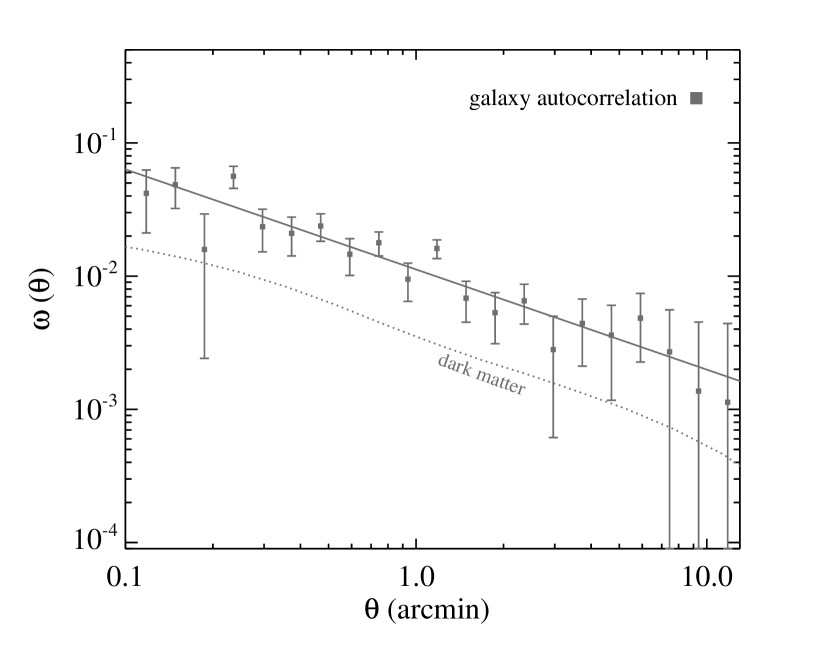
We next compute the autocorrelation of IRAC galaxies for the sample described in § 3.2. The observed is shown in Fig. 5, along with the corresponding power-law fit and scaled correlation function for DM, calculated as discussed in §3.4. Fit parameters are given in Table 1. The power-law model fits well on the chosen scales of 0.3′–10′. The best-fit power law parameters are and , and the best-fit scaled DM model yields or .
This accurate value for yields for the SMGs. Converting this to DM halo mass using the prescription of Sheth, Mo & Tormen (2001) as described in §3.4, we arrive at . The corresponding halo mass for the galaxies is .
For comparison with other studies that attempted to directly measure the autocorrelation function of SMG, it is useful to present the SMG clustering in terms of effective power-law parameters for their autocorrelation. Assuming linear bias, the SMG autocorrelation can be inferred from the cross-correlation by (e.g., Coil et al., 2009). Adopting a fixed for the SMG-galaxy cross-correlation, we thus obtain Mpc for the autocorrelation of the SMGs.
4.1 Effects of SMG photo- errors
One uncertainty in our estimate of for the SMG-galaxy cross-correlation is due to the lack of accurate (that is, spectroscopic) redshifts for roughly half of the SMG population. As described in § 3, in calculating for the cross-correlation, we simply assume that the SMGs lie exactly at the best redshifts from the photo- analysis of Wardlow et al. (2011). Any uncertainties in the SMGs photo-s could therefore affect the resulting clustering measurement. (Note that photo- uncertainties in the galaxies are accounted for implicitly in the correlation analysis, as we utilize the full galaxy photo- PDFs.) To examine the effects of SMG photo- errors, we follow the procedure outlined in § 6.3 of H11. We take advantage of the 44% of SMGs that do have spectroscopic redshifts, and determine how errors in those redshifts affect the observed correlation amplitude.
Specifically, we shift the redshifts of the spectroscopic SMGs by offsets selected from a Gaussian random distribution with dispersion . To ensure that this step does not artificially smear out the redshift distribution beyond the range probed by the galaxies, we require that the random redshifts lie between ; any random redshift that lies outside this range is discarded and a new redshift is selected from the random distribution. Using these new redshifts we recalculate , using the full formalism described in § 3. We perform the calculation 10 times for each of several values of from 0.05 up to 0.3 (corresponding to the range of photo- uncertainties). For each trial we obtain the relative bias by calculating the mean ratio of , on scales 1–10 Mpc, relative to the for the best estimates of redshift. We then average the ten trials at each , and find that at most the photo- errors cause the clustering amplitude to decrease by 10%. The precise magnitude of this effect is unclear given the range of uncertainties in the SMG photo- estimates, but it is is significantly smaller than the statistical uncertainties. We therefore neglect this effect in our final error estimates.
4.2 Comparison with previous results
Here we compare our results to other measurements of SMG clustering in the literature. The observed clustering may depend on the flux limit of the submm sample, as discussed by Williams et al. (2011); measurements of that use SMG samples with similar submm flux limits are shown in Figure 6a. Our measurement is significantly more accurate than previous measurements, owing to the inclusion of redshift information and the improved statistics in the cross-correlation. The uncertainties are comparable to those quoted by Blain et al. (2004) who estimated using counts of close pairs in redshift space from spectroscopic surveys. However, these authors did not account for significant additional sources of error, as discussed by Adelberger (2005). Uncertainties in the redshift selection function for spectroscopic objects, along with the presence of redshift spikes and angular clustering of sources, can strongly impact the number of expected pair counts for an unclustered distribution, and therefore significantly affect the results for the clustering amplitude (Adelberger, 2005). In Figure 6a the large error bars for the Blain et al. (2004) point represent the increase in the uncertainty by 60% due to angular clustering of sources and redshift spikes (as estimated by Adelberger 2005), but does not include the additional uncertainty on the redshift selection function. Nonetheless, our measurement of is consistent with most previous angular clustering estimates as well as the Blain et al. (2004) result, and represents a significant improvement in precision.
As discussed in § 3.4, we convert the observed clustering amplitude to by assuming that SMGs obey simple linear bias relative to the dark matter and reside in haloes of similar mass. Motivated by the presence of a large overdensity of SMGs and powerful star-forming galaxies in one redshift survey field, Chapman et al. (2009) proposed that SMGs obey “complex bias” that depends on large-scale environment and merger history, and that they may reside in somewhat smaller haloes than would be inferred from a linear bias model. Future studies using significantly larger SMG samples may be able to confirm the existence of more complex clustering, but for the present analysis we adopt the simplest scenario and derive assuming linear bias.
The characteristic halo mass we measure for SMGs is similar to that measured for bright far-IR sources (with fluxes mJy at 250 m) detected by the Herschel Space Observatory using an angular clustering analysis (Cooray et al., 2010). While it remains uncertain to what extent bright 250 m sources and 850 m-selected SMGs represent a common population, both samples comprise the luminous end of the star-forming galaxy population detected at those wavelengths and so may represent physically similar systems. In contrast, our observed SMG clustering is significantly stronger than that reported by Amblard et al. (2011) for “submillimetre galaxies” based on a power-spectrum analysis of Herschel 350 m maps, which yields a minimum of . The differences in clustering amplitude compared to SMGs result from the fact that the power spectrum analysis includes unresolved faint sources corresponding to far fainter far-IR luminosities, characteristic of typical star-forming galaxies rather than the powerful, luminous starbursts that are conventionally referred to as SMGs in the literature.

4.3 Progenitors and descendants of SMGs
Our improved clustering measurement allows us to place SMGs in the context of the cosmological history of star formation and growth of DM structures. Because the clustering amplitude of dark matter haloes and their evolution with redshift are directly predicted by simulations and analytic theory, we can use the observed clustering to connect the SMG populations to their descendants and progenitors, estimate lifetimes, and constrain starburst triggering mechanisms.
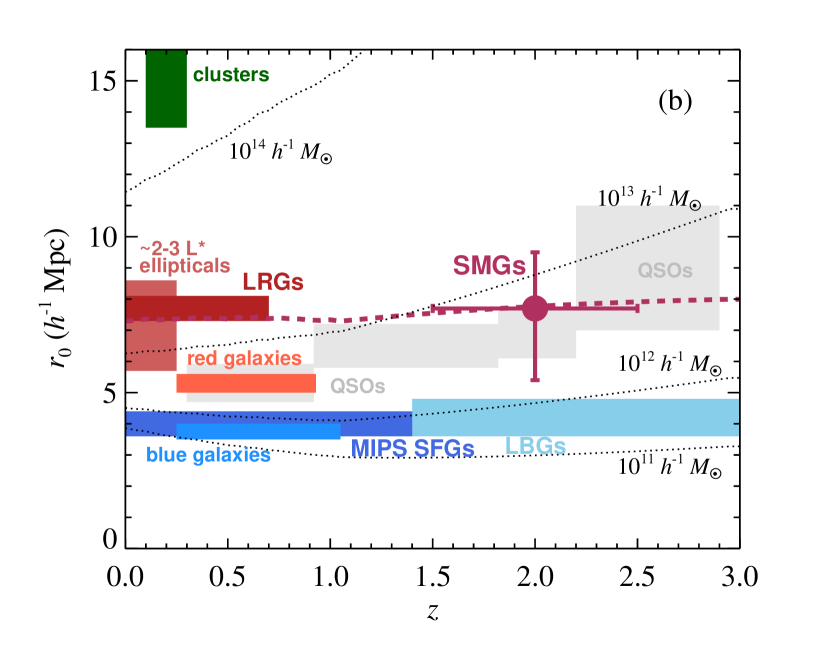
We first compare the clustering amplitude of SMGs with other galaxy populations over a range of redshifts111Myers et al. (2006) and Ross et al. (2009) determine from QSOs assuming a power law correlation function with . To estimate for , we multiply the quoted values by 0.8, appropriate for fits over the range Mpc.. Figure 6b shows the approximate ranges of measurements of for a variety of galaxy and AGN populations. We also show the evolution of with redshift for DM haloes of different masses, determined by fitting a power law with to the DM correlation function output by halofit. Finally, we show the observed for the current SMG sample, along with the expected evolution in for haloes that have the observed for SMGs at , calculated using the median growth rate of haloes as a function of and (Fakhouri, Ma & Boylan-Kolchin, 2010)222Note that here we use the median growth rate of haloes, which for haloes of is 35% lower than the mean growth rate, owing to the long high-mass tail in the halo mass distribution..
Figure 6b shows that while the DM halo mass for the SMGs will increase with time from to , the observed stays essentially constant, meaning that the progenitors and descendants of SMGs will be populations with similar clustering amplitudes. Our measurement of shows that the clustering of SMGs is consistent with optically-selected QSOs (e.g., Croom et al., 2005; Myers et al., 2006; da Ângela et al., 2008; Ross et al., 2009). SMGs are more strongly clustered than the typical star-forming galaxy populations at all redshifts (e.g. Adelberger et al., 2005; Gilli et al., 2007; Hickox et al., 2009; Zehavi et al., 2011), and are clustered similarly or weaker than massive, passive systems (e.g., Quadri et al., 2007, 2008; Wake et al., 2008b; Blanc et al., 2008; Kim et al., 2011; Zehavi et al., 2011). The clustering results indicate that SMGs will likely evolve into the most massive, luminous early type galaxies at low redshift. We note that the descendants of typical SMGs are not likely to reside in massive clusters at , but into moderate- to high-mass groups of a few . Although some SMGs could evolve into massive cluster galaxies, the observed clustering suggests that most will end up in less massive systems.
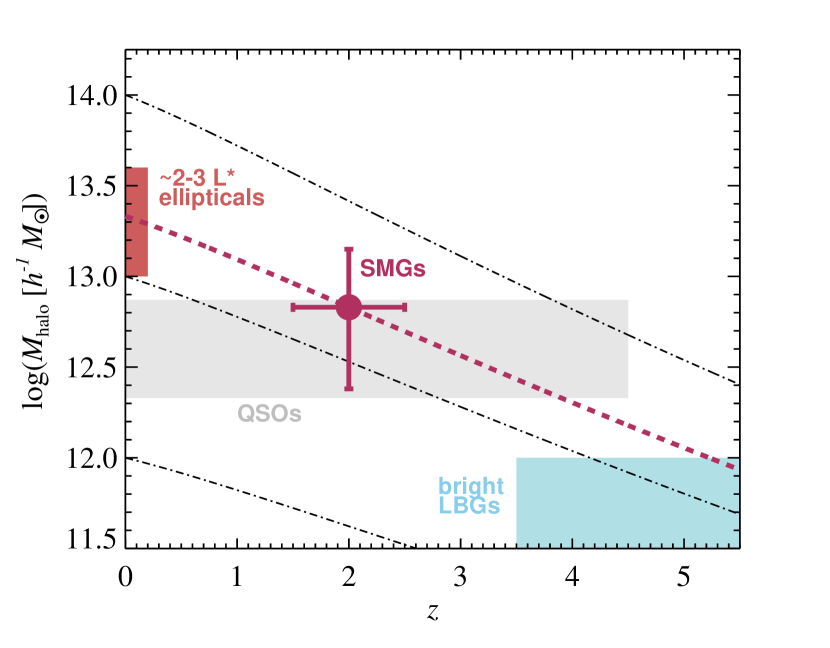
A schematic picture of the evolution of SMGs is shown in Figure 7, which shows evolution in the mass of haloes with redshift as traced by their median growth rate (Fakhouri, Ma & Boylan-Kolchin, 2010). The typical progenitors of SMGs would have at , which corresponds to the host haloes of bright LBGs at those redshifts (e.g., Hamana et al., 2004; Lee et al., 2006). At low redshift, the SMG descendants will have – . Halo occupation distribution fits to galaxy clustering suggest that these haloes host galaxies with luminosities –3 (Zehavi et al., 2011), a population dominated by ellipticals with predominantly slow-rotating kinematics (e.g., Tempel et al., 2011; Cappellari et al., 2011). Assuming typical mass-to-light ratios for massive galaxies (e.g., Baldry, Glazebrook & Driver, 2008), these luminosities correspond to stellar masses –, in close agreement with direct measurements of the relationship between halo mass and central galaxy stellar mass for X-ray selected groups and clusters, for which (Stott et al., 2011).
4.4 SMG lifetime and star formation history
We next estimate the SMG lifetime, making the simple assumption that every dark matter halo of similar mass passes through an SMG phase333If the average halo experiences more or fewer SMG phases in the given time interval, the lifetime of each episode will be correspondingly shorter or longer, respectively., so that
| (8) |
where is the time interval over the redshift range covered by the SMG sample, and and are the space densities of SMGs and DM haloes, respectively.
Using the halo mass function of Tinker et al. (2008), the space density of haloes with is Mpc-3. We adopt a space density of SMGs at of Mpc-3, corresponding to results from previous surveys (e.g., Chapman et al. 2005; Coppin et al. 2006; Schael et al. in preparation). This density is 50% higher than that observed in the LESS field (Wardlow et al., 2011), which has been shown to contain a somewhat smaller density of SMGs compared to other surveys (Weiß et al., 2009).
The ratio of these space densities yields a duty cycle (the fraction of haloes that host an SMG at any given time) of 10%. We assume the SMGs occupy the redshift range , which includes roughly half of the SMGs in the Wardlow et al. (2011) sample and corresponds to Gyr. We thus obtain a lifetime for SMGs of Myr. Clearly, even our improved measurement of SMG clustering yields only a weak constraint on the lifetime, but this is consistent with lifetimes estimated from gas consumption times and star-formation timescales (e.g., Greve et al., 2005; Tacconi et al., 2006; Hainline et al., 2011) and theoretical models of SMG fueling through mergers (e.g., Mihos & Hernquist, 1994; Springel, Di Matteo & Hernquist, 2005; Narayanan et al., 2010).
Constraints on SMG descendants from clustering can also yield insights into their their formation histories. Measurements of the stellar plus molecular gas masses of SMGs from SED fitting and dynamical studies are in the range – (Swinbank et al., 2006; Wardlow et al., 2011; Hainline et al., 2011; Ivison et al., 2011; Michałowski et al., 2011). While these estimates can be uncertain by factors of a few, they are in a similar range to the stellar masses of SMG descendants as indicated by their clustering, as discussed above. This correspondence suggests that if a significant fraction of the molecular gas is converted to stars during the SMG phase, then these galaxies will subsequently experience relatively little growth in mass from to the present. This in turn puts limits on the star formation history. Star-forming galaxies at typically exhibit specific star formation rates of Gyr-1 (Elbaz et al., 2011), at which the SMGs would only need to form stars for 500 Myr in order to double in mass. We may therefore conclude, from the clustering and stellar masses alone, that the SMGs evolve from star-forming to passive states relatively quickly (within a Gyr or so) after the starburst phase, and that the descendants spend most of their remaining time as relatively passive systems. This scenario is consistent with measurements of the stellar populations in 2–3 ellipticals, which have typical ages of 10 Gyr and show little evidence for younger components (e.g., Nelan et al., 2005; Allanson et al., 2009), implying that the vast majority of stars were formed above with little additional star formation at lower redshifts.
The halo masses of SMGs may also provide insight into the processes that prevent their descendants from forming new stars. Star formation can be shut off rapidly at the end of the SMG phase, either by exhaustion of the gas supply, or by energy input from a QSO (e.g., Di Matteo, Springel & Hernquist, 2005; Springel, Di Matteo & Hernquist, 2005). Powerful winds are observed in luminous AGN (e.g., Feruglio et al., 2010; Fischer et al., 2010; Sturm et al., 2011; Greene et al., 2011) and have also been seen in some SMGs (e.g., Alexander et al. 2010, Harrison et al. in preparation), although for the SMGs is unclear whether the winds are driven by the starburst or AGN. Even if the formation of stars is rapidly quenched, over longer timescales the galaxy would be expected to accrete further gas from the surrounding halo, resulting in significant additional star formation (e.g., Bower et al., 2006; Croton et al., 2006). Recent work suggests that energy from accreting supermassive black holes, primarily in the form of radio-bright relativistic jets, can couple to the hot gas in the surrounding halo, producing a feedback cycle that prevents rapid cooling (e.g., Rafferty, McNamara & Nulsen, 2008). This mechanical black hole feedback is an key ingredient of successful models for the passive galaxy population (e.g., Croton et al., 2006; Bower et al., 2006; Bower, McCarthy & Benson, 2008; Somerville et al., 2008). Interestingly, the clustering of radio galaxies at indicates that they reside in haloes of mass (e.g., Wake et al., 2008a; Hickox et al., 2009; Mandelbaum et al., 2009; Donoso et al., 2010; Fine et al., 2011), precisely the environments that will host the descendants of SMGs. Thus the strong observed clustering for SMGs can relate them directly to the radio-bright active galactic nucleus population that may regulate their subsequent star formation.
4.5 Evolutionary links with QSOs and the SMG redshift distribution
Finally, the observed clustering of SMGs provides insights into the processes that trigger and (possibly) shut off their rapid star formation activity. As discussed in § 1, powerful local starbursts (i.e. ULIRGs) are predominantly associated with major mergers and appear to be associated with the fueling of luminous QSOs as part of an evolutionary sequence (e.g., Sanders et al., 1988). However it is unclear if a similar connection exists between SMGs and high- QSOs. One robust prediction of any evolutionary picture is that SMGs and QSOs must display comparable large-scale clustering, since the evolutionary timescales are significantly smaller than those for the growth of DM haloes. At all redshifts, QSOs are found in haloes of similar mass a few (e.g., Croom et al. 2005; Myers et al. 2006; da Ângela et al. 2008; Ross et al. 2009; Figure 6). The characteristic provides a strong constraint on models of QSO fueling by the major mergers of gas-rich galaxies (e.g., Kauffmann & Haehnelt, 2000; Springel, Di Matteo & Hernquist, 2005; Hopkins et al., 2006), secular instabilities (e.g., Mo, Mao & White, 1998; Bower et al., 2006; Genzel et al., 2008) or accretion of recycled cold gas from evolved stars (Ciotti & Ostriker, 2007; Ciotti, Ostriker & Proga, 2010), and is similar to the mass at which galaxy populations transition from star-forming to passive (e.g., Coil et al. 2008; Brown et al. 2008; Conroy & Wechsler 2009; Tinker & Wetzel 2010). The observed clustering of SMGs at from the present work is consistent with that for QSOs, as well as highly active obscured objects including powerful obscured AGN (H11; Allevato et al. 2011) and dust-obscured galaxies (Brodwin et al., 2008). Thus these may indeed represent different phases in the same evolutionary sequence, and energy input from the QSO may be responsible for the rapid quenching of star formation at the end of the SMG phase (e.g., Di Matteo, Springel & Hernquist, 2005; Springel, Di Matteo & Hernquist, 2005) as discussed in § 4.4.
A connection with QSOs may imply that triggering of SMGs is also related (at least indirectly) to the mass of the parent DM halo. In this case, the evolution of large-scale structure may broadly explain why the SMG population peaks at 2.5 and falls at higher and lower redshifts. In the simplest possible such scenario, SMG activity is triggered when the halo reaches a certain mass (see Figure 16 of Hickox et al. 2009 for a schematic illustration of this picture). In a given volume, the number of haloes crossing this mass threshold as a function of redshift is:
| (9) |
where and are the number density (e.g., Tinker et al., 2008) and typical growth rate (Fakhouri, Ma & Boylan-Kolchin, 2010), respectively, of haloes of mass at redshift , is the SMG lifetime, and is the differential comoving volume over the survey area. If an SMG is triggered every time a halo reaches , then the observed number density of SMGs will be proportional to . However, the huge star formation rates of SMGs require a large reservoir of molecular gas (e.g., Greve et al., 2005; Tacconi et al., 2006, 2008), and the molecular gas fraction increases strongly with redshift (e.g., Tacconi et al., 2010; Geach et al., 2011; Lagos et al., 2011). This evolution may explain why the most powerful starbursts at low redshift (ULIRGs) have lower typical SFRs than SMGs (e.g., Le Floc’h et al., 2005; Rodighiero et al., 2010). Therefore it may be reasonable to assume that the number counts of SMGs also depend on , with the simplest possible prescription being:
| (10) |
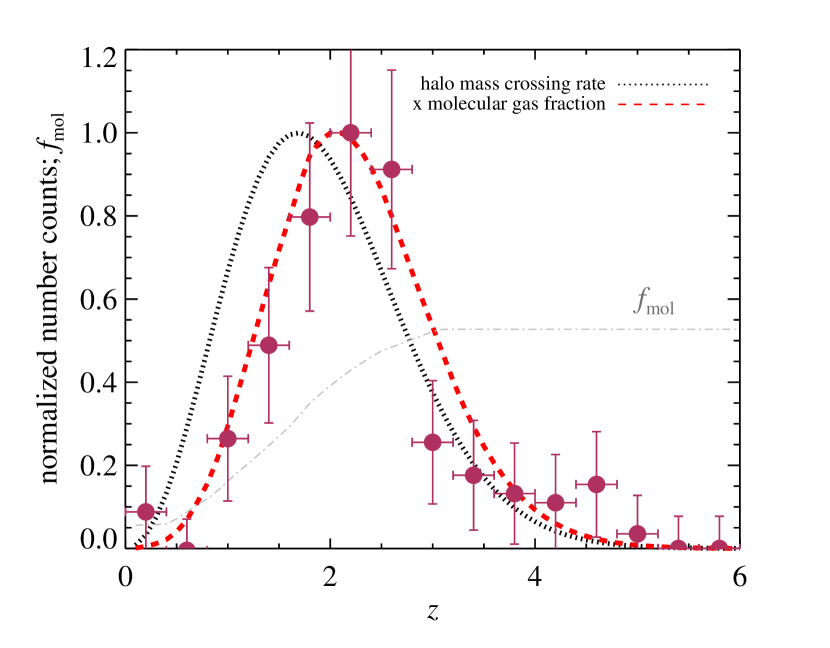
In Figure 8 we show the observed redshift distribution of LESS SMGs (Wardlow et al., 2011), compared to the distributions predicted by Equations (9) and (10), assuming . For simplicity, the evolution in is taken from predictions of the GALFORM model of Lagos et al. (2011), which agrees broadly with observations (see Figure 2 of Geach et al. 2011) and so provides a simple parameterisation of the current empirical limits on the molecular gas fraction in galaxies. It is clear from Figure 8 that there is remarkable correspondence between our extremely simple prescription and the observed redshifts of SMGs. Of course this “model” does not account for a wide range of possible complications and the normalisations of the distributions are arbitrary. However, this exercise clearly demonstrates that if SMGs, like QSOs, are found in haloes of a characteristic mass, then their observed redshift distribution may be explained simply by two effects: the cosmological growth of structure combined with the evolution of the molecular gas fraction. Thus SMGs likely represent a short-lived but universal phase in massive galaxy evolution, associated with the transition between cold gas-rich, star-forming galaxies and passively evolving systems.
5 Conclusions
In this paper we measure the cross-correlation between SMGs and galaxies in the LESS survey of ECDFS, and observe significant clustering at the level. We obtain an autocorrelation length for the SMGs of Mpc, assuming . This clustering amplitude corresponds to a characteristic DM halo mass of . Using this estimate of and the space density of SMGs, we obtain a typical SMG lifetime of Myr.
The observed clustering indicates that the low-redshift descendants of typical SMGs are massive ( 2–3 ) elliptical galaxies at the centers of moderate- to high-mass groups. This prediction is consistent with previous suggestions based on the dynamical (Swinbank et al., 2006) and stellar masses (e.g., Hainline et al., 2011) of SMGs, and is also consistent with observations of local massive ellipticals, which indicate that they formed the bulk of their stars at and have been largely passive since. The clustering of SMGs is very similar to that observed for QSOs at the same redshifts, consistent with evolutionary scenarios in which SMGs and QSOs are triggered by a common mechanism. Assuming that SMGs, like QSOs, are transient phenomena that are observed in haloes of similar mass at all redshifts, the redshift distribution of SMGs can be explained remarkably well by the combination of the cosmological growth of structure and the evolution of the molecular gas fraction in galaxies.
This accurate clustering measurement thus provides a valuable observational constraint on the role of SMGs in the cosmic evolution of galaxies and large-scale structures. We conclude that SMGs likely represent a short-lived but universal phase in massive galaxy evolution that is associated with the rapid growth of black holes as luminous QSOs, and corresponds to the transition between cold gas-rich, star-forming galaxies and passively evolving systems.
Acknowledgments
We thank the anonymous referee for helpful comments. RCH acknowledges support through an STFC Postdoctoral Fellowship and AMS from an STFC Advanced Fellowship. IRS, DMA, ALRD, and JPS acknowledge support from STFC. IRS acknowledges support through a Leverhulme Research Fellowship. DMA is grateful to the Royal Society and the Leverhulme Trust for their generous support. ADM was generously funded by the NASA ADAP program under grant NNX08AJ28G. JSD acknowledges the support of the European Research Council through the award of an Advanced Grant, and the support of the Royal Society via a Wolfson Research Merit award. This study is based on observations made with ESO telescopes at the Paranal and Atacama Observatories under programme numbers: 171.A-3045, 168.A-0485, 082.A-0890 and 183.A-0666.
References
- Adelberger (2005) Adelberger K. L., 2005, ApJ, 621, 574
- Adelberger & Steidel (2005) Adelberger K. L., Steidel C. C., 2005, ApJ, 630, 50
- Adelberger et al. (2005) Adelberger K. L., Steidel C. C., Pettini M., Shapley A. E., Reddy N. A., Erb D. K., 2005, ApJ, 619, 697
- Alexander et al. (2005) Alexander D. M., Bauer F. E., Chapman S. C., Smail I., Blain A. W., Brandt W. N., Ivison R. J., 2005, ApJ, 632, 736
- Alexander et al. (2008) Alexander D. M. et al., 2008, AJ, 135, 1968
- Alexander et al. (2010) Alexander D. M., Swinbank A. M., Smail I., McDermid R., Nesvadba N. P. H., 2010, MNRAS, 402, 2211
- Allanson et al. (2009) Allanson S. P., Hudson M. J., Smith R. J., Lucey J. R., 2009, ApJ, 702, 1275
- Allevato et al. (2011) Allevato V. et al., 2011, ApJ, 736, 99
- Almeida, Baugh & Lacey (2011) Almeida C., Baugh C. M., Lacey C. G., 2011, MNRAS, 417, 2057
- Amblard et al. (2011) Amblard A. et al., 2011, Nature, 470, 510
- Assef et al. (2011) Assef R. J. et al., 2011, ApJ, 728, 56
- Baldry, Glazebrook & Driver (2008) Baldry I. K., Glazebrook K., Driver S. P., 2008, MNRAS, 388, 945
- Bardeen et al. (1986) Bardeen J. M., Bond J. R., Kaiser N., Szalay A. S., 1986, ApJ, 304, 15
- Barger et al. (1998) Barger A. J., Cowie L. L., Sanders D. B., Fulton E., Taniguchi Y., Sato Y., Kawara K., Okuda H., 1998, Nature, 394, 248
- Bennert et al. (2010) Bennert V. N., Treu T., Woo J.-H., Malkan M. A., Le Bris A., Auger M. W., Gallagher S., Blandford R. D., 2010, ApJ, 708, 1507
- Bertin & Arnouts (1996) Bertin E., Arnouts S., 1996, A&AS, 117, 393
- Biggs et al. (2011) Biggs A. D. et al., 2011, MNRAS, 413, 2314
- Blain et al. (2004) Blain A. W., Chapman S. C., Smail I., Ivison R., 2004, ApJ, 611, 725
- Blain et al. (2002) Blain A. W., Smail I., Ivison R. J., Kneib J.-P., Frayer D. T., 2002, Phys. Rep., 369, 111
- Blake et al. (2006) Blake C., Pope A., Scott D., Mobasher B., 2006, MNRAS, 368, 732
- Blanc et al. (2008) Blanc G. A. et al., 2008, ApJ, 681, 1099
- Bolzonella, Miralles & Pelló (2000) Bolzonella M., Miralles J.-M., Pelló R., 2000, A&A, 363, 476
- Borys et al. (2003) Borys C., Chapman S., Halpern M., Scott D., 2003, MNRAS, 344, 385
- Bothwell et al. (2010) Bothwell M. S. et al., 2010, MNRAS, 405, 219
- Bower et al. (2006) Bower R. G., Benson A. J., Malbon R., Helly J. C., Frenk C. S., Baugh C. M., Cole S., Lacey C. G., 2006, MNRAS, 370, 645
- Bower, McCarthy & Benson (2008) Bower R. G., McCarthy I. G., Benson A. J., 2008, MNRAS, 390, 1399
- Brodwin et al. (2008) Brodwin M. et al., 2008, ApJ, 687, L65
- Brown et al. (2008) Brown M. J. I. et al., 2008, ApJ, 682, 937
- Cappellari et al. (2011) Cappellari M. et al., 2011, MNRAS, 413, 813
- Carrera et al. (2011) Carrera F. J., Page M. J., Stevens J. A., Ivison R. J., Dwelly T., Ebrero J., Falocco S., 2011, MNRAS, 413, 2791
- Chapman et al. (2009) Chapman S. C., Blain A., Ibata R., Ivison R. J., Smail I., Morrison G., 2009, ApJ, 691, 560
- Chapman et al. (2003) Chapman S. C., Blain A. W., Ivison R. J., Smail I. R., 2003, Nature, 422, 695
- Chapman et al. (2005) Chapman S. C., Blain A. W., Smail I., Ivison R. J., 2005, ApJ, 622, 772
- Ciotti & Ostriker (2007) Ciotti L., Ostriker J. P., 2007, ApJ, 665, 1038
- Ciotti, Ostriker & Proga (2010) Ciotti L., Ostriker J. P., Proga D., 2010, ApJ, 717, 708
- Coil et al. (2009) Coil A. L. et al., 2009, ApJ, 701, 1484
- Coil et al. (2007) Coil A. L., Hennawi J. F., Newman J. A., Cooper M. C., Davis M., 2007, ApJ, 654, 115
- Coil et al. (2008) Coil A. L. et al., 2008, ApJ, 672, 153
- Conroy & Wechsler (2009) Conroy C., Wechsler R. H., 2009, ApJ, 696, 620
- Cooray et al. (2010) Cooray A. et al., 2010, A&A, 518, L22+
- Coppin et al. (2006) Coppin K. et al., 2006, MNRAS, 372, 1621
- Coppin et al. (2008) Coppin K. E. K. et al., 2008, MNRAS, 389, 45
- Croom et al. (2005) Croom S. M. et al., 2005, MNRAS, 356, 415
- Croom et al. (2004) Croom S. M., Schade D., Boyle B. J., Shanks T., Miller L., Smith R. J., 2004, ApJ, 606, 126
- Croton et al. (2006) Croton D. J. et al., 2006, MNRAS, 365, 11
- da Ângela et al. (2008) da Ângela J. et al., 2008, MNRAS, 383, 565
- Damen et al. (2011) Damen M. et al., 2011, ApJ, 727, 1
- Davé et al. (2010) Davé R., Finlator K., Oppenheimer B. D., Fardal M., Katz N., Kereš D., Weinberg D. H., 2010, MNRAS, 404, 1355
- Decarli et al. (2010) Decarli R., Falomo R., Treves A., Labita M., Kotilainen J. K., Scarpa R., 2010, MNRAS, 402, 2453
- Di Matteo, Springel & Hernquist (2005) Di Matteo T., Springel V., Hernquist L., 2005, Nature, 433, 604
- Donoso et al. (2010) Donoso E., Li C., Kauffmann G., Best P. N., Heckman T. M., 2010, MNRAS, 407, 1078
- Dunlop (2011) Dunlop J. S., 2011, ASP Conf. Series in press (arXiv:1108.5679)
- Eales et al. (1999) Eales S., Lilly S., Gear W., Dunne L., Bond J. R., Hammer F., Le Fèvre O., Crampton D., 1999, ApJ, 515, 518
- Elbaz et al. (2011) Elbaz D. et al., 2011, A&A, 533, A119
- Engel et al. (2010) Engel H. et al., 2010, ApJ, 724, 233
- Estrada, Sefusatti & Frieman (2009) Estrada J., Sefusatti E., Frieman J. A., 2009, ApJ, 692, 265
- Fakhouri, Ma & Boylan-Kolchin (2010) Fakhouri O., Ma C.-P., Boylan-Kolchin M., 2010, MNRAS, 406, 2267
- Feruglio et al. (2010) Feruglio C., Maiolino R., Piconcelli E., Menci N., Aussel H., Lamastra A., Fiore F., 2010, A&A, 518, L155+
- Fine et al. (2010) Fine S., Croom S. M., Bland-Hawthorn J., Pimbblet K. A., Ross N. P., Schneider D. P., Shanks T., 2010, MNRAS, 409, 591
- Fine et al. (2011) Fine S., Shanks T., Nikoloudakis N., Sawangwit U., 2011, MNRAS in press (arXiv:1107.5666)
- Fischer et al. (2010) Fischer J. et al., 2010, A&A, 518, L41
- Gawiser et al. (2001) Gawiser E., Wolfe A. M., Prochaska J. X., Lanzetta K. M., Yahata N., Quirrenbach A., 2001, ApJ, 562, 628
- Geach et al. (2011) Geach J. E., Smail I., Moran S. M., MacArthur L. A., Lagos C. d. P., Edge A. C., 2011, ApJ, 730, L19+
- Gehrels (1986) Gehrels N., 1986, ApJ, 303, 336
- Genzel et al. (2008) Genzel R. et al., 2008, ApJ, 687, 59
- Gilli et al. (2007) Gilli R. et al., 2007, A&A, 475, 83
- Gilli et al. (2009) —, 2009, A&A, 494, 33
- Greene et al. (2011) Greene J. E., Zakamska N. L., Ho L. C., Barth A. J., 2011, ApJ, 732, 9
- Greve et al. (2005) Greve T. R. et al., 2005, MNRAS, 359, 1165
- Güsten et al. (2006) Güsten R., Nyman L. Å., Schilke P., Menten K., Cesarsky C., Booth R., 2006, A&A, 454, L13
- Hainline et al. (2011) Hainline L. J., Blain A. W., Smail I., Alexander D. M., Armus L., Chapman S. C., Ivison R. J., 2011, ApJ, 740, 96
- Hamana et al. (2004) Hamana T., Ouchi M., Shimasaku K., Kayo I., Suto Y., 2004, MNRAS, 347, 813
- Hickox et al. (2009) Hickox R. C. et al., 2009, ApJ, 696, 891
- Hickox et al. (2011) —, 2011, ApJ, 731, 117
- Hopkins et al. (2006) Hopkins P. F., Somerville R. S., Hernquist L., Cox T. J., Robertson B., Li Y., 2006, ApJ, 652, 864
- Hughes et al. (1998) Hughes D. H. et al., 1998, Nature, 394, 241
- Ivison et al. (2011) Ivison R. J., Papadopoulos P. P., Smail I., Greve T. R., Thomson A. P., Xilouris E. M., Chapman S. C., 2011, MNRAS, 412, 1913
- Kaiser (1984) Kaiser N., 1984, ApJ, 284, L9
- Kauffmann & Haehnelt (2000) Kauffmann G., Haehnelt M., 2000, MNRAS, 311, 576
- Kelly et al. (2010) Kelly B. C., Vestergaard M., Fan X., Hopkins P., Hernquist L., Siemiginowska A., 2010, ApJ, 719, 1315
- Kim et al. (2011) Kim J., Edge A. C., Wake D. A., Stott J. P., 2011, MNRAS, 410, 241
- Kollmeier et al. (2006) Kollmeier J. A. et al., 2006, ApJ, 648, 128
- Kotilainen et al. (2009) Kotilainen J. K., Falomo R., Decarli R., Treves A., Uslenghi M., Scarpa R., 2009, ApJ, 703, 1663
- Krumpe, Miyaji & Coil (2010) Krumpe M., Miyaji T., Coil A. L., 2010, ApJ, 713, 558
- Lacey & Cole (1993) Lacey C., Cole S., 1993, MNRAS, 262, 627
- Lagos et al. (2011) Lagos C. D. P., Baugh C. M., Lacey C. G., Benson A. J., Kim H.-S., Power C., 2011, MNRAS, 1776
- Landy & Szalay (1993) Landy S. D., Szalay A. S., 1993, ApJ, 412, 64
- Lauer et al. (2007) Lauer T. R., Tremaine S., Richstone D., Faber S. M., 2007, ApJ, 670, 249
- Le Floc’h et al. (2005) Le Floc’h E. et al., 2005, ApJ, 632, 169
- Lee et al. (2006) Lee K.-S., Giavalisco M., Gnedin O. Y., Somerville R. S., Ferguson H. C., Dickinson M., Ouchi M., 2006, ApJ, 642, 63
- Li et al. (2006) Li C., Kauffmann G., Wang L., White S. D. M., Heckman T. M., Jing Y. P., 2006, MNRAS, 373, 457
- Lindner et al. (2011) Lindner R. R. et al., 2011, ApJ, 737, 83
- Mandelbaum et al. (2009) Mandelbaum R., Li C., Kauffmann G., White S. D. M., 2009, MNRAS, 393, 377
- Marconi et al. (2008) Marconi A., Axon D. J., Maiolino R., Nagao T., Pastorini G., Pietrini P., Robinson A., Torricelli G., 2008, ApJ, 678, 693
- Merloni et al. (2010) Merloni A. et al., 2010, ApJ, 708, 137
- Michałowski et al. (2011) Michałowski M. J., Dunlop J. S., Cirasuolo M., Hjorth J., Hayward C. C., Watson D., 2011, A&A submitted (arXiv:1108.6058)
- Mihos & Hernquist (1994) Mihos J. C., Hernquist L., 1994, ApJ, 431, L9
- Mo, Mao & White (1998) Mo H. J., Mao S., White S. D. M., 1998, MNRAS, 295, 319
- Myers et al. (2007) Myers A. D., Brunner R. J., Nichol R. C., Richards G. T., Schneider D. P., Bahcall N. A., 2007, ApJ, 658, 85
- Myers et al. (2006) Myers A. D. et al., 2006, ApJ, 638, 622
- Myers, White & Ball (2009) Myers A. D., White M., Ball N. M., 2009, MNRAS, 399, 2279
- Narayanan et al. (2010) Narayanan D., Hayward C. C., Cox T. J., Hernquist L., Jonsson P., Younger J. D., Groves B., 2010, MNRAS, 401, 1613
- Nelan et al. (2005) Nelan J. E., Smith R. J., Hudson M. J., Wegner G. A., Lucey J. R., Moore S. A. W., Quinney S. J., Suntzeff N. B., 2005, ApJ, 632, 137
- Netzer & Marziani (2010) Netzer H., Marziani P., 2010, ApJ, 724, 318
- Norberg et al. (2009) Norberg P., Baugh C. M., Gaztañaga E., Croton D. J., 2009, MNRAS, 396, 19
- Overzier et al. (2003) Overzier R. A., Röttgering H. J. A., Rengelink R. B., Wilman R. J., 2003, A&A, 405, 53
- Page et al. (2004) Page M. J., Stevens J. A., Ivison R. J., Carrera F. J., 2004, ApJ, 611, L85
- Peebles (1993) Peebles P. J. E., 1993, Principles of physical cosmology. Princeton University Press, Princeton, NJ
- Peterson et al. (2004) Peterson B. M. et al., 2004, ApJ, 613, 682
- Pope et al. (2008) Pope A. et al., 2008, ApJ, 675, 1171
- Quadri et al. (2007) Quadri R. et al., 2007, ApJ, 654, 138
- Quadri et al. (2008) Quadri R. F., Williams R. J., Lee K., Franx M., van Dokkum P., Brammer G. B., 2008, ApJ, 685, L1
- Rafferty, McNamara & Nulsen (2008) Rafferty D. A., McNamara B. R., Nulsen P. E. J., 2008, ApJ, 687, 899
- Richards et al. (2006) Richards G. T. et al., 2006, AJ, 131, 2766
- Rodighiero et al. (2010) Rodighiero G. et al., 2010, A&A, 515, A8+
- Ross et al. (2009) Ross N. P. et al., 2009, ApJ, 697, 1634
- Sanders et al. (1988) Sanders D. B., Soifer B. T., Elias J. H., Madore B. F., Matthews K., Neugebauer G., Scoville N. Z., 1988, ApJ, 325, 74
- Scott et al. (2002) Scott S. E. et al., 2002, MNRAS, 331, 817
- Shen et al. (2008) Shen Y., Greene J. E., Strauss M. A., Richards G. T., Schneider D. P., 2008, ApJ, 680, 169
- Shen & Kelly (2010) Shen Y., Kelly B. C., 2010, ApJ, 713, 41
- Sheth, Mo & Tormen (2001) Sheth R. K., Mo H. J., Tormen G., 2001, MNRAS, 323, 1
- Siringo et al. (2009) Siringo G. et al., 2009, A&A, 497, 945
- Smail, Ivison & Blain (1997) Smail I., Ivison R. J., Blain A. W., 1997, ApJ, 490, L5
- Smith et al. (2003) Smith R. E. et al., 2003, MNRAS, 341, 1311
- Somerville et al. (2008) Somerville R. S., Hopkins P. F., Cox T. J., Robertson B. E., Hernquist L., 2008, MNRAS, 391, 481
- Springel, Di Matteo & Hernquist (2005) Springel V., Di Matteo T., Hernquist L., 2005, MNRAS, 361, 776
- Starikova et al. (2011) Starikova S. et al., 2011, ApJ, 741, 15
- Stevens et al. (2005) Stevens J. A., Page M. J., Ivison R. J., Carrera F. J., Mittaz J. P. D., Smail I., McHardy I. M., 2005, MNRAS, 360, 610
- Stott et al. (2011) Stott J. P., Kim J., Edge A. C., Wake D. A. a., 2011, MNRAS submitted, 410, 241
- Sturm et al. (2011) Sturm E. et al., 2011, ApJ, 733, L16
- Swinbank et al. (2006) Swinbank A. M., Chapman S. C., Smail I., Lindner C., Borys C., Blain A. W., Ivison R. J., Lewis G. F., 2006, MNRAS, 371, 465
- Tacconi et al. (2010) Tacconi L. J. et al., 2010, Nature, 463, 781
- Tacconi et al. (2008) —, 2008, ApJ, 680, 246
- Tacconi et al. (2006) —, 2006, ApJ, 640, 228
- Tempel et al. (2011) Tempel E., Saar E., Liivamägi L. J., Tamm A., Einasto J., Einasto M., Müller V., 2011, A&A, 529, A53+
- Tinker et al. (2008) Tinker J., Kravtsov A. V., Klypin A., Abazajian K., Warren M., Yepes G., Gottlöber S., Holz D. E., 2008, ApJ, 688, 709
- Tinker & Wetzel (2010) Tinker J. L., Wetzel A. R., 2010, ApJ, 719, 88
- Vestergaard (2002) Vestergaard M., 2002, ApJ, 571, 733
- Vestergaard & Peterson (2006) Vestergaard M., Peterson B. M., 2006, ApJ, 641, 689
- Wake et al. (2008a) Wake D. A., Croom S. M., Sadler E. M., Johnston H. M., 2008a, MNRAS, 391, 1674
- Wake et al. (2008b) Wake D. A. et al., 2008b, MNRAS, 387, 1045
- Wardlow et al. (2011) Wardlow J. L. et al., 2011, MNRAS, 415, 1479
- Webb et al. (2003) Webb T. M. et al., 2003, ApJ, 582, 6
- Weiß et al. (2009) Weiß A. et al., 2009, ApJ, 707, 1201
- Williams et al. (2011) Williams C. C. et al., 2011, ApJ, 733, 92
- Xia et al. (2011) Xia J.-Q., Negrello M., Lapi A., De Zotti G., Danese L., Viel M., 2011, arXiv:1111.4212
- Zehavi et al. (2011) Zehavi I. et al., 2011, ApJ, 736, 59
- Zehavi et al. (2005) —, 2005, ApJ, 630, 1