Unveiling the new generation of stars in NGC 604 with Gemini-NIRI
Abstract
We present a near infrared study focused on the detection and characterization of the youngest stellar component of the NGC 604 giant star-forming region, in the Triangulum galaxy (M 33). By means of color-color diagrams derived from the photometry of JHKs images taken with Gemini-NIRI, we have found 68 candidate massive young stellar objects. The spatial distribution of these sources matches the areas where previous studies suggested that star formation might be taking place, and the high spatial resolution of our deep NIRI imaging allows to pinpoint the star-forming knots. An analysis of the fraction of objects that show infrared excess suggests that the star formation is still active, supporting the presence of a second generation of stars being born, although the evidence for or against sequential star formation does not seem to be conclusive.
1 INTRODUCTION
In this paper we present a near infrared (NIR) photometric study of the NGC 604 star-forming region. This study is focused on the detection and first characterization of the NGC 604 newest generation of stars. NGC 604 is one of the most outstanding giant Hii regions (GHRs) in the Local Group. With a LHα = 2.61039 erg s-1 (Bosch et al., 2002) it is the second most luminous Hii region after 30 Doradus. The observation and study of these two regions play a fundamental role in our understanding of the astrophysical processes associated with massive stars and, in particular, massive star formation and the environments where it takes place. At a distance of 840 kpc, NGC 604 is located far enough to observe global characteristics but still close as to resolve individual objects and small structures (1 4 parsecs). NGC 604 and 30 Dor provide the link between Galactic GHRs, which we are able to study in full detail, and distant GHRs, whose global properties can be traced to cosmological distances. Although they share several common characteristics they also exhibit substantial differences such as their spatial structure and ages distribution.
The ionizing stellar cluster is composed of a population of at least 200 O-type stars (Hunter et al., 1996). Wolf-Rayet (WR) and Of stars, or candidates, were first identified and classified in studies by Conti & Massey (1981), D’Odorico & Rosa (1981), Rosa & D’Odorico (1982), Diaz et al. (1987), and Massey & Johnson (1998). New WR objects were detected by Drissen et al. (1993) by means of Hubble Space Telescope (HST) images, and an accurate classification of known WR stars was made in Drissen et al. (2008). Terlevich et al. (1996) spectroscopically classified two objects, one of them is a transition star from Luminous Blue Variable (LBV) to WR and the other is a red supergiant (RSG) star. There are forty OB stars with accurate spectral classification by Bruhweiler et al. (2003), three of them exhibit Of/WR signatures (wind profile UV emission lines of N v, C iv, and Si iv together with strong emission line of He ii at 1640). Eldridge & Relaño (2011) studied the known evolved stellar population in the region by means of Spectral Energy Distribution (SED) fitting of HST UVIJHK photometry. The authors used the UVI photometric measurements from Hunter et al. (1996) and they performed NIR photometry using archive images from HST-NICMOS (NIC2) in the F110W, F160W, and F205W filters. The latter HST data set, was originally used by Barbá et al. (2009) to perform a photometric study of the region, in which they found five RSG candidates and a dozen candidate massive young stellar objects (MYSOs). However, the selection criteria for IR-excess sources was based on the maximum errors present in the NICMOS photometry. This suggests that a considerable number of sources may yet be detected with deeper images, using photometric errors appropriate for each object.
The age of the main stellar population was estimated by several authors. Hunter et al. (1996) analyzed the color-magnitude diagrams obtained from UVI HST-WFPC2 photometry; the authors fitted isochrones and considered the age constrains imposed by the presence of WR candidate stars. They concluded that the average ages for the stars in NGC 604 range from 3 to 5 Myr, and that the presence of RSG could suggest the existence of an older subpopulation. This older subpopulation was later studied by Eldridge & Relaño (2011) who concluded that the RSGs belong to a formation episode that occurred 12.42.1 Myrs ago. González Delgado & Pérez (2000) analyzed stellar wind resonance lines in ultraviolet spectra taken with the International Ultraviolet Explorer (IUE), together with the nebular emission lines and the higher order terms of the Balmer series and He i lines in absorption (both obtained from optical spectra taken with the 4.2-m William Herschel Telescope). The authors applied three different techniques of evolutionary synthesis and photoionization models (optimized for young star-forming regions) and concluded, consistently by the three methods, that the main ionizing cluster has an age of 3 Myr. The physical and kinematical properties of NGC 604 were studied in Maíz-Apellániz (2000) (and references therein), by means of spectroscopic data obtained with the WHT (in particular, the lines formed in the warm ionized gas) and images from HST-WFPC2. The author concluded that NGC 604 suffered one large starburst 3.0-3.5 Myr ago that formed the main ionizing cluster in the region.
Regarding the stellar population spatial distribution in the region, it is worth mentioning that the objects in NGC 604 are not centrally concentrated (as is the case for 30 Dor) but spread over a large projected area ( 10000 pc2 for cluster A in Hunter et al. 1996), composing a structure called the Scaled OB Association (SOBA) by Maíz-Apellániz et al. (2004).
According to the studies performed by Tenorio-Tagle et al. (2000) and Maíz-Apellániz et al. (2004), the interstellar medium exhibits two areas with different excitation state: a high excitation region surrounded by a low-excitation region, but not with a concentric geometry. These structures also show different kinematic behavior and physical conditions. On the west side (high ionization) there can be identified three cavities, which seem to be bubbles bursting into the M 33 halo (in our direction). There is a boundary, often cited as ‘the ridge’, which extends along the north-south direction defining a clear east-west division within nebulae. The east side (low ionization) exhibits a quieter kinematic behavior. This dichotomy is also observed in the X-ray emission (Tüllmann et al., 2008).
Detailed studies on the dynamics were also performed by Yang et al. (1996), who found that the width of the integrated velocity profile needs the contributions of virial motion, thermal broadening, stellar winds and SNRs. Medina Tanco et al. (1997) performed a study on the dynamics of the region by means of the H emission and they concluded that a few tens of WR stars would be enough to feed the necessary kinetic energy. They also stated that the turbulence is relatively young, giving another element in favor of recent processes of stellar formation taking place a few million years ago. Analyzing the velocity dispersion versus intensity diagram over the whole region, Munoz-Tunon et al. (1996) found that most velocity dispersion values measured in NGC 604 are supersonic. The authors also used the same diagram as a tool to identify the zones corresponding to structures such as shells, loops or bubbles which are generated by the interaction of the massive stars’ winds with the interstellar medium.
The NGC 604 molecular component was widely studied by Viallefond et al. (1992), Wilson & Scoville (1992), Engargiola et al. (2003), Rosolowsky et al. (2003), and Tosaki et al. (2007). In the latter study the authors proposed a sequential star formation scenario triggered by the expansion of the Hii region. This idea was reinforced in a recent study with higher spatial resolution in CO, HCN, and 89-GHz continuum emissions by Miura et al. (2010).
In this study we present new observations of NGC 604 acquired using the Gemini-North telescope with NIRI in the J, H, and Kshort (Ks hereafter) bands. The high quality data obtained allowed us to perform a photometric study to identify and characterize candidate MYSOs in the ionizing cluster, confirming the candidates found by Barbá et al. (2009) and increasing the sample presented in that study by a factor of five. Our data and analysis methods are described in Section 2. Results and implications are discussed in Section 3.
2 DATA REDUCTION AND ANALYSIS METHODS
2.1 Observations
The observations were made using the Gemini-North telescope with NIRI (Near Infrared Imaging and Spectrometer) during the nights of September 08 and 11, 2005 (Proposal GN-2005B-Q-3). NIRI was used in the imaging mode with the f/6 camera. This configuration yields a field of view of 120120′′ with a resulting plate scale of 0.117 arcsec pixel-1. The images were taken under excellent seeing conditions, averaging 0.′′35 FWHM measured in the J, H, and Ks images. Table 1 lists the broad-band filters used, together with their central wavelengths and wavelength coverage in Columns 2 and 3, respectively; the exposure time for each individual image is given in Column 4, and in Columns 5, 6, and 7 we have included details from the photometry that will be discussed in the following sections.
| Filter | (m) | Coverage (m) | Exp. (s) | Mean mag_err | Max. mag | Min. mag |
|---|---|---|---|---|---|---|
| (1) | (2) | (3) | (4) | (5) | (6) | (7) |
| J | 1.25 | 0.97-1.07 | 120 | 0.06 | 23.0 | 16.0 |
| H | 1.65 | 1.49-1.78 | 60 | 0.07 | 22.5 | 15.5 |
| Ks | 2.15 | 1.99-2.30 | 40 | 0.10 | 22.0 | 15.5 |
The observing sequences were made following
a square pattern with offsets of about 10′′ every two consecutive field
images, interspersed with a sequence of sky images, also taken with dithering
offsets. The dithering sequence allows the removal of bad
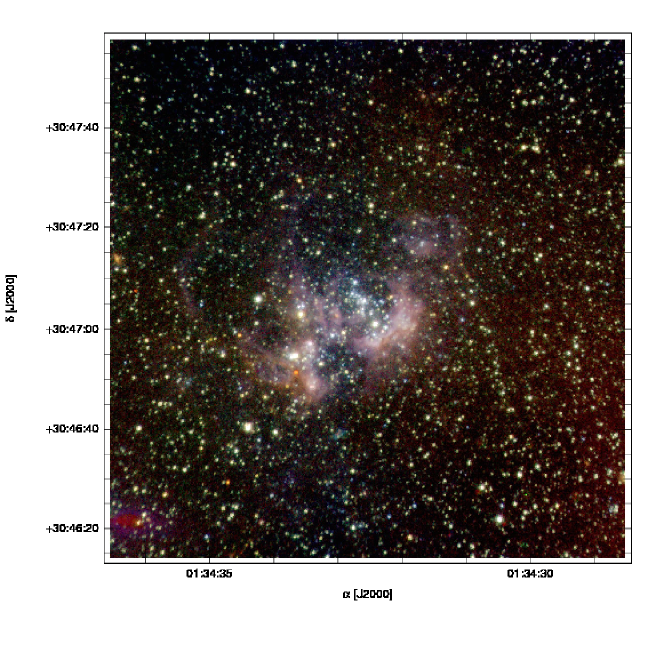
pixels and other detector artifacts, although the effective area that gets fully exposed is smaller (107107′′). Figure 1 shows the color RGB image of NGC 604 composed
from our final broad-band images: J (blue), H (green), and Ks (red).
2.2 Data Reduction
Most of the NIRI images exhibit a vertical striping pattern which originate
in the array’s electronics. Although its spatial profile is well known (eight
columns wide), its intensity varies from one exposure to another, even within
an individual image, and it differs between the four image quadrants since each
quadrant in the NIRI array is read independently. The routine nirinoise.py (kindly provided by Gemini Staff)
was applied to each image (field images, sky images, flats on/off images, and
darks) in order to remove this pattern. Although it was not possible to
completely remove it in all individual images, the residual pattern, when it was present, was only of a few ADU and being a small spatial scale pattern, it was corrected in the final image, obtained by averaging the dithered images.
The second correction was performed to account for the NIRI detector
non-linearity. This correction must be applied to all images with count rates
greater than 20 ADU s-1. The routine,
also supplied by Gemini Staff,
was applied to all J, H, and Ks field images.
After these two initial image corrections the reduction procedure that follows was
pursued with IRAF111IRAF is distributed by the National Optical Astronomy Observatories,
which are operated by the Association of Universities for Research
in Astronomy, Inc., under cooperative agreement with the National
Science Foundation. routines in the gemini.niri package. Following the instructions in the NIRI web pages, the images were sky-subtracted and
flattened. Short dark exposures were used to generate a mask to identify bad
pixels. Special care was taken when combining the individual images to obtain
the final image with the imcoadd task. Due to possible confusion generated
by crowding and the highly variable background, the imcoadd align method was set in ‘user’ and the script
was called interactively twice: a first call to mark the reference objects in
each image and generate the transformation map, and a second call to generate all
the transformed images as well as to derive the average image,
with bad pixels and flagged cosmic-ray hits omitted. The average image
was the final image used to perform the photometry.
Some images exhibited a spurious, large scale,
light pattern, which in most cases increased the counts by no more than
0.5-1.0% above the averaged background counts in a extended area of the field.
This effect seems to appear, every time, after the offset to observe the sky
region. Being a low spatial frequency pattern it is not expected to affect our
point-source photometry. Nevertheless, we examined its effect by generating two
final images for each filter, one including all the images and a second one including only those images without any trace of the illumination pattern (reducing
the number of useful images by about 50%). We performed photometric analysis
in both images and compared the results. As expected, the measured magnitudes
were the same for both images, confirming that they were not affected by the
light pattern, but the stacked image made with fewer individual images turned
out to be less deep and the measured magnitudes presented more scatter. We
therefore decided to pursue the study using the photometry derived from the
coadded image that included the images with the light pattern, discarding only a
few in which the pattern was more evident.
2.3 Photometry
2.3.1 PSF Fitting
As evident in Figure 1, the NGC 604 field is highly crowded and the
background nebular emission exhibits strong variations on small spatial scales.
These conditions drove us to pursue Point Spread Function (PSF) photometry.
The objects for PSF fitting were selected using the daofind IRAF
task from an image created by adding our J and Ks images. These images were aligned using the geomap and geotran IRAF tasks to derive and apply, respectively, the geometrical transformation (only linear shifts). By performing the object finding in the J+Ks image we guaranteed the detection of stars in both extremes of the total wavelength range covered by the NIR
filters. A threshold of five sky sigmas over the background value
was set as the detection limit.
Stellar magnitudes were obtained by PSF fitting over the selected stars using the allstar routine from DAOPHOT software (Stetson, 1987) in IRAF. The
analytic PSF model that gave the best fit was a Moffat25 function (FWHM 3.0
pixels 0.′′35) with parameters that could vary quadratically with position in the
image. Although a standard procedure, PSF construction and fitting in crowded
fields involves an iterative and careful process. As there are
no isolated stars available to be chosen as bona fide PSF stars to construct the
PSF model, it requires several sequences of PSF modeling and neighbor star
subtraction with an analytic PSF model of higher order each time, before the
final model can be obtained. Pixels used to determine the stellar profile were those with less
than 12000 ADU as this is the highest value for
which the linearity correction is expected to be reliable. The few stars that exceed this
limit in their central pixels had their magnitudes determined from
fits using the wings of their profiles.
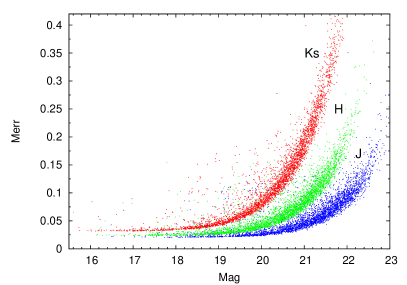
The photometric uncertainties include the internal photometric error for each source as determined by DAOPHOT (considering photon counts statistics, NIRI noise and gain characteristics and PSF-fitting errors), to which the aperture correction uncertainty and the error associated with the transformation to the Mauna Kea Observatory (MKO) standard system were quadratically added.
Aperture correction was calculated for each filter by performing aperture photometry (with the aperture used to measure the standard stars) over an average of 30 PSF stars with their neighbors previously subtracted. The error in the aperture correction is 0.02 mag. for the three filters. The uncertainties associated with the transformation of instrumental magnitudes to the MKO standard system are 0.08, 0.01, and 0.02 mag. for J, H, and Ks, respectively.
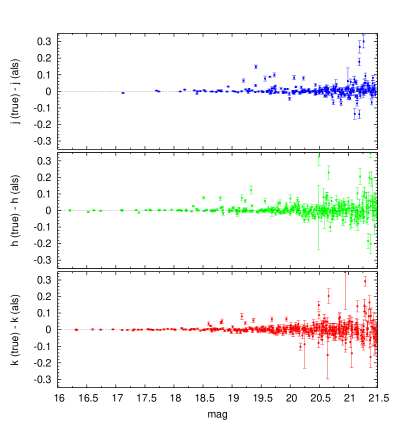
In Table 1 we have listed, for each filter, the mean photometric uncertainties in Column 5, the photometric limiting magnitudes for an error smaller than 0.4 mag in Column 6, and in Column 7 the magnitude at the saturation limit. Figure 2 shows the error distribution with magnitude for each filter.
2.3.2 Transformation to the Standard System
The instrumental magnitudes were transformed to the MKO infrared photometric system, by means of aperture photometry performed on the standard stars.
As the observed standard stars were limited to only one standard star per filter used in each observing night, we looked for a way to check the zero points of our magnitudes. A direct comparison with our photometry and 2MASS photometry was not possible
as the magnitude limits of 2MASS at SNR = 10 are 15.8, 15.1, and 14.3 for J, H,
and Ks filters, respectively; which correspond to the magnitudes of stars that saturate in our images (see Table 1).
Nevertheless, a comparison was possible by
means of a study published by Cioni et al. (2008). The authors performed
wide-field JHKs observations of M 33 using WFCAM at UKIRT, referring the
astrometric and photometric calibration to the 2MASS point source catalog.
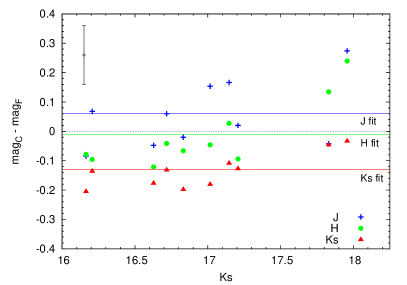
Fortunately, there are 10 sources in common with our photometry which allows us
to compare their magnitudes with ours. The results of the comparisons are
shown in Figure 3 for the J, H, and Ks filters where the presence of a small magnitude offset between both sets can be seen.
As no additional trend stood out as evident, and since the source number is small, we have limited our comparison to an evaluation of zero-point offsets. Performing a simple average to estimate these offsets we found them to be 0.06, -0.01, and -0.13 mag for J, H, and Ks, respectively. Although individually small, they add up to one tenth of a magnitude in the (H-Ks) color. These offsets were added to the zero-points calculated for our photometry. The errors on these zero-point offsets to the magnitudes of the MKO system are smaller than the photometric uncertainties.
2.3.3 Central and Field Regions. Photometric Uncertainties
An analysis to examine the internal photometric uncertainties calculated by allstar-DAOPHOT routine was made for each filter
by means of adding artificial stars to the science images. Our NGC 604
field was divided in two regions: the ‘central region’ and the ‘field region’.
As the main cluster of NGC 604 does not stand out as an evident increase in the stellar density, the central region limit was set
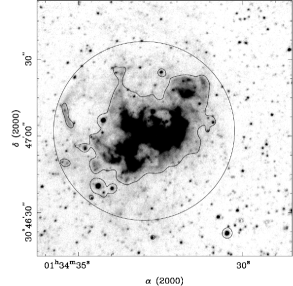
using a NIRI image obtained with the Pa narrow-band filter (details on narrow-band images and analysis will be included in a forthcoming paper). This is illustrated in
Figure 4 where the smoothed Pa contours at 5
used to define the central region limit are shown. The central region, enclosed by a 150 pc radius circle, is centered at and and its area (of
68000 pc2) encompasses the NGC 604 SOBA. The region outside the circle, the field region, has a surface of 118000 pc2 and was used to account for field star contamination.
A histogram of magnitude distribution (0.5 mag bin width)
was generated separately for each region. A new image was created by
adding artificial stars to each region. The number of added objects represented 10%
of the stars at each magnitude interval. The artificial star
magnitudes were measured following the same procedure employed for the natural
stars. By comparing their measured magnitudes with their ‘true’ magnitudes, we found that the differences are in the
range of the magnitude uncertainties calculated by the allstar routine. In Figure
5 we have plotted the
difference between the ‘true’ and measured magnitudes for the artificial
stars for the J, H, and Ks filters in the top, middle, and bottom panels, respectively. The bars represent the magnitude error calculated by allstar for
the measured magnitudes.
2.3.4 Limiting Magnitudes
We have also used the magnitude histograms of the NGC 604 central region to define the faintest magnitude reachable for each band. The magnitude limit was set equal to the magnitude of the first bin brighter than the peak of the histogram plot (e.g., see Figure 6). Following this criterion, the magnitude limits are 21.5 mag for J band and 20.5 mag for H and Ks bands. Figure 6 shows the histogram obtained for the Ks band where it can be observed that 20.5 mag bin comes right before the bin with the highest counts (21.0 mag). With these magnitude limits our sample is reduced to 1649 objects. However, the photometric uncertainties of the remaining objects are reduced to 0.04, 0.04, and 0.07 mag. for J, H, and Ks, respectively (nearly half of the mean magnitude uncertainties for the whole sample, see Table 1).

2.4 Astrometry
The astrometry was made in two steps, first an alignment in ‘image coordinates’ of the final J, H, and Ks images; then a subsequent transformation from image coordinate system to World Coordinate System (WCS). The transformation from ‘image coordinates’ to (,) celestial equatorial coordinates was performed using ccmap and ccsetwcs IRAF tasks, which computed the plate solution and created the WCS image, respectively. The astrometry was derived using 45 isolated stars, common to our images and version 2.3.2 of the Guide Star Catalog (GSC). Special care was taken to select well separated stars in our NIRI field. The reference frame of the GSC catalog is the International Celestial Reference Frame and Equinox J2000.0 (Lasker et al., 2008). The GCS 2.3.2 typical errors are 0.′′3 and the transformation RMS are 0.′′35 and 0.′′25 for and , respectively.
3 RESULTS AND DISCUSSION
The magnitudes obtained in the individual filters were matched in a unique list
containing 3627 objects in the field in which all three J, H, and Ks
magnitudes were measured. Table 2 is an excerpt of the photometry table available in its entirety as machine-readable table in the electronic edition of the
Astronomical Journal. Column 1 contains the internal object id; Columns 2 and 3 the Celestial Equatorial coordinates (J2000.0) in degrees; Columns 4 and 5 the J magnitude and its uncertainty, respectively; Columns 6 and 7 the H magnitude and its uncertainty, respectively; Columns 8 and 9 the Ks magnitude and its uncertainty, respectively; and Columns 10 and 11 list the (J-H) and (H-Ks) colors, respectively.
The total effective area - taking into account the dithering pattern - covered by our
photometry is of 107107′′ ( 430430 pc2 at the distance of M 33).
| Id | (J2000.0) | (J2000.0) | J | H | Ks | (J-H) | (H-Ks) | |||
|---|---|---|---|---|---|---|---|---|---|---|
| (1) | (2) | (3) | (4) | (5) | (6) | (7) | (8) | (9) | (10) | (11) |
| 2498 | 23.6167607 | 30.7957712 | 21.79 | 0.08 | 21.18 | 0.09 | 21.42 | 0.24 | 0.61 | -0.24 |
| 4171 | 23.6168631 | 30.7972395 | 21.29 | 0.08 | 20.49 | 0.06 | 20.41 | 0.12 | 0.80 | 0.08 |
| 3628 | 23.6169750 | 30.7976702 | 21.22 | 0.07 | 20.75 | 0.08 | 20.72 | 0.16 | 0.47 | 0.03 |
| 2387 | 23.6170550 | 30.7946332 | 22.55 | 0.14 | 21.81 | 0.17 | 21.92 | 0.38 | 0.74 | -0.11 |
| 2062 | 23.6171246 | 30.7913550 | 21.58 | 0.08 | 21.15 | 0.12 | 21.03 | 0.18 | 0.43 | 0.12 |
3.1 Background/Foreground Stars
As mentioned in Section 1, fortunately, NGC 604 is situated in a privileged
location from an observational point of view: in a direction out of the Galactic
plane and in the outer part of M 33 (a galaxy which is orientated almost face-on); hence,
it is expected that in the NGC 604 field there is little contamination with
foreground and background stars. We have estimated the contamination by Galactic objects in our field using the model of Robin et al. (2003)222By the electronic interface at http://model.obs-besancon.fr/, which yields only six objects, most of
them F dwarf stars belonging to the thick disk.
Our main concern for the study presented in
this paper is the contamination by field objects lie in the area of the
color-color (CC) and color-magnitude (CM) diagrams occupied by MYSOs
candidates, resulting in possible misidentifications and an overestimation of
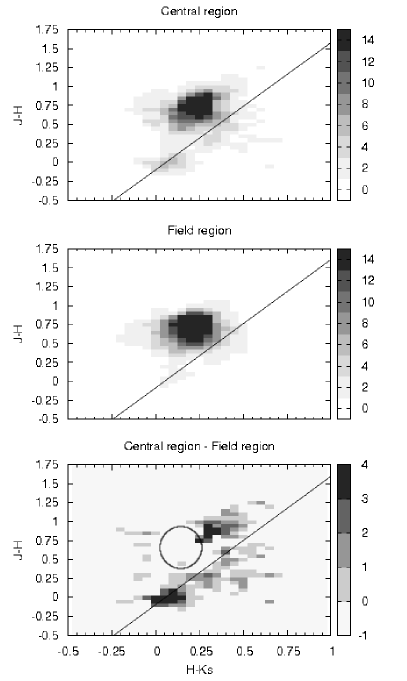
their number. To examine this effect we generated density plots (two
dimensional histograms) for the CC diagram of the NGC 604 central region and the
field region surrounding it, as defined in the previous Section.
Figure 7 exhibits the CC density maps for the central region
(top panel), the field region scaled to match the central region area (middle panel), and the bin to bin subtraction resulting of the central region minus the field region (bottom panel). Each bin in these diagrams is a 0.050.05 mag. square, in (J-H) and (H-). There are three visible differences between the object distribution in the CC
density maps from both regions, which become even more evident in the bottom panel: (a)
the star population around (J-H)0.0 and (H-)0.0, which is present in the diagram of the central region but missing in the field region. These objects are located in the CC area belonging to early-type main-sequence (around O6-B2 V) and early-type giants
stars, hence they are expected to be part of the NGC 604 population and do not suffer
noticeable reddening; (b) the number of objects that lie to the right of the reddening line for a O6-O8 V star, they constitute the IR-excess objects and are the main interest
for this study. It is clear that the IR-excess objects cover a larger area in the CC diagram of
the NGC 604 central region than for the field region, and the field shows almost no objects
redder than (H-)0.5; (c) the location of the red giant stars in the observed CC diagram, grouped around (J-H)1.0 and (H-)0.25, changes due to the reddening introduced by NGC 604. This reflects in a relative over-density of reddened RGs when looking through NGC 604 and a relative absence of their unreddened counterparts, seen as negative counts in the circled region marked in the bottom panel.
3.2 Objects with IR Excess: IR excess Fractions and Spatial Distribution
IR excess in MYSOs arise from heated dust and gas located in the very young objects’
surroundings, being a circumstellar phenomena rather than interstellar. This
material can be part of the original cloud material that was either left behind
after the protostellar collapse and not blown yet by the new born star or, it
can be material which forms part of the accretion disk of the forming object
still in the contraction process (Stahler & Palla, 2004). Therefore, the objects’ location in the CC diagram allows us to detect protostellar object candidates, as sources that lie on the right side of the reddening line for a O6O8 V star, exhibiting an IR excess.
Figures 8 and 9 show the CC and CM diagrams obtained with our
photometry for the NGC 604 central region. Those diagrams include 693 selected objects within the upper magnitude limits at J = 21.5, H = 20.5, and Ks = 20.5 mag.
As there is an intrinsic (and variable) uncertainty in the
determination of NIR colors for each object, we have considered as ‘objects with IR excess’ those sources whose distance to the reddening line is larger than their uncertainties (at one sigma) in the (H-Ks) color, marked with filled circles and squares in Figures 8 and 9. In particular, the square symbols in both plots denote objects that exhibit ‘extreme IR excess’, that is, their IR excess is larger than their errors by a factor of at least three.
In the CM diagram we have also included, as a reference, the location of two well known
Galactic objects: S106 IRS4, a Class 0 protostar (Furuya et al., 1999) and NGC 2024 IRS2, originally
identified as an Ultra-Compact Hii region. Although Bik et al. (2003) suggest that it might be a young massive star with a dusty disk, this type of object is still linked to very recent massive star formation.
With the criterion previously mentioned, we have selected a total of 88 objects that exhibit IR excess, 32 of them showing extreme IR excess. In Table 3 there are listed the 88 objects with IR excess, where Column 1 is the internal object id (as in Table 2), Columns 2 and 3 the Celestial Equatorial coordinates (J2000.0) in degrees, and Columns 10 and 11 list the (J-H) and (H-Ks) colors, respectively. This table is available in its entirety as machine-readable table, in the electronic edition of the Astronomical Journal.
| Id | (J2000.0) | (J2000.0) | (J-H) | (H-Ks) |
|---|---|---|---|---|
| (1) | (2) | (3) | (4) | (5) |
| 4234 | 23.6323556 | 30.7843609 | 0.41 | 0.72 |
| 4063 | 23.6325544 | 30.7835649 | 0.45 | 0.46 |
| 3302 | 23.6326740 | 30.7833725 | 0.51 | 0.96 |
| 4361 | 23.6328734 | 30.7839901 | -0.05 | 0.37 |
| 4048 | 23.6329417 | 30.7830922 | 0.47 | 0.52 |
Besides MYSOs, in GHRs we can also find massive evolved stars like WR stars, B[e] supergiants (sgB[e]) and Of stars. As was commented in Section 1, the evolved stellar population within NGC 604 has already been widely studied. Particularly, the WR content of NGC 604 was studied by Drissen et al. (1993) with the HST/WFPC. In a complete survey, the authors identified 14 Of/WR candidates (up to MB=22.88). From these 14 Of/WR candidates we detected 11 objects, since in our NIRI images objects WR4a - WR4b and WR2a - WR2b could not be resolved, and WR11 is under the detection limit (indeed it is also optically faint). From the 11 WR detected in our photometry, 7 show IR excess greater than three times their uncertainty in (H-Ks) color, whereas the remaining four do not exhibit IR excess at all. Therefore, from the 88 objects which exhibit IR excess, we have subtracted the 7 known WR stars.
Regarding possible contamination with evolved B[e] stars, it is worth reviewing that the known objects with the B[e] phenomena are not abundant and most of the B[e] stars are relatively faint (Miroshnichenko, 2006). From the five classes of B[e] stars (Lamers et al., 1998), we only expect to detect the most luminous objects (sgB[e]) at the distance of M 33. Considering that the list of all known Galactic sgB[e] candidates in the study by Kraus (2009) includes only 14 objects, we can infer that it is very unlikely to find a significant number of sgB[e] in NGC 604.
Summarizing, the NGC 604 central region contains 693 objects with 81 showing IR excess (with the known WR subtracted). There are 566 objects in the field region (after the scaling correction applied to match both surveyed areas), with 13 showing IR excess. Therefore, we can estimate a total number of 127 objects belonging to NGC 604 in our photometry. From the 81 objects with IR excess in the region centered at NGC 604, we subtracted 13 objects to account the background/foreground contamination, which yields 68 objects with IR excess in the NGC 604 central region, and a fraction of objects with JHK IR excess, , of 68/127 ( 54%).
As was previously mentioned in the Introduction, Barbá et al. (2009) found a dozen candidate MYSOs by means of HST-NICMOS NIR data. In the present study we were able to detect ten of these objects and increase the sample of MYSOs candidates by a factor of five. Before performing an object to object comparison it is important to bear in mind that the category of ‘objects with IR excess’ was assigned with different numerical criteria in the NIRI and NICMOS studies. While in the present study each object’s IR excess was determined taking into account its uncertainty in the (H-Ks) color, in the NICMOS study a fixed limit of 0.4 mag was set as the minimum shift for all objects to flag them as showing an IR excess. This limit was chosen considering the maximum uncertainties in the photometry of the objects included in NICMOS sample. Our comparison therefore focused on the 2 out of 12 objects selected as candidate MYSOs in the NICMOS study that are not among the objects with IR excess in Table 3. The object located at =23.64050, = +30.78196 lies extremely close to a RSG candidate which saturates in the NIRI images and might have hampered the chances of a clear detection in our photometry. The object located at =023.63578, = +30.78483 is a faint source in a highly crowded area, two factors that affected the object detection in NIRI images. An inspection of the colors for the 10 objects with IR excess in common in both samples shows that the objects exhibit differences particularly in the (J-H) color, mainly caused by a combination of dissimilar transmission curves between the NIRI-J and NICMOS-F110W filters, and the fact that several of these objects were close to the detection limit in the F110W filter.
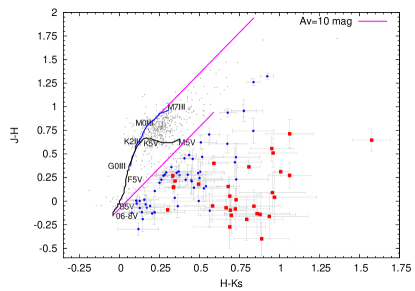
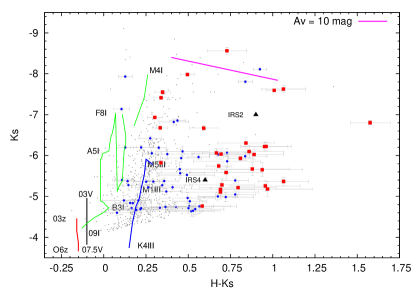
Figure 10 shows the objects’ distribution in the NGC 604 central region, where open circles are stars without IR excess and filled squares denote the objects with IR excess. Contours correspond to the 8.44 GHz radio continuum emission by Churchwell & Goss (1999), designated following the authors’ notation and pink circles denote subregions for which was calculated as it is described below. In Figure 10 it is evident that most of the objects which present IR excess are located in the regions delineated by the radio continuum emission contours. In Churchwell & Goss (1999) the authors concluded that the most luminous knots require the equivalent of five to eight O5 III stars to account for their ionization. An inspection of Figure 10 yields a number ranging from 6 to 15 embedded objects for each peak. The spatial distribution of our candidate MYSOs is also in agreement with a previous study by Tosaki et al. (2007) who, by means of CO molecular emission observations at CO (J = 1-0) and CO (J = 3-2), inferred that the region of the arc coincident with the radio continuum emission C-D and its extension to the East (see Figure 3 of the mentioned paper) have the appropriate high density and temperature conditions to favor and support ongoing massive star formation processes. In addition, for the region coincident with the radio emission peak at knot A, Maíz-Apellániz et al. (2004), based on an exhaustive study of the different gas phases at NGC 604 with HST and ground-based data, suggested that in this location, there is a filled Hii region (in contrast with Hii surfaces) that may be witnessing induced star formation. Similar conclusions related to the embedded star formation in NGC 604 were reached in a study by Relaño & Kennicutt (2009).
Regarding the distribution of objects with IR excess in particular regions within NGC 604, we have also calculated for seven subregions in the NGC 604 central region (marked as large circles in Figure 10). The chosen subregions are coincident with the knots of continuum radio emission at 8.44 GHz (Churchwell & Goss, 1999), where most of the IR excess sources are concentrated. The regions were named A-F, following the authors nomenclature. An extra subregion, ‘X’, located in NGC 604’s main cavity was added. Most of the stars within X belong to the main component of the SOBA, and it covers an area with a concentration of evolved stars. The diameter of the subregions was set at 33 pc (8′′), based on the typical sizes of massive star formation regions and OB associations in the Galaxy. For each subregion, was calculated following the same procedure applied for the whole region. There are 7 objects in the control field within the area of each subregion ( 845 pc2) and none with IR excess. Hence, 7 objects were subtracted from the total number of objects in each subregion to account for background/foreground contamination. The extinction towards the radio components A-F, ranges from AV = 2.8 to 1.7 mag (Churchwell & Goss, 1999) that is equivalent to AK 0.28 - 0.17 mag, which will not affect considerably the obtained values. The results are summarized in Table 4 where Columns 2 and 3 list the center coordinates of each subregion, Column 4 contains the values in percentage and, in parenthesis, the ratio of the number of objects with IR excess to the total number of objects within the subregion after background/foreground contamination correction. In regions X and C, there were subtracted 2 and 1 objects with IR excess, respectively, since they were known WR stars. This analysis shows that the subregions with higher are, in decreasing order, knots D, C and B, and A. There is a noticeable gap between these subregions and the X, F and E which contain little or no objects showing IR excess at all. Although we are aware that these percentages were calculated with relatively few objects, and are therefore very sensitive to small changes in the magnitude limits or subregion sizes, the results just described are well established. Regions C, D, and B are located within the arc pointed-out by Tosaki et al. (2007) to exhibit ongoing star-formation mentioned before, whereas Maíz-Apellániz et al. (2004) proposed that region A may be witnessing induced star formation. On the other hand, region F, coincident with ‘Cluster B’ from Hunter et al. (1996) has an age similar to the main central cluster in NGC 604, and E is coincident with the SNR found by D’Odorico et al. (1980). If correlates with the age of the subregions, as is the case for studies in Galactic star-forming regions (see Haisch et al. 2000,Haisch et al. 2001), the results of this analysis, based on the NIR photometric characteristics of individual objects, is consistent with the idea that most of the objects in regions A, B, C, and D belong to a younger generation than the main SOBA population, which is supported by the mentioned previous studies based on global observations of the gaseous component.

| Region | (J2000) | (J2000) | (excIR/all) |
|---|---|---|---|
| (°) | (°) | (%) | |
| A | 23.639208 | 30.782583 | 69 (9/13) |
| B | 23.639333 | 30.780639 | 75 (6/8) |
| C | 23.634708 | 30.782778 | 75 (12/16) |
| D | 23.633000 | 30.783667 | 88 (15/17) |
| E | 23.637708 | 30.777583 | 0 (0/0) |
| F | 23.632083 | 30.788167 | 0 (0/1) |
| X | 23.635685 | 30.785212 | 15 (4/26) |
3.3 Individual Objects
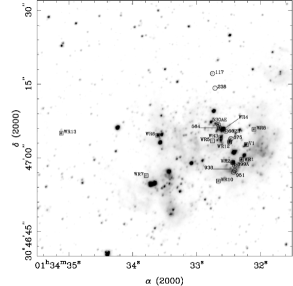
We have also made a brief survey of the relevant individual objects present in
our photometric study that were studied by other authors.
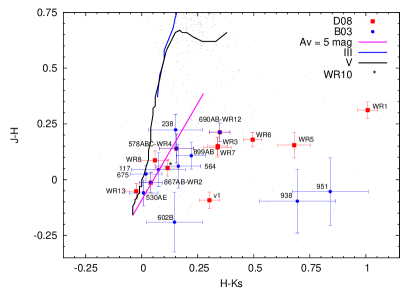
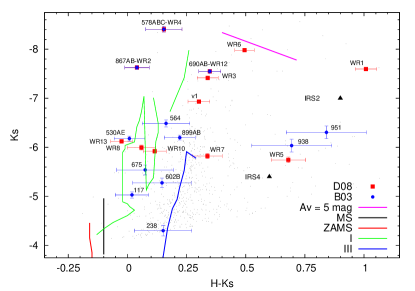
These objects are identified in our NGC 604 field image in Figure 11
and plotted in the respective CC and CM diagrams in Figure 12.
Circles show WR stars included in the study of Drissen et al. (2008) and the references therein. Square boxes identify objects resulted from a visual identification between our NIRI images and the UV images from the study by Bruhweiler et al. (2003). These objects are mainly OB stars with spectral classification derived by the authors from UV HST-STIS spectra.
The identification between the HST finding chart and our NIRI frames must be
considered with the caveat that, at M 33’s distance, for some objects we might be
looking at unresolved stellar blends. An illustrative example can be found when comparing with analog regions, such as the star forming knots in 30 Doradus where Walborn et al. (1999) identified several strong knots lying 2-3 pc away from massive O3-6 stars. A similar configuration would fit within one arcsecond in our images.
In Table
5 we have listed these objects, where Column 1 is the Id.
given in previous studies preceded by a set of characters that identify the
reference, Column 2 contains the object classification from the previous
studies, in Columns 3, 4, and 5 we have included our measured J, H, and Ks
magnitudes, respectively. Those objects marked with c in Column 1 have a
special comment in the following paragraph.
| Id | Reference | Classification | J | H | Ks |
|---|---|---|---|---|---|
| 3791 | D08-WR1 | WCE | 18.32 0.03 | 18.01 0.03 | 17.00 0.04 |
| 1168 | D08-WR2 c | WN | 17.00 0.03 | 17.01 0.03 | 16.97 0.04 |
| 1168 | B03-867 A-Bc | O4Iab-O4Ia | |||
| 3317 | D08-WR3 | WN | 17.68 0.03 | 17.52 0.03 | 17.19 0.04 |
| 3795 | D08-WR4c | WN | 16.49 0.04 | 16.35 0.05 | 16.19 0.06 |
| 3795 | B03-578A-Cc | O9II-O9Ia-09II | |||
| 1257 | D08-WR5 | WC6 | 19.69 0.03 | 19.54 0.05 | 18.86 0.06 |
| 1265 | D08-WR6 | WNL | 17.29 0.02 | 17.11 0.02 | 16.62 0.03 |
| 4021 | D08-WR7 | WC4 | 19.26 0.03 | 19.12 0.03 | 18.78 0.05 |
| 4096 | D08-WR8c | WN6 | 18.75 0.03 | 18.66 0.03 | 18.61 0.05 |
| 3255 | D08-WR10 | WN6 | 18.85 0.03 | 18.79 0.03 | 18.68 0.04 |
| 4075 | D08-WR12c | WNE | 17.61 0.03 | 17.40 0.03 | 17.05 0.04 |
| 4075 | B03-690A-Bc | O5III-BOIb | |||
| 1247 | D08-WR13c | O6.5Iaf | 18.40 0.02 | 18.45 0.03 | 18.48 0.04 |
| 1244 | D08-V1 | Of/WNL | 17.88 0.02 | 17.97 0.03 | 17.67 0.04 |
| 1631 | B03-117 | O4II | 19.61 0.02 | 19.59 0.03 | 19.57 0.06 |
| 1545 | B03-238 | O9III: | 20.67 0.04 | 20.45 0.06 | 20.30 0.11 |
| 1327 | B03-530A-E | O7V: | 18.37 0.04 | 18.43 0.04 | 18.42 0.05 |
| 4297 | B03-564c | O9II | 18.34 0.07 | 18.28 0.07 | 18.11 0.07 |
| 4380 | B03-602B | O9II | 19.28 0.11 | 19.47 0.08 | 19.32 0.10 |
| 4362 | B03-675 | O7II | 19.18 0.04 | 19.13 0.06 | 19.06 0.10 |
| 4224 | B03-899A | O7II | 18.73 0.04 | 18.62 0.04 | 18.40 0.05 |
| 4425 | B03-938c | O6III:: | 19.16 0.09 | 19.26 0.11 | 18.56 0.13 |
| 4335 | B03-951c | O8V | 19.08 0.10 | 19.14 0.11 | 18.29 0.13 |
Comments on individual objects:
WR stars tend to be red objects in the NIR CC and CM diagrams since they are
more luminous in the K band than the J band as they are being observed
through their own obscured envelope and winds.
D08-WR2 was first classified as WN by Conti & Massey (1981), who could not resolve it from D08-WR1. D08 did not include this object in their sample. B03 classified it as O4Iab-O4Ia, since they could identify two objects at this position, being the most massive and luminous as well as the youngest objects of their sample. From a visual inspection of our images, it is evident that there is more than one object at this location although we are not able to resolve them photometrically. The (H-Ks) color of this object in our photometry is bluer than the expected for a WN object but also its Ks magnitude is brighter than the magnitude of a single O I star, which can be explained as the composite emission from two (or more) unresolved objects, in agreement with B03 observations.
D08-WR4 presents a similar situation as D08-WR2. This object was classified as WN by Conti & Massey (1981), who could not resolve it from D08-WR3, and D08-WR5. D08 did not obtain a new spectrum for it, but at the same location B03 obtained a spectra and classified three objects: two are O9II stars and a O9Ia. Again, in our images we are able to resolve only one object but a visual inspection suggests that at this location there is more than a single object. Besides, the blue shifted (H-Ks) color and the bright Ks magnitude indicate that we are possibly measuring the composite emission of a tight group of massive stars (not necessarily evolved as WR objects) in agreement with B03 classification.
D08-WR6 is one of the brightest objects in the region. It was first observed by Drissen et al. (1993) and studied later by Terlevich et al. (1996), who measured a He overabundance and extremely wide spectral emission lines ( 2500 km s-1) as well as a spectral variability in a time span of 10 years. The authors classified this object as a transition object between a Luminous Blue Variable and a WR star.
D08-WR8 was already known as a WR object candidate when D08 precisely classified it as WN6. In the HST F170W images it is clear that there are two objects very close together in projection, although our photometry distinguishes only one object, that may cause the D08-WR8 blue color in our CC diagram.
D08-WR12 is resolved into two objects in B03 HST images, the authors classified them as O5III and a B0Ib, although D08 is in disagreement with these spectral types, based mainly on the presence of the Heii (4686) emission line. D08 argued that although their spectrum is a composite of two stars most of the emission lines must come from the brightest star (the B0Ib for B03) and they classified it as a WN10 star.
D08-WR13, this object is approximately 30 arcseconds away from the central cluster. D08 suggested that its spectral type is O6 Iaf. This object does not exhibit IR excess in our photometry.
B03-564 is really two stars but we are not able to resolve them, so our magnitudes have contributions from both objects.
B03-938 was classified as O6III:: by B03. In the HTS-STIS F170W image it is clear that there are two objects close together in projection while in our photometry only one is detected. Besides, these objects are located in a region within a ring of noticeable nebular emission which probably causes the red color of this object in our CC diagram.
B03-951, is located close to B03-938, in the same nebular ring, and it is also red for its O8 V spectral type according to B03 classification.
4 SUMMARY AND CONCLUDING REMARKS
We have performed a NIR photometric study on the NGC 604 massive star-forming region, using Gemini-NIRI images.
Our study was focused on the detection and individual identification of massive young stellar objects that comprise a new stellar generation in the region.
By means of JHKs photometry we have identified 68 candidates MYSOs. These objects were selected by their position in the CC diagram (each of these objects exhibits IR excess greater than their photometric error in (H-Ks)).
The analysis of the spatial distribution shows that most of the MYSOs candidates are located in areas with strong nebular emission, delineated by the radio continuum contours at 8.44 GHz, where previous studies stated the possibility of star formation processes taking place.
We have calculated the fraction of objects with IR excess throughout the whole region. The result yields that several regions in NGC 604 show a high fraction of objects with IR excess for the cluster age. Although it is not possible to perform a direct comparison with star forming regions in our Galaxy, this could be interpreted as a recent burst of star formation. Studies of other GHRs are necessary to establish whether there is a general tendency for regions of massive star formation to present higher IR-excess fractions and to understand the true nature of IR-excesses in MYSOs.
We have made a short review of individual objects in NGC 604 included in our sample, which were already studied by other authors.
All these results complete a general picture that exhibits the existence of a new stellar generation in the NGC 604 region, which is mainly taking place in the molecular gas that extends to the south-east side of the main SOBA population.
This is the first study of the NGC 604 star forming region dedicated to the detection of individual MYSOs candidates. New detailed observations for each object are needed to confirm the nature of the MYSOs candidates we have found and also to provide information on the physical conditions of the circumstellar matter which is causing the observed IR excess.
Acknowledgments
This research was based on observations obtained at the Gemini Observatory, which is operated by the Association of Universities for Research in Astronomy, Inc., under a cooperative agreement with the NSF on behalf of the Gemini partnership: the National Science Foundation (United States), the Science and Technology Facilities Council (United Kingdom), the National Research Council (Canada), CONICYT (Chile), the Australian Research Council (Australia), Ministério da Ciência e Tecnologia (Brazil) and Ministerio de Ciencia, Tecnología e Innovación Productiva (Argentina). The authors would like to specially thank Andrew Stephens, from Gemini Observatory, for his help regarding the data processing procedures of Gemini-NIRI images and Andrew McWilliam for his final revision of the English text. We have also benefited from fruitful discussions with Roberto Terlevich. We are grateful to the anonymous referee for the thorough review which has led to a much improved version from the original manuscript.
References
- Barbá et al. (2009) Barbá, R. H., Maíz Apellániz, J., Pérez, E., Rubio, M., Bolatto, A., Fariña, C., Bosch, G., & Walborn, N. R. 2009, Ap&SS, 324, 309
- Bik et al. (2003) Bik, A., Lenorzer, A., Kaper, L., Comerón, F., Waters, L. B. F. M., de Koter, A., & Hanson, M. M. 2003, A&A, 404, 249
- Bosch et al. (2002) Bosch, G., Terlevich, E., & Terlevich, R. 2002, MNRAS, 329, 481
- Bruhweiler et al. (2003) Bruhweiler, F. C., Miskey, C. L., & Smith Neubig, M. 2003, AJ, 125, 3082
- Churchwell & Goss (1999) Churchwell, E. & Goss, W. M. 1999, ApJ, 514, 188
- Cioni et al. (2008) Cioni, M., Irwin, M., Ferguson, A. M. N., McConnachie, A., Conn, B. C., Huxor, A., Ibata, R., Lewis, G., & Tanvir, N. 2008, A&A, 487, 131
- Conti & Massey (1981) Conti, P. S. & Massey, P. 1981, ApJ, 249, 471
- Diaz et al. (1987) Diaz, A. I., Terlevich, E., Pagel, B. E. J., Vilchez, J. M., & Edmunds, M. G. 1987, MNRAS, 226, 19
- D’Odorico et al. (1980) D’Odorico, S., Dopita, M. A., & Benvenuti, P. 1980, A&AS, 40, 67
- D’Odorico & Rosa (1981) D’Odorico, S. & Rosa, M. 1981, ApJ, 248, 1015
- Drissen et al. (2008) Drissen, L., Crowther, P. A., Úbeda, L., & Martin, P. 2008, MNRAS, 389, 1033
- Drissen et al. (1993) Drissen, L., Moffat, A. F. J., & Shara, M. M. 1993, AJ, 105, 1400
- Eldridge & Relaño (2011) Eldridge, J. J. & Relaño, M. 2011, MNRAS, 411, 235
- Engargiola et al. (2003) Engargiola, G., Plambeck, R. L., Rosolowsky, E., & Blitz, L. 2003, ApJS, 149, 343
- Freedman et al. (2001) Freedman, W. L., Madore, B. F., Gibson, B. K., Ferrarese, L., Kelson, D. D., Sakai, S., Mould, J. R., Kennicutt, Jr., R. C., Ford, H. C., Graham, J. A., Huchra, J. P., Hughes, S. M. G., Illingworth, G. D., Macri, L. M., & Stetson, P. B. 2001, ApJ, 553, 47
- Furuya et al. (1999) Furuya, R. S., Kitamura, Y., Saito, M., Kawabe, R., & Wootten, H. A. 1999, ApJ, 525, 821
- González Delgado & Pérez (2000) González Delgado, R. M. & Pérez, E. 2000, MNRAS, 317, 64
- Haisch et al. (2000) Haisch, Jr., K. E., Lada, E. A., & Lada, C. J. 2000, AJ, 120, 1396
- Haisch et al. (2001) —. 2001, ApJ, 553, L153
- Hanson et al. (1997) Hanson, M. M., Howarth, I. D., & Conti, P. S. 1997, ApJ, 489, 698
- Hunter et al. (1996) Hunter, D. A., Baum, W. A., O’Neil, Jr., E. J., & Lynds, R. 1996, ApJ, 456, 174
- Kraus (2009) Kraus, M. 2009, A&A, 494, 253
- Lamers et al. (1998) Lamers, H. J. G. L. M., Zickgraf, F.-J., de Winter, D., Houziaux, L., & Zorec, J. 1998, A&A, 340, 117
- Lasker et al. (2008) Lasker, B. M., Lattanzi, M. G., McLean, B. J., Bucciarelli, B., Drimmel, R., Garcia, J., Greene, G., Guglielmetti, F., Hanley, C., Hawkins, G., Laidler, V. G., Loomis, C., Meakes, M., Mignani, R., Morbidelli, R., Morrison, J., Pannunzio, R., Rosenberg, A., Sarasso, M., Smart, R. L., Spagna, A., Sturch, C. R., Volpicelli, A., White, R. L., Wolfe, D., & Zacchei, A. 2008, AJ, 136, 735
- Maíz-Apellániz (2000) Maíz-Apellániz, J. 2000, PASP, 112, 1138
- Maíz-Apellániz et al. (2004) Maíz-Apellániz, J., Pérez, E., & Mas-Hesse, J. M. 2004, AJ, 128, 1196
- Martins & Plez (2006) Martins, F. & Plez, B. 2006, A&A, 457, 637
- Massey & Johnson (1998) Massey, P. & Johnson, O. 1998, ApJ, 505, 793
- Medina Tanco et al. (1997) Medina Tanco, G. A., Sabalisck, N., Jatenco-Pereira, V., & Opher, R. 1997, ApJ, 487, 163
- Miroshnichenko (2006) Miroshnichenko, A. S. 2006, in Astronomical Society of the Pacific Conference Series, Vol. 355, Stars with the B[e] Phenomenon, ed. M. Kraus & A. S. Miroshnichenko, 13–+
- Miura et al. (2010) Miura, R., Okumura, S. K., Tosaki, T., Tamura, Y., Kurono, Y., Kuno, N., Nakanishi, K., Sakamoto, S., Hasegawa, T., & Kawabe, R. 2010, ApJ, 724, 1120
- Munoz-Tunon et al. (1996) Munoz-Tunon, C., Tenorio-Tagle, G., Castaneda, H. O., & Terlevich, R. 1996, AJ, 112, 1636
- Relaño & Kennicutt (2009) Relaño, M. & Kennicutt, R. C. 2009, ApJ, 699, 1125
- Rieke & Lebofsky (1985) Rieke, G. H. & Lebofsky, M. J. 1985, ApJ, 288, 618
- Robin et al. (2003) Robin, A. C., Reylé, C., Derrière, S., & Picaud, S. 2003, A&A, 409, 523
- Rosa & D’Odorico (1982) Rosa, M. & D’Odorico, S. 1982, A&A, 108, 339
- Rosolowsky et al. (2003) Rosolowsky, E., Engargiola, G., Plambeck, R., & Blitz, L. 2003, ApJ, 599, 258
- Stahler & Palla (2004) Stahler, S. W. & Palla, F. 2004, The Formation of Stars, WiILEY-VCH, 2004
- Stetson (1987) Stetson, P. B. 1987, PASP, 99, 191
- Tenorio-Tagle et al. (2000) Tenorio-Tagle, G., Muñoz-Tuñón, C., Pérez, E., Maíz-Apellániz, J., & Medina-Tanco, G. 2000, ApJ, 541, 720
- Terlevich et al. (1996) Terlevich, E., Díaz, A. I., Terlevich, R., González-Delgado, R. M., Pérez, E., & García Vargas, M. L. 1996, MNRAS, 279, 1219
- Tokunaga (2000) Tokunaga, A. T. 2000, Infrared Astronomy, 143
- Tosaki et al. (2007) Tosaki, T., Miura, R., Sawada, T., Kuno, N., Nakanishi, K., Kohno, K., Okumura, S. K., & Kawabe, R. 2007, ApJ, 664, L27
- Tüllmann et al. (2008) Tüllmann, R., Gaetz, T. J., Plucinsky, P. P., Long, K. S., Hughes, J. P., Blair, W. P., Winkler, P. F., Pannuti, T. G., Breitschwerdt, D., & Ghavamian, P. 2008, ApJ, 685, 919
- Viallefond et al. (1992) Viallefond, F., Boulanger, F., Cox, P., Lequeux, J., Perault, M., & Vogel, S. N. 1992, A&A, 265, 437
- Walborn et al. (1999) Walborn, N. R., Barbá, R. H., Brandner, W., Rubio, M., Grebel, E. K., & Probst, R. G. 1999, AJ, 117, 225
- Wegner (2007) Wegner, W. 2007, MNRAS, 374, 1549
- Wilson & Scoville (1992) Wilson, C. D. & Scoville, N. 1992, ApJ, 385, 512
- Yang et al. (1996) Yang, H., Chu, Y., Skillman, E. D., & Terlevich, R. 1996, AJ, 112, 146