Performance data from the ZEPLIN-III second science run
Abstract
ZEPLIN-III is a two-phase xenon direct dark matter experiment located at the Boulby Mine (UK). After its first science run in 2008 it was upgraded with: an array of low background photomultipliers, a new anti-coincidence detector system with plastic scintillator and an improved calibration system. After 319 days of data taking the second science run ended in May 2011. In this paper we describe the instrument performance with emphasis on the position and energy reconstruction algorithm and summarise the final science results.
keywords:
ZEPLIN-III; dark matter; liquid xenon detector1 Introduction
The ZEPLIN-III experiment searching for Weakly Interacting Massive Particles (WIMPs) operated in the Palmer Laboratory 1070 m underground (2850 m water equivalent) at the Boulby mine (North East of England) between 2006 and 2011. After 3 kg single phase ZEPLIN-I [1] and 31 kg double phase ZEPLIN-II [2] running between 2001 and 2006, ZEPLIN-III was the third generation of liquid xenon experiments deployed at Boulby. This two-phase xenon detector filled with 12 kg of liquid xenon (LXe) detects both scintillation light and ionisation released from particle interactions. The ionisation charge is drifted upward by an applied electric field and is emitted into a few mm thick xenon gas layer where it is accelerated creating electroluminescence light. Both light signals, S1 and S2, are detected by an array of 31, upward-facing, 2-inch photomultipliers located underneath the liquid xenon target. The S2/S1 ratio is used to discriminate electron recoils, caused by radioactive background, from nuclear recoils caused by WIMP interactions. A detailed description of the detector design can be found in [3].
2 Detector Performance
After the first science run (FSR) of 83 days [4, 5, 6], the ZEPLIN-III detector was upgraded; this involved the replacement of the photomultipliers, inclusion of a new anti-coincidence detector and a new automated calibration source delivery system, as well as several other calibration-related improvements. The second science run (SSR) started on the 24th June 2010 and ended on the 7th May 2011, delivering a raw fiducial exposure of 1343.8 kgdays.
For the SSR new, custom-built low background photmultipliers, model D766Q from ET Enterprises Limited [7], were used reducing the overall background gamma radiation in ZEPLIN-III by a factor of 18 [8]. Despite very low radioactivity, below 50 mBq/PMT, their optical performance compared to the previous set of PMTs used in the FSR was poor. Their average quantum efficiency at 175 nm was 26.2% instead of 30% and the gain variation between PMTs was a factor of 100 (max/min), almost 17 times greater than in the FSR. This resulted in an energy resolution of 12% at 122 keV and discrimination power of 280:1, compared to 8.1% and 7800:1, respectively, in the FSR.
The anti-coincidence system consisted of 32 barrel and 20 roof plastic scintillator slabs coupled to a gadolinium-loaded passive polypropylene shield [9]. As shown in Figure 1, the veto detector was placed between the ZEPLIN-III detector and the lead gamma shield, providing greater than 3 sr coverage. Neutrons entering the hydrogen-rich polypropylene moderate down to thermal energies and are captured by the 157Gd. The neutron cooling and capture process takes an average 10.7 s and ends with the emission of 3-4 -rays which, with an average total energy of 8 MeV, are detected by the plastic scintillator.
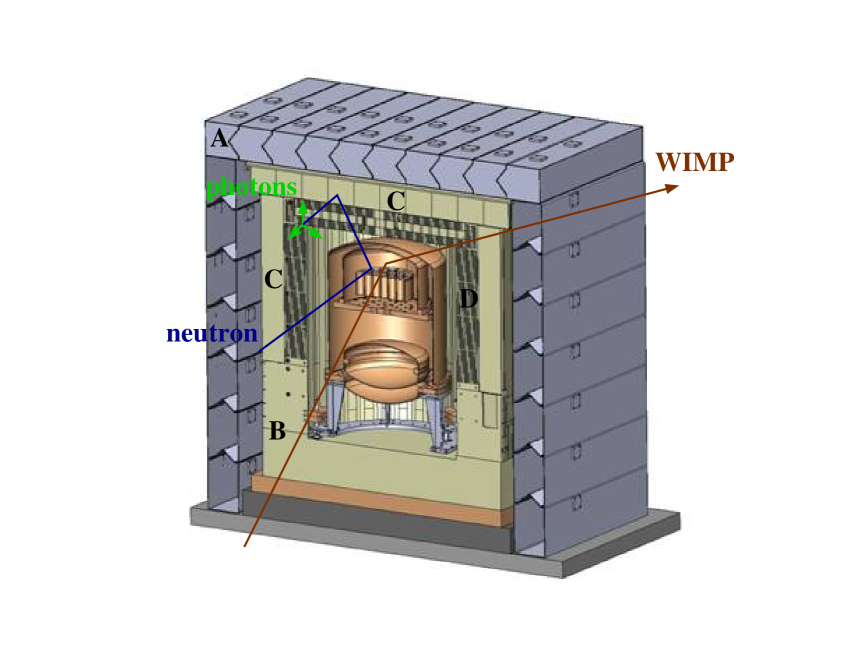
The signal from each scintillator bar was detected by a 3-inch photomultiplier and then digitized with 100 ns sampling rate by a CAEN-1724 ADCs. Waveforms of 320 s were read out in order to provide information about prompt (PTAG) and delayed (DTAG) coincidences. Calibration with neutron sources demonstrated a 60% efficiency of the neutron tagging. The veto system also provided the rejection of 28% for -ray background for prompt coincidences [10].
During the SSR ZEPLIN-III was equipped with a new automated -ray calibration source delivery system. It consisted of a motorised cable pulley system to which a radioactive source was attached, traveling down the pipe connected to the ZEPLIN-III dome as shown in Figure 2.
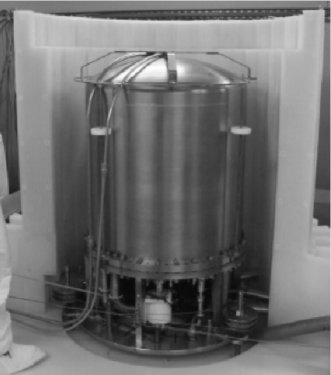
The pipe with a smaller aperture served to guide a 57Co source for daily -calibration, whereas the wider one guided the manually inserted Am-Be source, for the occasional neutron calibrations. The system was driven by the slow-control PC, which was programmed to perform daily calibration. The system was completely reliable.
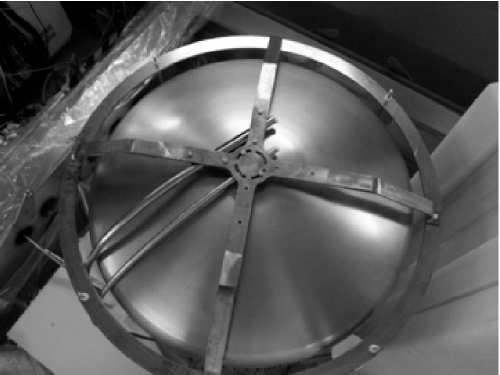
In addition to the new calibration system a 5.1 mm thick copper ‘phantom’ grid with 3 cm 3 cm rectangular voids was placed on top of the anode plate. The 122 keV photons from the 57Co calibration source, located centrally above the LXe target, were attenuated by the phantom grid, creating a shadow image on the liquid surface. This was used to test the position reconstruction algorithm and to measure the spatial resolution of the PMT readout.
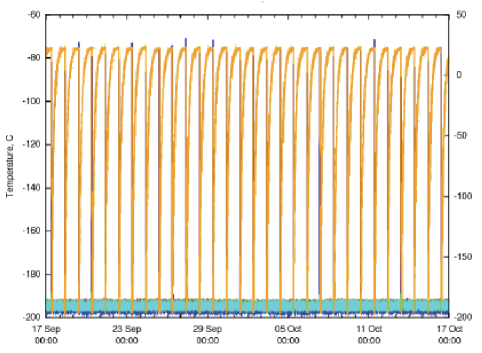
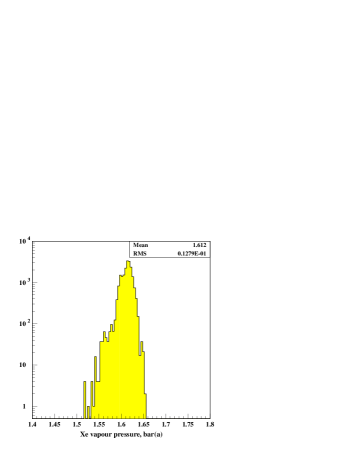
Daily detector operations – including detector calibration, liquid nitrogen (LN2) refill and the data transfer – interrupted the science run for only one hour, thus achieving routinely a 96% duty cycle. An example of the excellent stability and reproducibility is shown in Figure 3, plotting one month’s worth of daily LN2 refills which occured every day exactly at the same time. Pressure of the xenon vapour above the target was kept at 1.6 bar, with a rms variability at the level of 1%.
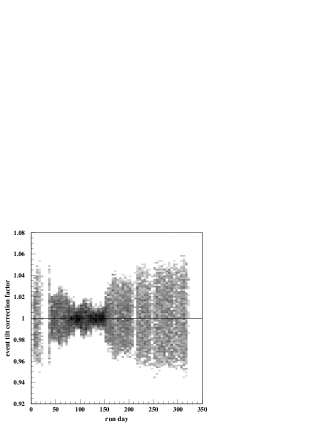
Slow movement of the rock underneath the detector, causing a tilt, was monitored using the width of the S2 signal from the calibration data. The history of the correction factor due to detector tilt is shown in Figure 4. The tilt was rectified weekly to first order using the pulley system visible in Figure 2. Long exposure and neutron calibration runs were carried out at the beginning and at the end of the data taking run. To control PMT performance, weekly calibrations were performed with an LED gun coupled to a quartz optical fibre which delivered light directly into the xenon target.
2.1 Data acquisition and processing
Since the PMT array was powered by a single high voltage supply all signal outputs were equalized with a set of Phillips Scientific 804 attenuators. Subsequently, the signals were split into two channels and digitized with 2 ns sampling using ACQIRIS DC256 8-bit flash ADCs. In one of the channels signals were amplified 10 by fast Phillips Scientific 770 amplifiers to achieve a higher dynamic range. Additionally all signals were summed with a Hoshin N005 sum amplifier with the output signal used to trigger the DAQ system.
The acquired 36 s long waveforms were reduced with ZE3RA [11] software, producing an array of parameters for the 10 largest pulses. Afterwards an event filtering tool was used to retain events containing only one pair of pulses coming from the liquid scintillation (S1) and the gas electroluminescence (S2). The energy and position reconstruction, from the S1 and S2 signals, for each event was performed with the bespoke software Mercury [12] using pulse areas and the z coordinate calculated from S2-S1 timing information.
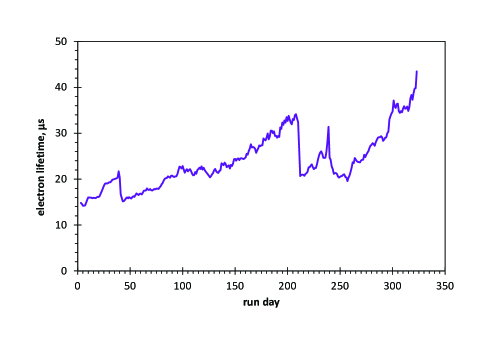
In addition to the data processing the following corrections have been applied to each selected single scatter event: electronics gain drift, detector tilt, vapour pressure variation and electron lifetime in the liquid which, as shown in Figure 4, with an initial value of 14 s at the beginning of the run gradually increasing to 45 s by the end of the run. Although there is no gas recirculation/purification once the detector is in operation, this parameter improved steadily during the run. This is mainly due to the sweeping of electronegative ions away from the LXe bulk by the electric field and, to a smaller extent, due to gettering of electronegative impurities by the detector components. Periods of sharp lifetime degradation correspond to power failures at the underground lab. Finally, all events were checked for veto tagging of any kind. A total of 28% of all -ray events were flagged as PTAG as expected for the -ray background.
2.2 Event energy and position reconstruction
Event reconstruction consists of estimating the energy and the position of an event given a set of the corresponding PMT pulse areas. For an event at position producing photons, the probability of the i-th PMT detecting photons is well approximated by the Poisson distribution:
| (1) |
where =N() is the expected number of photons from initial photons detected by the i-th PMT with the () being the Light Response Function (LRF) – the fraction of the photons emitted by the source that produce a detectable signal in the i-th PMT.
In this case the interaction location () and the total number of emitted photons () can be found by the Maximum Likelihood (ML) method as was first proposed by Gray and Makovsky [13]. Given the number of photons detected by each PMT, the logarithm of the likelihood function can be expressed as [14]:
| (2) |
where depends only on the ni.
Different statistical approaches have been applied to reconstruct the S1 and S2 signals. Since the total collected charge in the S1 signal equals only 1.2 phe/keV the statistical variation of the number of photoelectron in each PMT is Poissonian; in this case the event is reconstructed by maximizing the above function. On the other hand, the size of the S2 pulse is boosted by the electroluminescence in the gas (a single electron extracted to the gas phase produces an average of 12 photoelectrons in the SSR configuration [15]); this is typically two orders of magnitude larger than S1. In this instance the reconstruction is performed with a weighted least square (WLS) method. In this case the parameters were obtained through the following minimisation:
| (3) |
where and are the measured and the expected output signals of the i-th PMT, respectively; is the mean of the single photoelectron probability density function (PDF) and is the weighting factor related to the variance of .
Both the ML and WLS methods can be used only if the LRF is well known. In principle, it should be either measured or calculated beforehand. In the case of ZEPLIN-III, however, the direct measurement poses great technical difficulty and calculation could not provide the necessary precision. For this reason, a novel method was developed for in-situ reconstruction of the PMT light response functions (LRF). These were obtained from the calibration data acquired by irradiating the detector with an uncollimated -ray source. The method takes advantage of the fact that, for the ZEPLIN-III geometry, the LRFs are functions of the distance from the PMT axis only. These LRFs were reconstructed iteratively from a set of 122 keV events from the 57Co calibration.
In the first step, the vertex positions were estimated by means of a simple centroid algorithm. For each PMT the area of S2 pulses was plotted versus reconstructed distance and fitted by a smooth non-increasing function; this then became the first approximation for the corresponding LRF. Using this first approximation, the event positions were re-estimated by the WLS method and the fitting was repeated giving the next (better) approximation for the LRFs. The iteration continued until the response function converged. A reconstructed image of the phantom grid after five iterations is shown in Figure 5. On the same figure, the profiles of the reconstructed event density are shown for the and directions. From these profiles, a spatial resolution of 1.1 mm (FWHM) was calculated for S2 signals. The spatial resolution for S1 was measured as the spread of the S1 position with respect to that of S2 and was estimated to be 13 mm. Note that the sharpness of the image is dominated by scattering of the -rays in the 7-mm thick anode mirror under the copper grid, rather than by the position resolution.


A linear combination of S1 and S2 signals from 57Co source was used to estimate the energy resolution at 122 keV. In the central region of 50 mm radius the reconstructed energy resolution for the FSR and the SSR were 8.1% and 12%, respectively. In case of the FSR dataset the line at 136 keV was clearly resolved.
3 WIMP Results
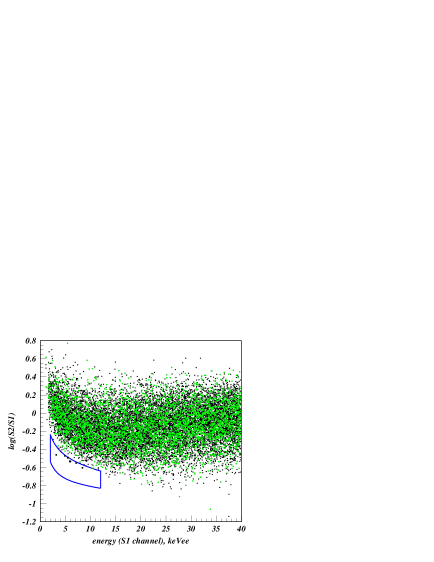
The fiducial region of the detector was chosen to be a central cylinder of 140 mm radius and contained 5.1 kg of liquid xenon. Figure 6 shows all events in the S2/S1 parameter space from the final analysis reported in [19]. The acceptance region for the WIMP search was defined between 2 and 12 keV electron-equivalent energy and to contain 2 – 45% acceptance in the log(S2/S1) parameter. This is below the mean of the nuclear recoil band derived from the neutron calibration [16]. Eight events were found in the box, none of which had been vetoed. The number of DTAG events in the dataset was consistent with random coincidences and none were below the nuclear recoil median. The number of nuclear recoils events predicted for the search region was 0.060.01. The number of electron recoils events leaking into the WIMP search box was estimated in two ways, from a dedicated 137Cs calibration run and using binned skew-Gaussian fits to the gamma band above the search box, giving 9.33.9 and 6.53.4 events, respectively.
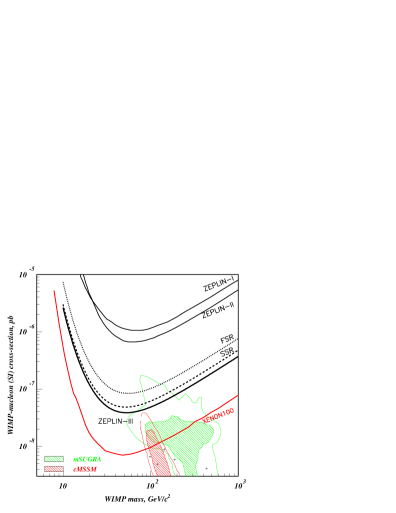
A binned profile likelihood ratio [17, 18] statistical analysis yielded a two-sided confidence interval 0–5.1 signal events at 90% CL as described in detail in [19]. New upper limits on the WIMP-nucleon scalar cross-sections derived for the FSR, SSR and the combined exposure are presented in Figure 5. To show the progress of the entire ZEPLIN programme at Boulby, which produced competitive results for over a decade, both limit results from ZEPLIN-I and ZEPLIN-II have been also included in Figure 5. The present best world limit by XENON100 [20], another two-phase xenon experiment, is also shown.
4 Conclusions
ZEPLIN-III was upgraded with new photomultipliers and an anti-coincidence detector was also installed. The latter served not only as a neutron detecting system but also as an excellent diagnostic tool for the -ray background. The prediction of 28% of PTAG events was confirmed showing a very good understanding of the dominant radiation background. Thanks to the newly automated daily detector operations including -ray calibrations, LN2 refill and the data transfer a 96% duty cycle was achieved routinely. An excellent reproducibility, and control of detector parameters such as: liquid purity, detector tilt, gas gap thickness and the xenon vapor pressure contributed greatly to the very competitive final results from the SSR. Achieving good vertex and energy reconstruction with poorly performing photomultipliers was a key challenge in data analysis. The second science run delivered a 90% CL upper limit on the scalar WIMP cross-section of 4.810-8 pb/nucleon near 50 GeV/c2 mass. The combined result from the FSR and SSR is 3.910-8 pb/nucleon.
The instrument performance in 319 days of the second run demonstrated clearly that xenon emission detectors can possess the required long-term stability and reliability for rare event searches (even if LN2-cooled).
5 Acknowledgments
The UK groups acknowledge the support of the Science & Technology Facilities Council (STFC) for the ZEPLIN–III project and
for maintenance and operation of the underground Palmer laboratory which is hosted by Cleveland Potash Ltd (CPL) at Boulby Mine, near
Whitby on the North-East coast of England. The project would not be possible without the co-operation of the management and staff of CPL.
We also acknowledge support from a Joint International Project award, held at ITEP and Imperial College, from the Russian Foundation of
Basic Research (08-02-91851 KO a) and the Royal Society. LIP–Coimbra acknowledges financial support
from Fundação para a Ciência e a Tecnologia (FCT) through the project-grants CERN/FP/109320/2009 and CERN/FP/116374/2010,
as well as the postdoctoral grants SFRH/BPD/27054/2006,
SFRH/BPD/47320/2008 and SFRH/BPD/63096/2009. This work was supported in part by SC Rosatom,
contract #H.4e.45.90.11.1059 from 10.03.2011.
References
- [1] G. J. Alner, et al., First limits on nuclear recoil events from the ZEPLIN I galactic dark matter detector, Astropart. Phys. 23 (2005) 444.
- [2] G. J. Alner, et al., First limits on nuclear recoil signals in ZEPLIN-II: A two phase xenon detector for dark matter detection, Astropart. Phys. 28 (2007) 287. arXiv:astro-ph/0701858
- [3] D. Yu. Akimov, et al., The ZEPLIN-III dark matter detector: instrument design, manufacture and commissioning, Astropart. Phys. 27 (2007) 46. arXiv:astro-ph/0605500
- [4] V. N. Lebedenko, et al., Results from the First Science Run of the ZEPLIN-III Dark Matter Experiment, Phys. Rev. D 80 (2009) 052010. arXiv:0812.1150
- [5] V. N. Lebedenko, et al., Limits on the spin-dependent WIMP-nucleon cross-section from the First Science Run of ZEPLIN-III., Phys. Rev. Lett. 103 (2009) 151302.
- [6] D. Yu. Akimov, et al., Limits on Inelastic Dark Matter with ZEPLIN-III., Phys. Lett. B 692 (2010) 180. arXiv:1003.5626
- [7] \hrefhttp://www.et-enterprises.comhttp://www.et-enterprises.com
- [8] H. M. Araújo, et al., Radioactivity Backgrounds in ZEPLIN-III., Astropart. Phys. (2011) in press arXiv:1104.3538v2
- [9] D. Yu. Akimov, et al., The ZEPLIN-III Anti-Coincidence Veto Detector, Astropart. Phys. 34 (2010) 151. arXiv:1104.4207
- [10] C. Ghag, et al., Performance of the veto detector incorporated into the ZEPLIN-III coincidence, Astropart. Phys. 35(2) (2011) 76. arXiv:1103.0393
- [11] F. Neves, et al., ZE3RA: the ZEPLIN-III reduction and analysis package, JINST 6 (2011) P11004. arXiv:1106.0808
- [12] V. Solovov, et al., Position and Energy Estimation for ZEPLIN-III Dark Matter Detector, in preparation.
- [13] R. Grey and A. Macovski, Maximum a posteriori estimation of position in scintillation cameras., IEEE Trans. Nucl. Phys. 23 1976 849
- [14] W. R. Cook et al, A thick Anger Camera For Gamma-Ray Astronomy., IEEE Trans. Nucl. Phys. NS32 1985 129
- [15] E. Santos et al, Single electron emission in two-phase xenon with application to the detection of coherent neutrino-nucleus scattering, submitted to JHEP. arXiv:1110.3056
- [16] M. Horn at al. Nuclear recoil scintillation and ionisation yields in liquid xenon from ZEPLIN-III data, Phys. Lett. B. 705 2011 471 arXiv:1106.0694
- [17] B. Sen, M. Walker, M. Woodroofe, On the Unified Method with Nuisance Parameters., Statist. Sinica. 19 2009 301
- [18] W. Rolke, A. López, J. Conrad Limits and confidence intervals in the presence of nuisance parameters., Nucl. Instrum. Meth. A. 551 2005 493
- [19] D. Yu. Akimov et al., WIMP-nucleon cross section results from the second science run of ZEPLIN-III, submitted to Phys. Lett. B. arXiv:1110.4769
- [20] E. Aprile et al., Dark Matter Results from 100 Live Days of XENON100 Data, Phys. Rev. Lett. 107 2011 131302. arXiv:1104.2549