Length sensing and control strategies for the LCGT interferometer
Abstract
The optical readout scheme for the length degrees of freedom of the LCGT interferometer is proposed. The control scheme is compatible both with the broadband and detuned operations of the interferometer. Interferometer simulations using a simulation software Optickle show that the sensing noise couplings caused by the feedback control can be reduced below the target sensitivity of LCGT with the use of feed forward. In order to improve the duty cycle of the detector, a robust lock acquisition scheme using auxiliary lasers will be used.
pacs:
95.55.Ym, 42.60.Da1 Introduction
The second generation interferometric gravitational wave detectors, such as LCGT, advanced LIGO and advanced Virgo are planned to start observations around 2017 to 2018. The ambitious sensitivity goals set by those projects require that the mirrors of the interferometers be controlled with extremely high accuracy and lowest possible disturbance. All of the above mentioned detectors will use an optical configuration called Resonant Sideband Extraction (RSE) [1], where a mirror is placed at the anti-symmetric port of the interferometer to modify the spectral shape of the quantum noises. As a result, the number of degrees of freedom (DOFs) to be controlled is increased from the first generation detectors. Moreover, the strong laser power circulating in the interferometer creates optical springs, resulting in opto-mechanical couplings between otherwise independently suspended mirrors. This complicated situation calls for a highly sophisticated design of the interferometer sensing and control system.
In this paper, we will explain the signal extraction scheme to be used in LCGT, the next generation gravitational wave detector in Japan [2]. The focus of this paper is on the length sensing and control. However, the control of the mirror orientations is equally important and it shall be explained elsewhere in a separate paper.
2 LCGT interferometer
| Arm Cavity Finesse | 1550 | SRC Detuning for DRSE | 3.5∘ |
|---|---|---|---|
| Power Recycling Gain | 10 | Input Laser Power | 51 W |
| SRM Reflectivity | 85% | Main Mirror Mass | 22.8 kg |
LCGT will be constructed at the underground site of Kamioka mine with the baseline length of 3 km. The seismically quiet environment of the Kamioka site is a great advantage for the stable and low noise operation of sensitive devices like a gravitational wave detector. Another major feature of LCGT is the use of cryogenic sapphire mirrors, cooled down to 20K, to suppress the thermal noises.
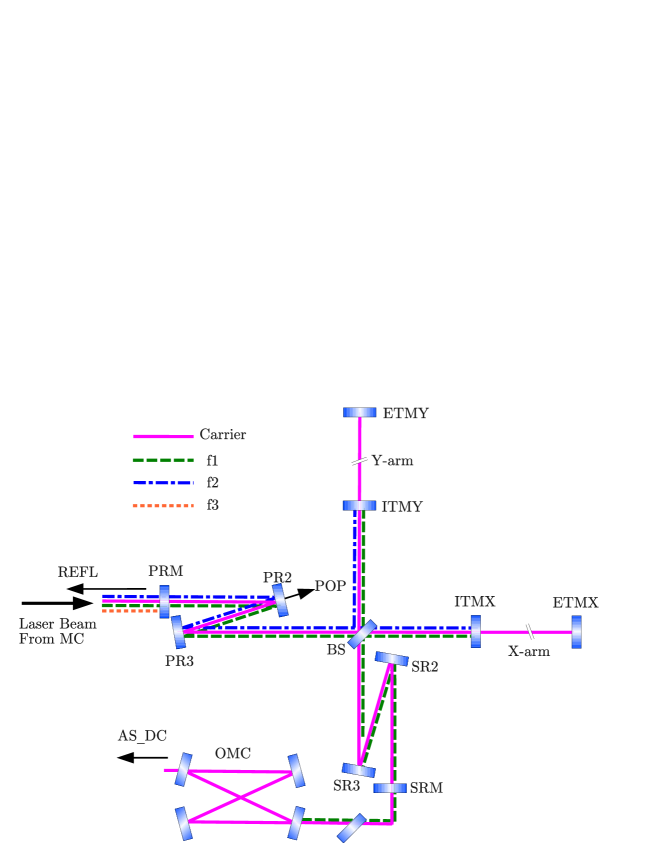
The optical configuration of LCGT as well as the naming conventions of the various parts of the interferometer are shown in Figure 1. This configuration is called power-recycled RSE. The basic parameters of the LCGT interferometer are shown in Table 1. These parameters are selected to maximize the scientific output of the gravitational wave observation by optimizing the quantum noise spectrum given practical constraints, such as the maximum cooling power for the mirrors, and the spectra of classical noises [3].
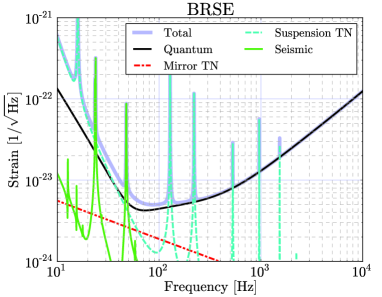
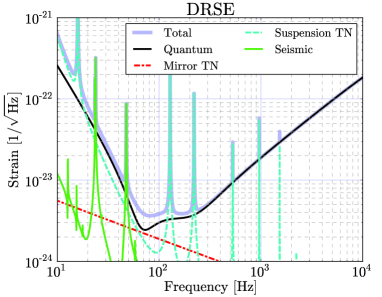
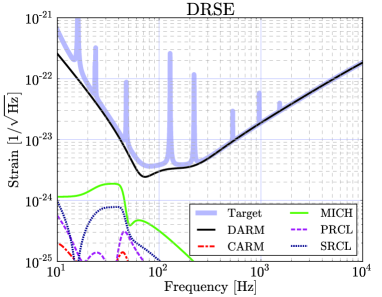
LCGT is planned to be operated both in broadband RSE (BRSE) and detuned RSE (DRSE) configurations. Therefore, the interferometer control scheme has to be able to handle both the operation modes. Figure 2 shows the projected noise curves of thee LCGT interferometer for the two operation modes.
There is an output mode cleaner (OMC) at the downstream of the signal recycling cavity (SRC) to remove unwanted light components and only transmit the signal sidebands generated by the differential length change of the arm cavities. The signal sidebands contain the information of gravitational waves. They are converted into the power changes on a photo detector by the DC readout scheme, which is explained later.
The power recycling cavity (PRC) and SRC have two mirrors each to fold the beam in a Z-shape. These folding parts serve as telescopes to add extra Gouy phase changes in the cavities. The purpose of the additional Gouy phase is to avoid the degeneracy of the recycling cavities in terms of the higher order optical modes.
In order to keep the interferometer at the optimal operation point, there are five length degrees of freedom to be controlled: i) Differential change of the arm cavity lengths (DARM), ii) Common change of the arm cavity lengths (CARM), iii) Differential change of the Michelson arms formed by the BS and the two ITMs (MICH), iv) PRC length (PRCL) and v) SRC length (SRCL). These five DOFs are represented as the linear combinations of the mirror displacements, and called the canonical DOFs in this paper. DARM is the most important DOF, because it contains information of gravitational waves. All other DOFs are collectively called auxiliary DOFs. The purpose of a length sensing and control system is to measure the variations of the canonical DOFs and apply appropriate feedback to minimize the fluctuations.
3 Signal Extraction Scheme
3.1 RF Sidebands
The main laser of LCGT is phase modulated at two radio frequencies (RFs), called f1 and f2, to generate RF sidebands. An additional amplitude modulation, called f3, is also applied during the lock acquisition. The resonant conditions of the RF sidebands are shown in Figure 1. The f1 sidebands are resonant both in the PRC and SRC, but not in the arm cavities. Therefore, they carry the information of the PRC and SRC, without affected by the arm cavities. Since the f1 sidebands partially transmit through the Michelson part, they are also sensitive to the MICH degree of freedom. The f2 sidebands are resonant only in the PRC. Therefore, they are only sensitive to the change of PRCL. The amplitude modulated sidebands f3 are not resonant in any part of the interferometer, providing stable local oscillator fields for other RF sidebands. The f3 has to be amplitude modulation so that beating against other phase modulated sidebands yields zero-crossing error signals around the optimal operation point of the interferometer.
3.2 Signal Extraction Ports
The light power coming out of the interferometer is detected at mainly three ports: the reflection port (REFL), pick-off port in the PRC (POP) and the anti-symmetric port (AS). REFL is the light coming back to the laser, intercepted by a Faraday isolator. POP is taken at the transmission of the PR2 to sample the light fields circulating in the PRC. The AS port is the transmission of the OMC.
The light power fluctuations detected by photo detectors (PDs) at each port are demodulated at various beat frequencies between the RF sidebands and the carrier. Out of many possible combinations of the signal ports, demodulation frequencies and demodulation phases (in-phase or quadrature-phase), we selected the signals shown in the first columns of Table 3 and Table 4 to be used for the feedback control. The choice was made by repeatedly computing the loop noise couplings, explained in section 5, with different combinations of the signal ports to find the best one.
Because the f3 sidebands do not resonate in any part of the interferometer, the demodulation of the REFL signal at the beat frequencies of f3 and either f1 or f2 yields robust error signals for the control of PRCL, SRCL and MICH (collectively called the central part). Since those “f3 signals” do not depend on the carrier, they have smaller couplings from CARM than the signals using the carrier. Also the f3 signals are stable during the lock acquisition, when the carrier rapidly changes its magnitude in the arm cavities.
Although the f3 signals have the advantages explained above, they can have much worse shot noises than the signals using the carrier. First of all, the modulation has to be strong enough to yield error signals with small shot noise. However it will waste a lot of input laser power unless some advanced modulation techniques are used [4]. At the REFL port, the amount of carrier light strongly depends on the losses inside the interferometer, which is not easily controllable. Since the carrier light is just a source of shot noise for the f3 signals, this gives rise to an uncertainty in the amount of shot noise. Therefore, we only plan to use the f3 signals during the lock acquisition of the interferometer, not in the observation mode.
Unlike the other DOFs, a scheme called DC readout [5] is used to obtain the DARM error signal. A small DC offset is applied to DARM to provide a local oscillator field for the DC readout. The relative phase between the local oscillator and the signal sidebands (homodyne angle) is set to 58∘ for BRSE and 45∘ for DRSE to optimize the quantum noise level.
4 Macroscopic Lengths and Modulation Frequencies
4.1 Constraints
The macroscopic lengths of the PRC, SRC and the MICH asymmetry along with the modulation frequencies of the RF sidebands have to be chosen to satisfy the resonant conditions of Figure 1. Also the length of the mode cleaner (MC), which is used to clean the beam profile of the input laser beam, has to be determined to transmit the RF sidebands through it. In addition, various practical constraints are imposed on the choice of those parameters.
The constraints on the available space is stringent in under ground experiments like LCGT, where the space is at a premium. In general we want to minimize the lengths of the recycling cavities and the MC. However, the recycling cavities have to accommodate the Z-shaped folding part and the 20 m long thermal radiation shields between BS and ITMs. Therefore, the minimum possible recycling cavity length is about 65 m.
Because a short MC has a larger free spectral range (FSR), a too short MC will severely limit the choice of RF sideband frequencies, which have to be integral multiples of the FSR. To strike a balance between the FSR and the tunnel cost, the desirable MC length is in the order of 30 m.
Another constraint is that the modulation frequencies have to be in the range of 10 MHz to 50ṀHz. If the frequency is too high, it is difficult to find a good PD with fast enough response and a reasonably large aperture. If it is too low, the laser noises are not filtered out enough by the pre-mode cleaner cavity.
4.2 SRCL Linear Range
There are many combinations of the macroscopic lengths and modulation frequencies which satisfy the above constraints. In order to determine the final parameter set to be used in the LCGT interferometer, we use the linear range of the SRCL error signal as the figure of merit.
The operation mode is switched from BRSE to DRSE by adding an offset to the SRCL error signal. The required detuning of the SRC is 3.5∘ in terms of one-way phase shift. Therefore the SRCL error signal has to have a large enough linear range to allow this offset. This linear range is roughly determined by the finesse of the coupled cavity formed by the PRC and SRC for the f1 sideband. Since the reflectivities of the PRM and the SRM are already determined by the optimization of the quantum noise shape, we are left with the Michelson reflectivity for the f1 sideband to change the finesse of the coupled cavity.
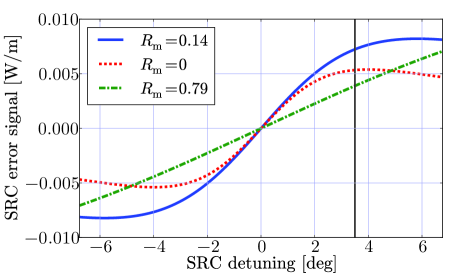
The Michelson reflectivity depends on the f1 frequency () and the Michelson asymmetry () as , where is the speed of light. Figure 3 shows the shape of SRCL error signals for three cases of . When is closer to the PRM reflectivity (0.9), the effective reflectivity of the power-recycled Michelson seen from the SRC becomes lower. Therefore, the finesse of the SRC gets smaller, resulting in a wider linear range. In the case of , the DRSE operation point (shown by the vertical line at 3.5∘) is almost at the turning point of the error signal. Therefore it is not usable as an error signal. For , the error signal is linear throughout the plot range, but the slope is smaller, meaning a poor shot noise. Therefore, after an extensive parameter search, we decided to use a parameter set with , which has a larger slope at the center while the signal is still not flat at 3.5∘.
The selected parameter set is shown in Table 2. The f3 frequency is chosen to transmit the MC and not resonant in any part of the interferometer including its higher order harmonics.
| f1 | 16.875 MHz | f2 | 45.0 MHz |
|---|---|---|---|
| f3 | 56.3 MHz | MC Length | 26.6 m |
| PRC Length | 66.6 m | SRC Length | 66.6 m |
| Michelson Asymmetry | 3.33 m | Michelson Reflectivity | 0.14 |
5 Loop Noise Couplings
5.1 Interferometer Model
In order to calculate the response and the quantum noises of the LCGT interferometer, an interferometer model was constructed with an optical simulation software called Optickle written by Matt Evans [6]. The model uses the parameters selected in the previous section. In order to simulate the imperfections of real optics, 1% asymmetries in the arm cavity finesse and the BS reflectivity are introduced. These asymmetries increase off-diagonal elements in the sensing matrices. They also create residual DC carrier light at the AS port even without the DARM offset, allowing us to set the homodyne angle to a desired value.
5.2 Control Loop Modeling
The sensing matrices computed by the interferometer model for the canonical DOFs are shown in Table 3 and Table 4. Because the off-diagonal elements in the first row of the matrices are non-zero, there are finite couplings from the auxiliary DOFs to the DARM error signal.
| DARM | CARM | MICH | PRCL | SRCL | |
|---|---|---|---|---|---|
| AS_DC | 1 | ||||
| REFL_f1I | 1 | ||||
| REFL_f1Q | 1 | 1.02 | 0.67 | ||
| POP_f2I | 4.3 | 1 | |||
| POP_f1I | 16.2 | 2.1 | 1 | ||
| DARM | CARM | MICH | PRCL | SRCL | |
|---|---|---|---|---|---|
| AS_DC | 1 | ||||
| REFL_f1I | 1 | ||||
| REFL_f1Q | 1 | 0.39 | 0.18 | ||
| POP_f2I | 4.3 | 1 | |||
| POP_f1I | 35 | 2.0 | 1 | ||
Sensing noises, most notably shot noise, are noise signals which do not correspond to the real mirror motions. The feedback system tries to cancel out these noises by unnecessarily moving the mirrors. This additional mirror motion is coupled to the DARM error signal through the off-diagonal elements of the sensing matrix. The noise coupling of this mechanism is called loop noise [7].
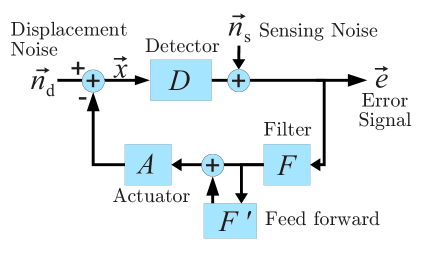
The loop noise couplings can be modeled using the block diagram shown in Figure 4. The detector matrix converts a vector of mirror displacements into a vector of error signals in the canonical DOFs. Then the sensing noise vector, , is added to the error signal vector. and are calculated by the Optickle model. The error signals are filtered by a feedback filter and fed back to the mirrors through the actuator matrix , which converts feedback signals in the canonical DOFs to the motion of each mirror. The displacement noises of the mirrors are represented by .
The DARM error signal is the first element of the error signal vector . In the absence of gravitational waves, is written as,
| (1) |
| (2) |
where is the identity matrix. The off-diagonal elements of are responsible for the loop noise couplings.
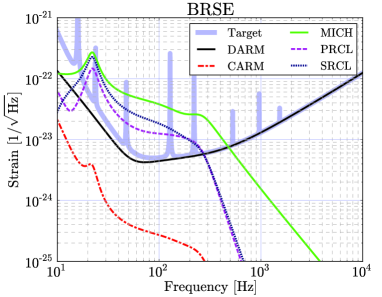
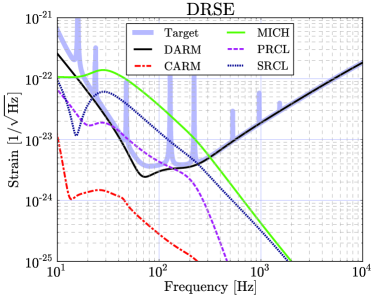
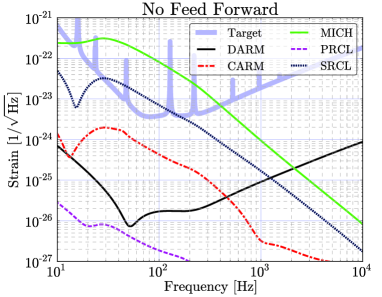
Figure 5 shows the loop noise couplings from the auxiliary DOFs to the DARM signal compared with the target sensitivity of LCGT. These noises are calculated by plugging in the shot noise of each signal port to of (1). In this calculation, we assumed simple shaped feedback filters with response around the unity gain frequencies (UGFs) to ensure the stability. The UGFs are 200 Hz for DARM, 10 kHz for CARM and 50 Hz for all the other DOFs. Clearly the shot noise couplings from the auxiliary DOFs are larger than the target noise level.
5.3 Feed forward
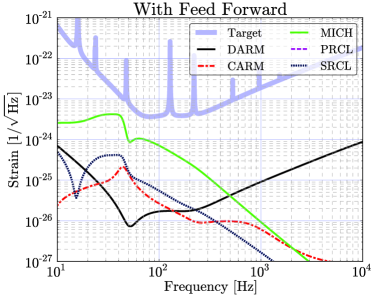
The loop noise coupling problem can be mitigated by adding a feed forward path after the feedback filter . The elements of are determined by measuring the transfer functions from the actuation of auxiliary DOFs to DARM error signal. The net effect of is to reduce the off-diagonal elements in the first row of .
The accuracy of the feed forward cancellation depends on the precision of the transfer function measurements. The feed forward gain is defined as the inverse of the error of the transfer function measurements. Thus a 1% error corresponds to a feed forward gain of 100. Since the optical gains of the interferometer varies by the alignment fluctuations, laser power variation and so on, the optimal feed forward filters also change over time. Adaptive optimization of is planed to be used in LCGT.
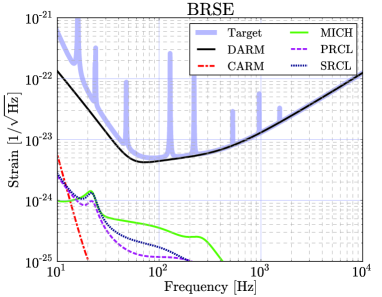
Figure 6 shows the quantum noise estimates when a feed forward of gain 100 is applied. It is a reasonable assumption, because the feed forward gain of more than 100 have achieved in the first generation interferometers. In this case, all the shot noise couplings from the auxiliary DOFs are well below the target noise level.
5.4 Photo Detector Noise
Another important sensing noise to be considered is the intrinsic noises of photo detectors. A PD always receives some offset signal, either in RF or DC depending on the type of PD. At some ports, these offset signals can be very large. In this case, the dynamic ranges of the PD becomes an issue.
Typically, a low-noise fast operational amplifier (op-amp) used for the current to voltage conversion of a PD has a dynamic range of about 200 dB according to the catalog specifications [8]. However, because of the slew rate limit, the actual dynamic range at RF is much smaller. Moreover, in order to minimize the non-linearity of the detector response, we want to use the op-amps at a much smaller signal level than the slew rate limit. Therefore, for the following analysis, we assume the dynamic range to be 160 dB for RF PDs and 190 dB for a DC PD.
Once the dynamic range is specified, the sensing noise, , of a PD, in terms of the equivalent signal light power on the PD, can be expressed as , where is the offset signal power for the PD. Then we can simply replace in (1) with to calculate the loop noise couplings for the PD noise.
Figure 7 shows the calculated PD noise couplings in the case of DRSE. The PD noises are large in the DRSE mode, especially for MICH. It is because the SRC detuning changes the relative phase of the f1 sidebands with the carrier so that they no longer form a pure phase modulation. The result is constant large RF signals on the PDs for the signals using the f1 sidebands. With the use of feed forward, the PD noises can be made below the target noise level. For BRSE (not shown in the figure), the PD noises are well below the target noise even without the feed forward.
5.5 Displacement noise requirements
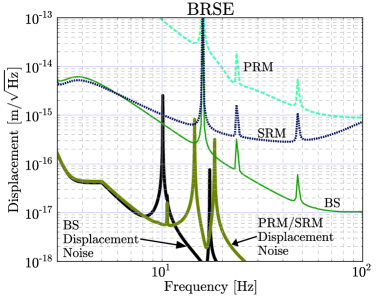
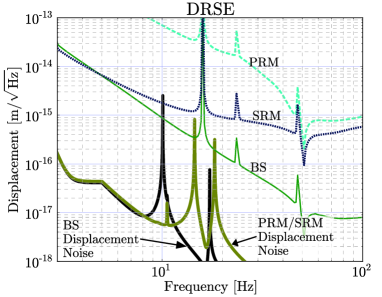
The displacement noise contributions to the DARM signal can be calculated from (1) by plugging in the displacement noise of each mirror to . Conversely, the requirements to the mirror displacement noise can be derived from (1) given a target noise level. This is especially important when feed forward is used, because feed forward is known to enhance the displacement noise couplings [7]. To avoid this, the feed forward signals are cut off at low-frequencies where displacement noises are dominant.
Figure 8 shows the maximum permitted displacement noise for each mirror requiring the contributions to the DARM signal be smaller than the target noise level. In this calculation, feed forward filters without the low-frequency cut off are assumed to show the worst case scenario. The displacement noise estimates shown in the figure are the sum of the seismic and thermal noises. The seismic noise estimates are based on the measured seismic data of very noisy day (during a heavy storm) at the Kamioka site. Except for at several peaks, the expected displacement noises are below the requirements in the observation band, i.e. above 10 Hz.
6 Lock acquisition
In order to ensure a high duty cycle during the observation and minimize the turnaround time during the commissioning, a quick and robust lock acquisition scheme is necessary. However, the relatively high finesse of the arm cavities and the complex optical configuration of LCGT make it difficult to achieve this. A high finesse cavity yields an useful error signal only in a small region around the lock point. Even this signal can be distorted by the slow transient response of the cavity if the mirrors are moving fast. Moreover, the high optical power stored in the arm cavities will kick the mirrors when the cavities are close to the resonances, preventing the interferometer from gently settling down to the locked state.
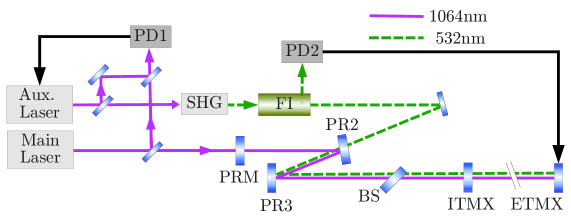
To assist the lock acquisition, we plan to use auxiliary lasers to pre-lock the arm cavities. This idea was first developed at the 40 m laboratory in Caltech [9]. Figure 9 shows a conceptual diagram of the auxiliary laser lock system for the X-arm. An auxiliary laser of 1064 nm wavelength is phase locked with the main laser. Then it is frequency doubled by a second harmonic generator (SHG) to 532 nm (green). The green laser beam is injected to the interferometer from the back of the PR2. The coatings on the PR2 and BS are designed to have a high transmissivity at 532 nm while the PR3 has a high reflectivity so that the beam is led only to the X-arm. The arm cavity mirrors also have dichroic coatings to form a low finesse (about 10) cavity for the green light. Because of the low finesse, it is easy to lock the arm cavity with the green laser. A similar system is also prepared for the Y-arm.
Once the arm cavities are locked by the green lasers, the frequency offset between the green and the main lasers is adjusted so that the arm cavities are not resonant to the carrier nor any RF sidebands. This ensures that the central part of the interferometer is not disturbed by the arm cavities.
Error signals used to control the central part during the lock acquisition should not depend on the carrier. Otherwise, the error signals may be strongly disturbed when the arm cavities are finally brought to the full resonances. Therefore, we will use the beat signals between the f3 sidebands and the other RF sidebands to obtain the error signals during the lock acquisition. From Optickle simulations, it was confirmed that these error signals are not noticeably affected by the arm cavity offset from a carrier resonance.
After the central part is locked, the arm cavity offset is slowly reduced by changing the offset frequency between the green and main lasers. During this process, a large amount of optical power builds up in the arm cavities, pushing the mirrors apart. This radiation pressure is compensated by slightly leaning the suspension towers and letting the gravity counter act the radiation pressure. Once the arm cavities reach the full resonance, the control signals are handed off to the observation mode signals: the DC readout for DARM and the RF signals using the carrier for the auxiliary DOFs.
7 Conclusion
The length sensing and control scheme for the LCGT interferometer was proposed. Optickle simulations show that the sensing noise couplings caused by the control loops can be mitigated by the use of feed forward. The displacement noise couplings to the gravitational wave signal are confirmed to be less than the target noise level, even with the enhancement by the feed forward. For quick and robust lock acquisition, auxiliary lasers will be used to pre-lock the arm cavities. The control scheme explained here will be a key component in the operation of the LCGT interferometer.
8 Acknowledgements
The authors would like to thank Matt Evans for the development of Optickle. We would also like to thank Stefan Ballmer and Rana Adhikari for helpful discussions. This work was supported by Grant-in-Aid for Scientific Research (A) 22244049.
References
References
- [1] Mizuno J, Strain K A, Nelson P G et al. 1993 Physics Letters A 175 273–276
- [2] Kuroda K and The LCGT Collaboration 2010 Classical and Quantum Gravity 27 084004
- [3] Somiya K an article to appear in this issue
- [4] Ohmae N 2010 Laser System for Second-Generation Gravitational-Wave Detectors Ph.D. thesis University of Tokyo
- [5] Ward R L, Adhikari R, Abbott B et al. 2008 Classical and Quantum Gravity 25 114030
- [6] Evans M 2007 Optickle LIGO Document T070260
- [7] Somiya K and Miyakawa O 2010 Applied Optics 49 4335–4342
- [8] For example, see the data sheet of AD829 available at http://www.analog.com/
- [9] Waldman S and Adhikari R 2007, personal communications