Failed Gamma-Ray Bursts: Thermal UV/Soft X-ray Emission Accompanied by Peculiar Afterglows
Abstract
We show that the photospheres of “failed” Gamma-Ray Bursts (GRBs), whose bulk Lorentz factors are much lower than 100, can be outside of internal shocks. The resulting radiation from the photospheres is thermal and bright in UV/Soft X-ray band. The photospheric emission lasts for about one thousand seconds with luminosity about several times erg/s. These events can be observed by current and future satellites. It is also shown that the afterglows of failed GRBs are peculiar at the early stage, which makes it possible to distinguish failed GRBs from ordinary GRBs and beaming-induced orphan afterglows.
1 Intronduction
Gamma-Ray Bursts (GRBs) are the most powerful explosion in the universe. The origin of prompt emission remains unresolved, owing to the fact that the prompt emission has a large explosion energy showing non-thermal spectrum with rapid time-variabilities.
It is widely accepted that the prompt emission is coming from a highly-relativistic flow, because it can reduce the optical depth of the flow which makes the radiation spectrum non-thermal (Rees & Mészáros 1994). In fact, in the internal shock scenario, which is one of the most promising scenarios, the relativistic shells collide with each other after the system becomes optically thin (e.g. Piran 1994 for a review). However, it was pointed out by Mészáros & Rees (2000) that even such a relativistic flow should have a photosphere inevitably and thermal radiation should be coming from there. Since then, there have been many theoretical (Daigne & Mochkovitch 2002; Pe′er et al. 2006; Pe′er 2008; Pe′er & Ryde 2011) and observational (Ghirlanda et al. 2003; Ryde 2004, 2005; Ryde et al. 2010; Guiriec et al. 2010; Ryde et al. 2011) studies on how the thermal component contributes to the prompt emission (or the precursor). Nowadays, the internal shock model with a photosphere is frequently discussed (e.g. Toma et al. 2011; Wu & Zhang 2011). In this picture, the radius of the photosphere, , is usually smaller than the radius where internal shocks are happening.
The above scenario is based on the assumption that the bulk Lorentz factor of the jet is as large as 100-1000. But what happens if the bulk Lorentz factor is not so high? Theoretically, it is natural to consider such a case, because it is very hard to realize such a clean, highly-relativistic flow. Especially, in case of long GRBs, some bursts are at least coming from the death of massive stars where a lot of baryons should be surrounding the central engine (MacFadyen & Woosley 1999; Proga et al. 2003; Nagataki et al. 2007; Nagataki 2009, 2010). Thus we can expect there are a lot of “failed GRBs” that have dirty, not so highly-relativistic flows in the universe (e.g. Dermer et al. 1999; Huang et al. 2002; Paragi et al. 2010; Xu et al. 2011). Recently, Bromberg et al. (2011a, 2011b) suggested the existence of a large population of failed GRBs if the jets failed to break out of the progenitor stars in collapsar model.
Qualitatively, becomes smaller if the bulk Lorentz factor of the flow is smaller, while increases with the decreasing of bulk Lorentz factor. Thus we can expect that the photosphere will become outside of the internal shock region for some lower Lorentz factors (see Fig. 1a). In such a case, -rays from the internal shocks cannot escape. Instead, softer thermal radiation from the photosphere followed by an afterglow will be seen.
We note that such a situation was considered in case of a “successful GRB” (Rees & Mészáros 2005; Lazzati et al. 2009; Mizuta et al. 2011; Nagakura et al. 2011; Ryde & Pe′er 2009; Ryde et al. 2010, 2011). In the photospheric model, it is considered that the photospheric emission itself is the origin of the prompt emission: its spectrum is modified to non-thermal due to the heating by relativistic electrons that are produced at the internal shocks inside the photosphere (Beloborodov 2010; Vurm et al. 2011). Thus the photospheric model can explain normal successful GRBs.
Here, in this study, we consider the case of “failed GRBs”. We show that the direct emission from the photosphere of a failed-GRB will be a UV/soft X-ray burst, followed by an afterglow with a peculiar spectrum at early stage. It is also shown that the afterglows of failed GRBs can be distinguished from ordinary GRB afterglows and beaming-induced orphan afterglows.


2 Photospheric emission
In this study, we consider axisymmetric jet and assume that the observer is on the axis in Fig. 1b. This is the extension of the 1-D formulation derived by Daigne & Mochkovitch (2002). For a baryon-rich ejecta in the stellar frame (i.e., burst source frame, and from now on all variables are defined in this frame), we assume the ejecta has been accelerated at a distance from the central engine. The mass flux of the ejecta is written as , where is the Lorentz factor of the ejecta and is the energy injection rate. The energy injection begins at =0, and stops at , i.e., the central engine activity lasts for a period of time .
The ejecta can be subdivided into a series of concentric layers, where each layer has been injected at at a certain injection time . Each ejecta layer becomes transparent when it has expanded to a distance at a specific time , where and . The photons emitted at will escape from the ejecta at a time at a distance . Here and are defined where a photon emitted at time t by the shell ejected at time escapes the outflow, i.e. reaches the first shell emitted at time . In other words, the optical depth from to is unity.
A geometric sketch illustrating the escape path of photons inside the ejecta is shown in Fig. 1b. A photon emitted at point E (at a distance and propagation angle ) will escape from the ejecta at point G, such that the optical depth from E to G is
| (1) |
where can be estimated as (Abramowicz et al. 1991; Daigne & Mochkovitch 2002; Pe′er 2008)
| (2) |
We define the photospheric radius at which is equal to unity. In light of Fig. 1b, we choose a cylindrical coordinate system (Pe′er 2008) with the central point being the stellar center, and the observer located along the +z-direction (defined by the direction of ). Photons are emitted at a perpendicular distance from the z-axis and a distance along the z-axis from point . The escape radius can be estimated from the triangle , i.e., ,
The integration for the optical depth can be conveniently rewritten in cylindrical coordinates as the following
| (3) |
where , and . The photospheric radius (), which depends on the propagation angle (), can be found readily by defining .
For a relativistic ejecta with Lorentz factor , the arrival time of photons emitted at the photosphere in the observer frame are delayed relative to that measured in the stellar frame
| (4) |
i.e., the observer time is a function of injection time and propagation angle. In this equation, we have neglected the effect of the acceleration radius () because it is much smaller than the photosphere radius.
The evolution of photospheric radius with propagation angle is shown in Fig. 2b. The parameters are taken as , erg/s and s. The solid curve shows its evolution at observer time s and the dashed curve at s. From this panel, we can see that in the observer frame, the photospheric radius decreases with propagation angle.

(a) The photospheric radius vs. the observer time. The solid curve is plot for photons propagating along the expansion direction of the ejecta (). The dashed curve corresponds to rad. (b) The photospheric radius vs. the photon propagation angle. The solid and dashed curves correspond to the observer time of 100 s and 2000 s respectively. (c) The photospheric temperature vs. observer time. The solid and dashed curves correspond to photon propagation angles of 0 and 0.1 rad, respectively. (d) The photospheric temperature vs. the photon propagation angle. The solid and dashed curves are for =100 s and 2000 s, respectively.
We also show the evolution of photospheric radius with observer time in Fig. 2a. The solid, dashed curves present the cases for and rad respectively. As is shown in this panel, the photospheric radius increases with time, and the duration of the photospheric emission is prolonged at larger propagation angle. The end points of the two curves indicate the observer time when the last layer of the ejecta becomes transparent.
According to the fireball model, the temperature of a layer at its photospheric radius is given by (Piran 1999)
| (5) |
where is the Doppler factor, is the saturation radius and is its blackbody temperature. In Fig. 2c and Fig. 2d, we show the evolution of with respect to the propagation angle and observer time respectively. From the two panels, we find that the photosperic temperature decreases with the propagation angle and time in the observer frame.
The evolution of the injection time with respect to the observer time and the propagation angle is shown in Fig. 3a and 3b, respectively. For the “standard” parameter set (, erg/s, =2000 s), is mildly smaller than for different , and is almost independent of for different . In Fig. 3c and Fig. 3d, we also show the evolution of the escaping radius with respect to the observer time and the propagation angle, respectively. The relations of and with respect to are similar to that of the photospheric radius .

As for a jet with half-opening angle rad, constant Lorentz factor , and energy injection from to s with energy injection rate per solid angle erg/s, we can estimate that cm and MeV for a fireball model (Piran 1999; 2000; Daigne & Mochkovitch 2002). If the line-of-sight is along the jet central axis, we can find that the photospheric radius is about cm when the last layer becomes transparent, the observer’s time can be calculated from Eq. 4, which is found to be about 2020 s and corresponds to the end point of the solid curve in Fig. 2a.
The observed luminosity of photospheric emission can be determined by integrating over the surface of the photosphere
| (6) |
where is the angle between the tangential direction of the photosphere surface and the line-of-sight when the propagation angle is . is the photospheric surface area from propagation angle to . The evolution of the photospheric luminosity with observer time is shown by the solid curve in Fig. 4. There is a break in the light curve at about 2020 s, which is attributed to the stop of energy injection by the central engine and when the last layer of the ejecta became transparent as the photons propagate along the line-of-sight. Afterwards, only photospheric emission at high latitude (large propagation angles) contributes to the observed luminosity. The photospheric emission ceases when the last layer with propagation angle become transparent, which is about 2050 s in the observer frame.

We can also define an effective temperature for the photosphere
| (7) |
This effective temperature is shown as a dashed curve in Fig. 4. We can find that the photospheric emission of a failed GRB is presented as a short soft X-ray burst and then becomes a UV burst which lasts for about several thousand seconds.
We also investigated the parameter effect on the photospheric emission, which are shown in Fig. 5 and Fig. 6. All the curves are derived when the last layer of ejecta along the line-of-sight became transparent , i.e., and . As is shown in Fig. 5a, the photospheric radii are decreasing with the increase of Lorentz factor for different sets of parameters. The solid curve corresponds to the standard parameters (erg/s, s), while the parameters for the dashed curve and the dotted curve are erg/s, s and erg/s, s, respectively. A lower energy injection rate and shorter injection time will decease the radius of the photosphere. Fig. 5b shows the evolution of the observer time with Lorentz factor. The parameters for each curve are the same as Fig. 5a. This time period can be interpreted as the duration of the photospheric emission. From this panel, we can find that the duration of photospheric emission decreases with an increase of Lorentz factor. Lower energy injection rate and shorter injection time will decease the duration of the photospheric emission.

In Fig. 6, we show the parameter effect on the photospheric luminosity and effective temprature. The parameters of each curve are the same as Fig. 5. From Fig. 6a, we can find that the luminosity of the photospheric emission are low in both high and low Lorentz factor. Lower energy injection rate results in lower luminosity. As is shown in Fig. 6b, the effective temperatures are increasing with the increase of Lorentz factor. Lower energy injection rate and shorter injection time will decease the radii of the photosphere and hence results in a higher effective temperature.

As for a jet with half-opening angle of about 0.1 rad, Lorentz factor , energy injection rate erg/s and injection time =200-2000s, from Fig. 5 and 6, we can conclude that the prompt emission for a failed GRB is thermal soft X-ray or UV photospheric emission, there will be no significant non-thermal gamma-ray emission. The photospheric luminosity is about erg/s and last for about one thousand seconds. Note that the photospheric luminosity is far lower than the energy injection power, most of of the energy is re-converted into the ejecta’s kinetic energy. From Fig. 5a, we find that the radius of the photosphere is about cm, which is larger then the prediction for the internal shock’s radius, i.e., cm (Mészáros 2006), where s here is the variability timescale of the prompt emission. The evolution of with respect to for =1 s, 0.33 s and 0.1 s are shown and marked in Fig. 5a correspondingly. This radius is consistent with Fig. 1a.
This thermal radiation will be in the UV or soft X-ray band. The lower band of Swift-XRT ( keV) may cover this energy range and it is sensitive enough to detect such a photospheric emission component (Gehrels et al. 2004). MAXI-SSC monitors all-sky in the energy range of keV and also has a chance to detect such events (Matsuoka et al. 1997). Future UV satellites may be also have the capability to detect these events, such as TAUVEX (wavelength range 120nm-350nm) (Safonova et al. 2008).
3 Afterglow emission
As the outflow expands outward, it will collide with the surrounding medium and afterglow will be produced. The dynamical evolution of a relativistic jet in interstellar medium has been studied by Huang et al. (1999). Their codes can be used in both ultra-relativistic and non-relativistic phases.
In our model, we consider a jet with the bulk Lorentz factor , the half-opening angle and the isotropic energy erg. The jet expands laterally at the comoving sound speed and collides with a medium whose number density is cm-3. We also assume typical values for some other parameters of the jet, i.e., the electron energy fraction , the magnetic energy fraction and the power-law index of the energy distribution function of electrons . Multiband afterglow emission is expected from synchrotron radiation of relativistic electrons. Using this exquisite model, we numerically calculated the afterglow light curves and spectra with line of sight parallel to the jet axis. We assume a redshift and a standard cosmology with , and with the Hubble constant of km s-1 Mpc-1.
Our results for the afterglow spectra of failed GRBs are shown in Fig. 7. The thick and thin solid curves are the spectra observed at s and s respectively. In this figure, we can find that the spectrum becomes softer with the elapse of the observational time. At the early stage ( s), the peak flux appears at about Hz, i.e., in the IR band. Both the peak flux and peak frequency decrease with time. At late time ( s), the peak flux is more than one magnitude less than that in the early stage. The peak frequency decreases to about Hz at late stage. It is in the radio band and more than three magnitudes less than the peak frequency at the early stage.
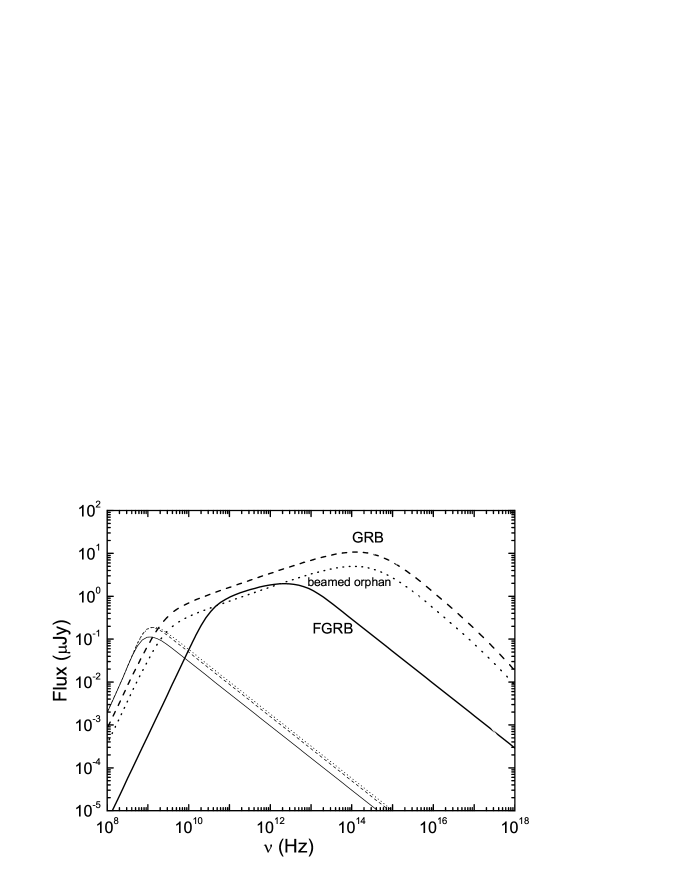
For comparison, we also show the afterglow spectra of an ordinary GRB in Fig. 7. Here we choose the same parameters as the failed GRB except for a much larger bulk Lorentz factor (). The dashed curves show the afterglow spectra of this GRB with observing angle (the line of sight is parallel to the jet axis). As is shown in Fig. 7, the spectra of the failed GRB and the ordinary GRB are similar at the late stage (thin solid and thin dashed curves) because their energies and Lorentz factors are both similar at this moment. But at early stage, they are very different (thick solid and thick dashed curves) due to their very different initial Lorentz factors and the corresponding minimum Lorentz factors of electrons (Sari et al. 1998). The peak frequency of the GRB afterglow is much larger than that of the failed GRB afterglow.
In Fig. 7, we also show the spectra of a beaming-induced orphan afterglow (afterglow from an ordinary highly collimated GRB outflow, but with the observing angle larger than the jet half-opening angle so that no prompt gamma-rays can be observed in the main burst phase, Rhoads 1997; Huang et al. 2002). Here we assume the same parameters as the ordinary GRB except . The early and late spectra of this orphan afterglow are shown in Fig. 7 with thick dotted curve and thin dotted curve. From this figure, we can find the spectra of beaming-induced orphan afterglow are similar to that of the ordinary GRB. Although it is hard to distinguish a beaming-induced orphan afterglow from a failed GRB afterglow through their afterglow light curves (Huang et al. 2002), they can be potentially distinguished from their spectra at the early stages. Their spectra of early afterglows are very different: the peak frequency of a failed GRB afterglow is far lower than that of a beaming-induced orphan afterglow. Another way to distinguish them is through their early light curves. Early afterglow of a beaming-induced orphan afterglow will show a rebrightening while failed GRB will not (Huang et al. 1999, 2002; Xu & Huang 2010).
4 Conclusion and Discussions
The analysis in this paper shows that the emission of ejecta with low Lorentz factors is very different from that expected from ejecta with high Lorentz factors. Prompt emission of a GRB is non-thermal and bright in the gamma-ray band. For a failed GRB, however, the emission originates from the photosphere with a thermal spectrum, and is bright in the UV or soft X-ray band instead of gamma-rays. This photospheric emission lasts for about a thousand seconds with a luminosity about several times erg/s.
Since the photospheric emission manifests as a UV or soft X-ray transient, it can be detected by some current and future satellites, such as Swift-XRT, MAXI-SSC and TAUVEX etc. On 2008 January 9, Swift-XRT discovered a peculiar X-ray transient 080109 in NGC 2770 (Berger & Soderberg 2008; Page et al. 2008). No gamma-ray emission was detected. This X-ray transient reached its peak at about and lasted for about s. Its spectrum can be fitted with an absorbed double blackbody model with temperatures about keV and keV respectively (Li 2008). This transient may be a candidate of photospheric emission from a failed GRB. Meanwhile, some unidentified X-ray transients have been detected by MAXI during its one-year monitoring (Nakajima et al. 2009; Suzuki et al. 2010). These transients generally showed an absorbed blackbody spectrum and lasted for tens of seconds. It is possible that some of them are photospheric emission from failed GRBs.
If we extend the injection time to about s and the jet half-opening to about 0.4 rad in our model, we find that the photospheric radius is about cm and the effective temperature is deceased to lower than 1 eV, i.e., there will be an optical burst. This kind of optical burst will last for about several thousand seconds with a luminosity about erg/s, which may be detected by the Hyper-Suprime Camera of the telescope in the future.
In this work, we have assumed that the prompt emission is thermal radiation coming from the photosphere where the optical depth is unity. Due to the low density of GRB jets, however, it has been pointed out that the last-scattering positions of the observed photons may not simply coincide with the photosphere, but instead possess a finite distribution around it (e.g. Pe′er et al. 2006; Pe′er 2008; Beloborodov 2010; Pe′er & Ryde 2011). This stochastic effect can lead to differentiation of the observed spectrum from a thermal one of purely photospheric origin. Such mechanism can work even in failed GRBs, and it is our future work to study how the spectrum will be reshaped using Monte-Carlo calculations. We are planning to investigate this effect in the context of failed GRBs as a next step of our study.
From the comparison of afterglow emissions from failed and ordinary GRBs, while we find it challenging to distinguish them at their late stage of evolution, their spectra at the early stage are profoundly different. We conclude that it is possible to identify failed GRBs by observing their afterglow emission in the early stage. The typical frequency at peak flux in the afterglow phase for failed GRBs is much lower than that for ordinary GRBs (or beaming-induced orphan GRBs). We can thus define a hardness ratio, for instance, as the flux contrast between Hz and Hz at an observed time of s, i.e., . If , then it is quite likely that the emission is coming from a failed GRB. If , then it would be more likely to come from an ordinary GRB afterglow or a beaming-induced orphan afterglow. In addition, at the early afterglow stage, a rebrightening phase will be present in the case of a beaming-induced orphan GRB, while it is not expected for ordinary or failed GRBs. Therefore, the afterglows of failed GRBs can be distinguished from both ordinary GRB afterglows and beaming-induced orphan afterglows through observations at the early stages.
References
- (1) Abramowicz, M. A., Novikov, I. D., & Paczyński, B. 1991, ApJ, 369, 175
- (2) Amati, L., et al. 2002, A&A, 390, 81
- (3) Berger, E., & Soderberg, A. M. 2008, GCN Circ. 7159
- (4) Beloborodov, A. M. 2010, MNRAS, 407, 1033
- (5) Bromberg, O., Nakar, E., & Piran, T. 2011a, ApJ, 739, L55
- (6) Bromberg, O., Nakar, E., Piran, T., & Sari, R. 2011b, arXiv:1111.2990
- (7) Daigne, F., & Mochkovitch, R. 2002, MNRAS, 336, 1271
- (8) Dermer, C. D., Böttcher, M., & Chiang, J. 1999, ApJ, 515, L49
- (9) Gehrels, N., et al. 2004, ApJ, 611, 1005
- (10) Ghirlanda, G., Celotti, A., & Ghisellini, G. 2003, A&A, 406, 879
- (11) Guiriec, S., et al. 2011, ApJ, 727, L33
- (12) Huang, Y. F., Dai, Z. G., & Lu, T. 1999, MNRAS, 309, 513
- (13) Huang, Y. F., Dai, Z. G., & Lu, T. 2002, MNRAS, 332, 735
- (14) Huang, Y. F., Gou, L. J., Dai, Z. G., & Lu, T. 2000, ApJ, 543, 90
- (15) Lazzati, D., Morsony, B.J., Begelman, M.C. 2009, ApJ, 700, L47
- (16) Li, L. X. 2008, MNRAS, 388, 603
- (17) Liang, E. W., et al. 2010, ApJ, 725, 2209
- (18) MacFadyen, A. I., & Woosley, S. E. 1999, ApJ, 524, 262
- (19) Matsuoka, M., et al. 1997, SPIE, 3114, 414
- (20) Mészáros, P. 2006, Rep. Prog. Phys., 69, 2259
- (21) Mészáros, P., Ramirez-Ruiz, E., Rees, M. J., & Zhang, B, 2002, ApJ, 578, 812
- (22) Mészáros, P., & Rees, M. J. 2000, ApJ, 530, 292
- (23) Mizuta, A., Nagataki, S. Aoi, J. 2011, ApJ, 732,26
- (24) Nagakura, H., Ito, H., Kiuchi, K., Yamada, S. ApJ, 731,80
- (25) Nagataki, S. 2009, ApJ, 704, 937
- (26) Nagataki, S. 2010, arXiv:1010.4964
- (27) Nagataki, S., et al. 2007, ApJ, 659, 512
- (28) Nakajima, M., et al. 2009, ATel 2321
- (29) Paczyński, B. 1990, ApJ, 363, 218
- (30) Page, K. L., et al. 2008, GCN Report 110.1
- (31) Paragi, Z., et al. 2010, Nature, 463, 516
- (32) Pe′er, A., Mészáros, P., & Rees, M. J. 2006, ApJ, 642, 995
- (33) Pe′er, A. 2008, ApJ, 682, 463
- (34) Pe′er, A., Ryde, F. 2011, ApJ, 732, 49
- (35) Piran, T., 1999, Physics Reports, 314, 575
- (36) Piran, T. 2004, Rev. Mod. Phys., 76, 1143
- (37) Proga, D., et al. 2003, ApJ, 599, L5
- (38) Rees, M. J., & Mészáros, P., 1994, ApJ, 430, L93
- (39) Rees, M. J., & Mészáros, P. 2005, ApJ, 628, 847
- (40) Rhoads, J. 1997, ApJ, 487, L1
- (41) Rybicki, G., & Lightman, A., 1979, Radiative Processes in Astrophysics (Wiley: New York)
- (42) Ryde, F. 2004, ApJ, 614, 827
- (43) Ryde, F. 2005, ApJ, 625, L95
- (44) Ryde, F., & Pe′er, A. 2009, ApJ, 702, 1211
- (45) Ryde, F., et al. 2010, ApJ, 709, L172
- (46) Ryde, F., et al. 2011, MNRAS, 415, 3693
- (47) Safonova, M., Sivaram, C., & Murthy, J. 2008, Astrophys. Space Sci., 318, 1
- (48) Sari, R., Piran, T., & Narayan, R. 1998, ApJ, 497, L17
- (49) Suzuki, M., et al. 2010, ATel 2415
- (50) Toma, K., Wu, X-F., & Mészáros, P. 2011, MNRAS, 415, 1663
- (51) Vurm, I., Beloborodov, A. & Poutanen, J. 2011, ApJ, 738, 77
- (52) Wu, X. F., & Zhang, B. 2011, to be submitted
- (53) Xu, M., & Huang, Y. F. 2010, A&A, 523, 5
- (54) Xu, M., Nagataki, S., & Huang, Y. F. 2011, ApJ, 735, 3