Time-Resolved Spectroscopy with SDSS
Abstract
We present a brief technical outline of the newly-formed ‘Detection of Spectroscopic Differences over Time’ (DS/DT) project. Our collaboration is using the individual exposures from the SDSS spectroscopic archive to produce a uniformly-processed set of time-resolved spectra. Here we provide an overview of the properties and processing of the available data, and highlight the wide range of time baselines present in the archive.
keywords:
techniques: spectroscopic, methods:data analysis, surveys, stars: variable: other1 Introduction
The Sloan Digital Sky Survey (SDSS) [York et al.(2000)] has been in operation for over a decade, and through three separate phases (SDSS I, II, and III) has accumulated an extensive archive of photometric and spectroscopic astrophysical observations. Here we describe a newly-formed data mining collaboration, the ‘Detection of Spectroscopic Differences over Time’ or DS/DT project, to search for variability in the SDSS spectra.
Though cadences and exposure times varied, the SDSS spectra were generally observed in three or more exposures, with exposure times of at least 900s. These individual exposures were combined to produce the final spectra released to the community.
Only a handful of groups have examined the sub-spectra for evidence of variability: [Hilton et al.(2010)] examined flaring in M-dwarfs, while [Mullally et al.(2009)] and [Badenes et al.(2009)] used radial velocity shifts to identify WD-WD binaries. Radial velocities have also been used by [Rebassa-Mansergas et al.(2010)] to identify binaries. With such an enormous diversity of objects, from QSOs and AGNs, to stars of all spectral types; there is a vast amount of time variable data which has never been evaluated.
The primary objective of our work is to produce a uniformly-processed archive of the individual sub-spectra for all SDSS spectroscopic observations. We are developing a data mining pipeline targeting some specific forms of variability (radial velocities, flaring, etc), and also serendipitous anomalous variability.
2 Data Processing
Our pipeline is an extension of the SDSS spectroscopic pipeline, spectro, used to produce seventh data release of the Sloan Digital Sky Survey [Abazajian et al.(2009)]. The original spectro pipe consists of three principle stages for (1) extraction and calibration of the raw spectroscopic traces, (2) stacking of the sub-spectra and stitching of the data from the red and blue cameras, and (3) object classification and redshift determination. We have written a modified 2nd stage to perform only the red/blue stitching for the individual exposures. Our new combine step generates individual per-object output files containing the full co-added spectra and their associated sub-spectra.
3 Time Baselines
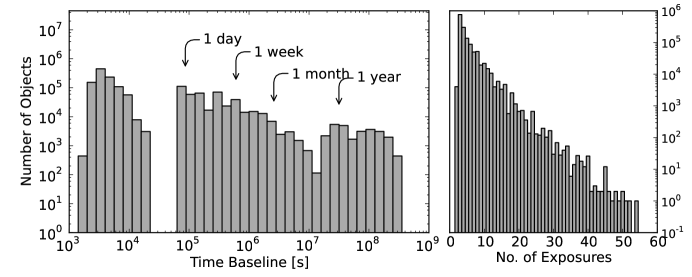
During the SDSS observing program, a wide range of time baselines were sampled. A given plate (640 fibers) was typically observed in three back-to-back 900s exposures, and in most cases the baseline is therefore 30 minutes. However, plates which were incomplete at the end of an observing session were continued on the following night, giving many plates a baseline of 12 hours. In some cases, previously-observed plates were later replugged for further observation, providing baselines of several weeks or sometimes much longer. Finally, some targets were observed on multiple plates, again providing baselines from weeks to months. Figure 1 shows histograms of the time baselines sampled (measured between the mid-points of the first and last available exposures) and the number of exposures. The sample includes the SDSS I and II spectra, and the SEGUE-II subset of the SDSS III spectra.
4 Summary
The DS/DT project is a newly-formed data mining project to explore time variability in the sub-spectra of the SDSS spectroscopic archive. We have developed a branch pipeline to process and collate the sub-spectra for each target into individual FITS files. It is our intention to make our full data set available. Those interested in testing and providing feedback on our preliminary data are invited to contact us.
References
- [Abazajian et al.(2009)] Abazajian, K. N., Adelman-McCarthy, J. K., Agüeros, M. A., et al. 2009, ApJS, 182, 543
- [Badenes et al.(2009)] Badenes, C., Mullally, F., Thompson, S. E., & Lupton, R. H. 2009, ApJ, 707, 971
- [Hilton et al.(2010)] Hilton, E. J., West, A. A., Hawley, S. L., & Kowalski, A. F. 2010, AJ, 140, 1402
- [Mullally et al.(2009)] Mullally, F., Badenes, C., Thompson, S. E., & Lupton, R. 2009, ApJL, 707, L51
- [Rebassa-Mansergas et al.(2010)] Rebassa-Mansergas, A., Gänsicke, B. T., et al. 2010, MNRAS, 402, 620
- [York et al.(2000)] York, D. G., Adelman, J., Anderson, J. E., Jr., et al. 2000, AJ, 120, 1579