Complete characterisation of the azimuthal and radial indices of light fields carrying orbital angular momentum
The direct determination of the complete transversal state of an electromagnetic field and accompanying mode indices is essential for the proper quantification of all light-matter interactions [1]. In particular light fields with cylindrical symmetry such as Laguerre-Gaussian beams can possess orbital angular momentum [2], central to a wide range of emergent applications in quantum cryptography [3], manipulation [4], astrophysics [5], microscopy [6] and electron beams [7]. A wide array of diffractive structures such as arrays of pinholes [5], triangular apertures [8, 9], slits [10, 11], and holograms [12, 13] have all recently been used to measure the azimuthal index of individual LG beams. However, all these approaches measure only one single degree of freedom of LG beams, neglecting the radial component or index and are thus not applicable for a priori unknown beams. Furthermore, it is unclear which is the optimal aperture and scheme needed to determine simultaneously the azimuthal and radial indices nor the extent with which such an aperture can tolerate deviations in beam parameters. Here, we demonstrate a powerful approach to simultaneously measure the radial and azimuthal indices ( and ) of both pure and mixed (superposed) LG light fields. We show that the shape of the diffracting element used to measure the mode indices is in fact of little importance and the crucial step is “training” any diffracting optical system and transforming the observed pattern into uncorrelated variables (principal components). Modest fluctuations in beam parameters such as waist size and alignment variations can be tolerated in our scheme. Importantly, beam superpositions can be experimentally decomposed delivering the intensity of each mode and their relative phases. Our results demonstrate the first complete characterisation of LG beams. The approach can be expanded to other families of beams such as Bessel or Hermite-Gaussian beams and represents a powerful method for characterising the optical multi-dimensional Hilbert space [3].
The last two decades have seen immense interest in light fields possessing orbital angular momentum. In particular the orthonormal basis set of Laguerre-Gaussian (LG) beams has been of interest in this regard (see supplement S1). An LG beam is typically characterised by two indices, namely the azimuthal index which denotes the number of cycles of phase change around the mode circumference and the radial index where +1 denotes the number of rings present within the light field (counting the central lobe). The azimuthal index leads to an orbital angular momentum of per photon. A suite of methods have emerged in the last few years that attempt to measure the azimuthal index of an LG light field many based on the far field pattern generated by a diffracting aperture. However, it is to be noted, common to all of these schemes is the fact that the incident light field is assumed to possess a radial index . In contrast, in virtually all experimental realisations of LG beams, we are presented with light fields that are appropriately described as superpositions of LG modes, each of the same index but of different index [14]. Thus it is crucial to include the influence of both mode indices on the diffraction pattern of any aperture or slit and further ascertain whether using any diffracting aperture we are able to determine both the azimuthal and radial indices simultaneously. Furthermore, open questions include the optimal aperture to use and red the robustness of the determination of mode indices in the presence of any mis-alignment. The generic approach we present here addresses all of these issues.
Our approach is to consider the intensity profile of an LG beam after diffraction from a mask or filter. This intensity profile is in general complicated and all the methods presented here are composed of a training or calibration step in which the response of the optical diffracting system is measured for every single LG beam considered. The second step corresponds to the actual identification or measurement of an unknown LG beam delivering simultaneously its radial and azimuthal indices. The LG beams are created using a spatial light modulator (SLM) that is wavefront corrected using the optical eigenmode (OEi) technique (see Supplement S2 and S3).
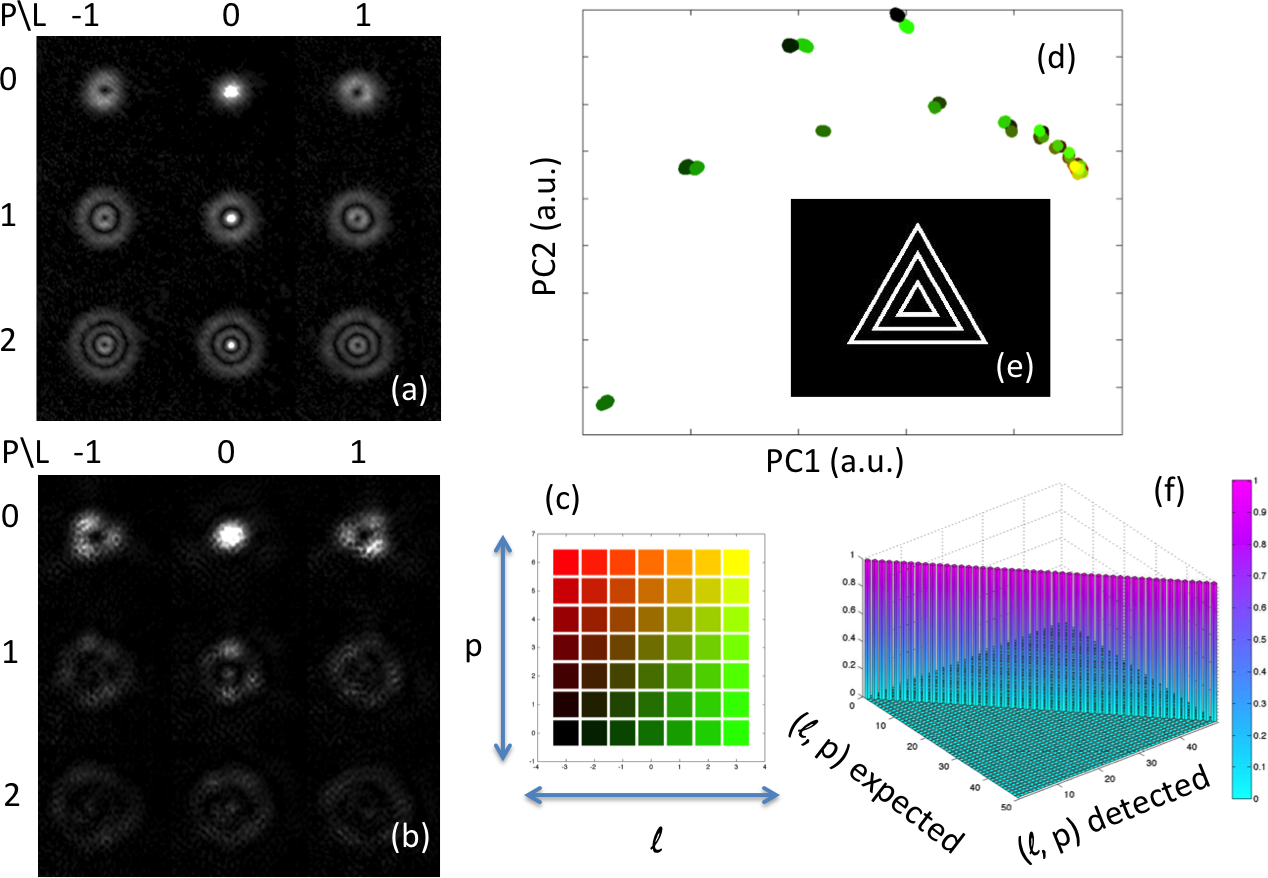
To illustrate our generic approach, we begin with a discussion of the far-field diffraction pattern of a general LG beam from an aperture composed of three concentric triangular slits. This is an extension of the single triangular aperture already considered, which is presently one of the more powerful techniques for determining the azimuthal index [8, 9] by simply counting the number of lobes in the far-field diffraction image. Superposing multiple such apertures might appear, at first glance, a method to determine both the radial and azimuthal indices of an incident field. Indeed, the choice of three concentric apertures aims to probe the radial index of LG beams with a commensurable beam waist. From figure 1b (and model presented in supplement S1) we deduce that the diffraction pattern from the triple triangular slit aperture does not offer any simple way to determine the and beam parameters. However, we remark that regardless of the radial index, the pattern orientation does depend on the sign of the azimuthal index. Although, it cannot be excluded that there exists a specifically designed mask that would deliver a simple rule for the detection of both and , this is not the case for the triple triangular slit aperture.
Importantly, the deduction of a complicated and retrieval rule can be replaced considering face-recognition algorithm readily employed in biometric identification. Here, we choose to use the principal component analysis (PCA) approach to determine the largest variations between the different far-field diffraction patterns from our aperture. The first step of the procedure corresponds to creating a database of all the possible beams that need to be detected. After subtraction of the common mean intensity, we calculate the covariance matrix of these intensity patterns. Its eigenvector with the largest eigenvalue is termed the first “eigenface” corresponding to the largest variability of the LG beam training set. In the same way, one can introduce the second “eigenface” as the image corresponding to the second largest eigenvalue of the covariance matrix. As can be seen from figure 1d, projecting the measured beams onto these “eigenfaces” delivers the first and subsequent principal component representation of the measure. We remark that in this representation the LG beams having the same and form very tight clusters. Finally, representing the diffraction pattern of an unknown beam in the same way, one can use a classification algorithm to determine the membership of beams with unknown mode indices. For simplicity, we chose the nearest neighbour measure to classify [15] but other methods such as the Mahalanobis distance [16] may also be used. Figure 1f shows the classification results displaying a 100% efficiency i.e. all unknown beams have been correctly identified.
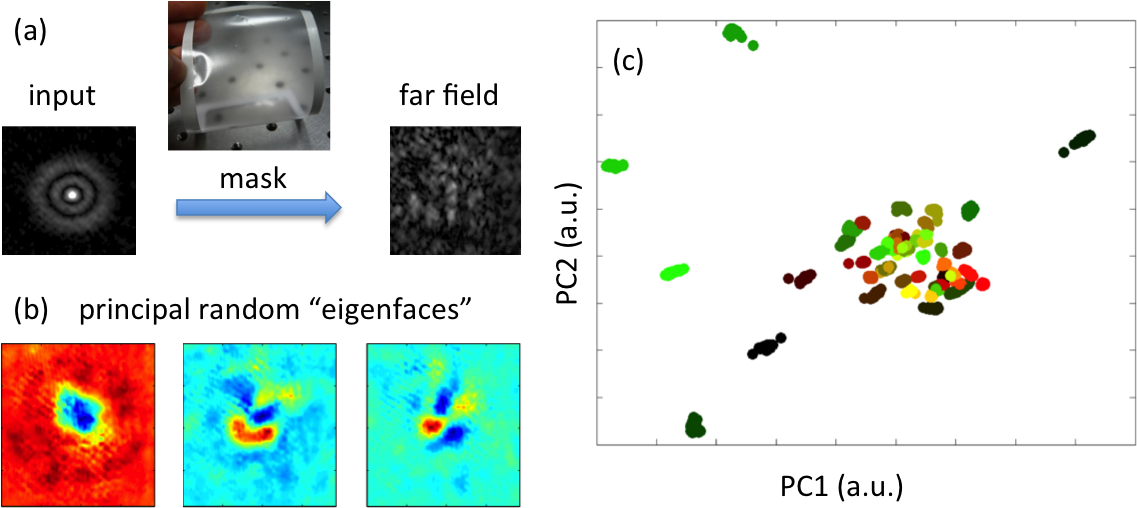
It is straight forward to deduce the radial index of an LG beam from its intensity profile by simply counting the number of rings in the beam profile. Unfortunately, the complete characterisation of LG beams is more difficult when it has a non zero azimuthal index and thus possesses a topological vortex. Theoretically, the intensity profile of a beam with azimuthal index is identical to the case. This makes it impossible to deduce the azimuthal index from the intensity of the beam. The triangular aperture breaks this symmetry and any mask that is not inversion symmetric would be able to distinguish between the two different signs of . More generally, random mask or aperture can be used to break this symmetry and its diffraction pattern can be used to detect simultaneously both beam indices. Figure 2a shows that the diffraction patterns do not present any prominent features at all and that any distinct LG beam results in a different diffraction pattern of similar overall form. Consequently, the variations, in the plane of the first two principal components, are more evenly distributed not privileging any specific radial index as is the case for the triple triangular slit aperture. This is due to the uniformity of the random mask over which the beam extends for different radial indices. Furthermore, it can be noted that the use of the random mask presents an experimental benefit as all diffraction patterns have similar peak intensity enabling the intensity acquisition with similar exposure durations. Using the random mask we achieve, as indeed for the the triple triangular slit aperture, 100% classification efficiency while eliminating the need to match beam waist and radial index to the size of the triangles used.
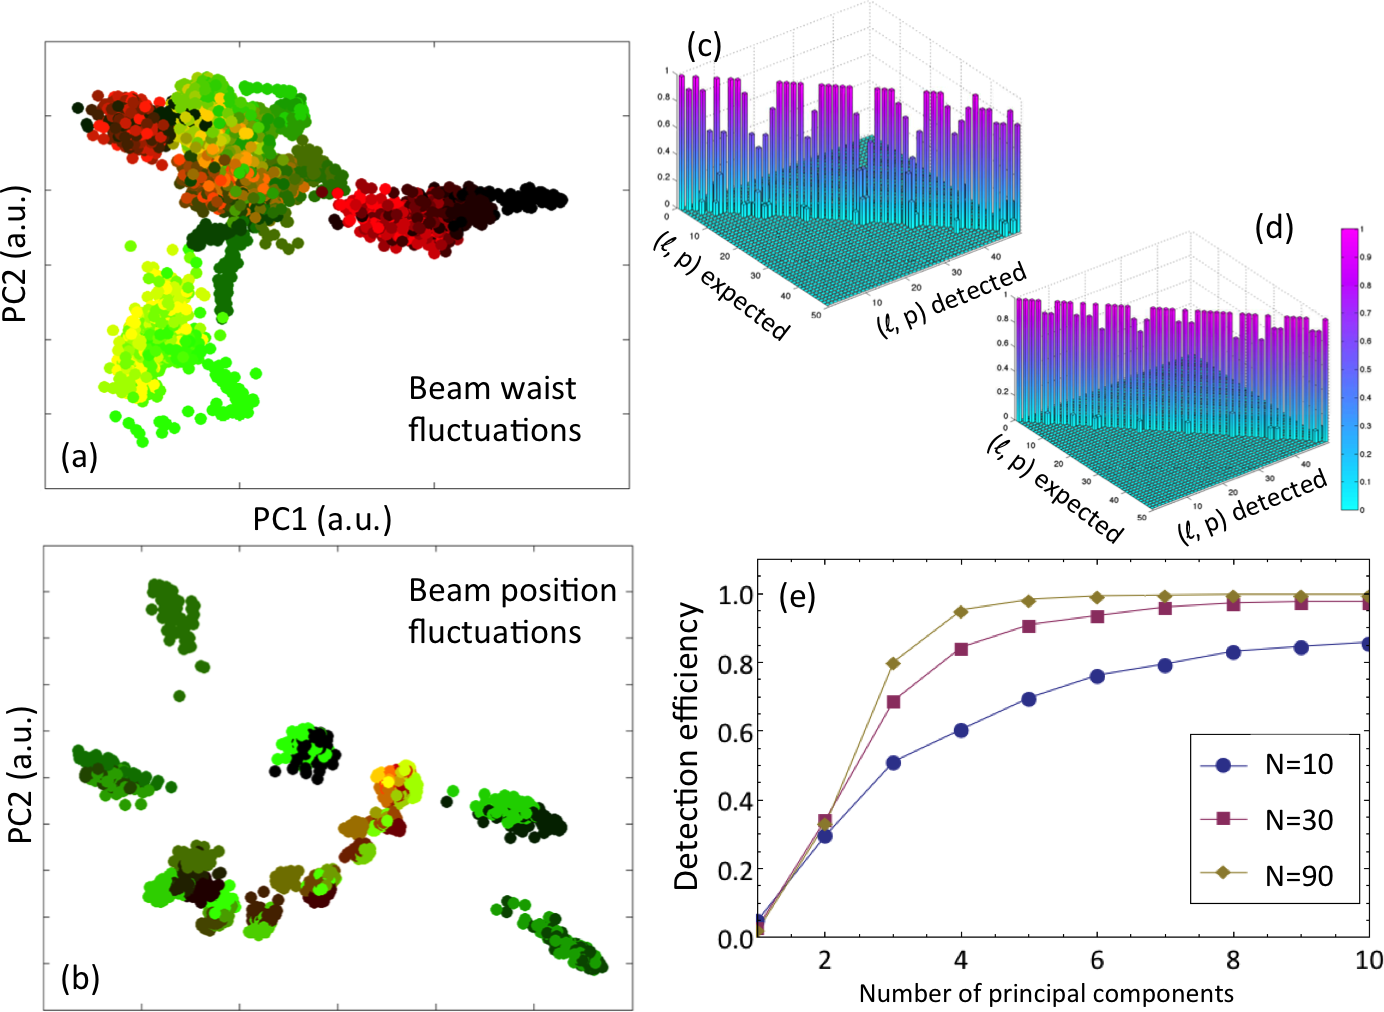
The fundamental question of the interdependence between the radial index, beam alignment and the beam waist is also interesting. Importantly, the azimuthal index has only a significance in relationship with the beam axis position and direction while the radial index with the beam waist parameter. We therefore investigate the influence of the beam waist fluctuation and beam mis-alignment on the classification ability of our scheme. Using the PCA detection method, outlined above, it is possible to study the effect of the variation of these parameters by controllably changing the amplitude profile of the LG beam generating SLM [17]. Figure 3 shows the results when considering the effect of these parameter fluctuations. The first effect is a clear widening of the scattering cluster of each given beam parameter. This is understandable as beam parameter fluctuations naturally induce a certain variability of the intensity profile. Nevertheless, the correct detection can still be achieved provided that either a larger training set is considered and/or a larger dimensionality of the data is allowed by taking more principal components into account. This last point is illustrated in figure 3e where the detection efficiency, defined by the trace of the confusion matrix normalised to the total number of unknown beams considered, is evaluated as a function of the number principal components.
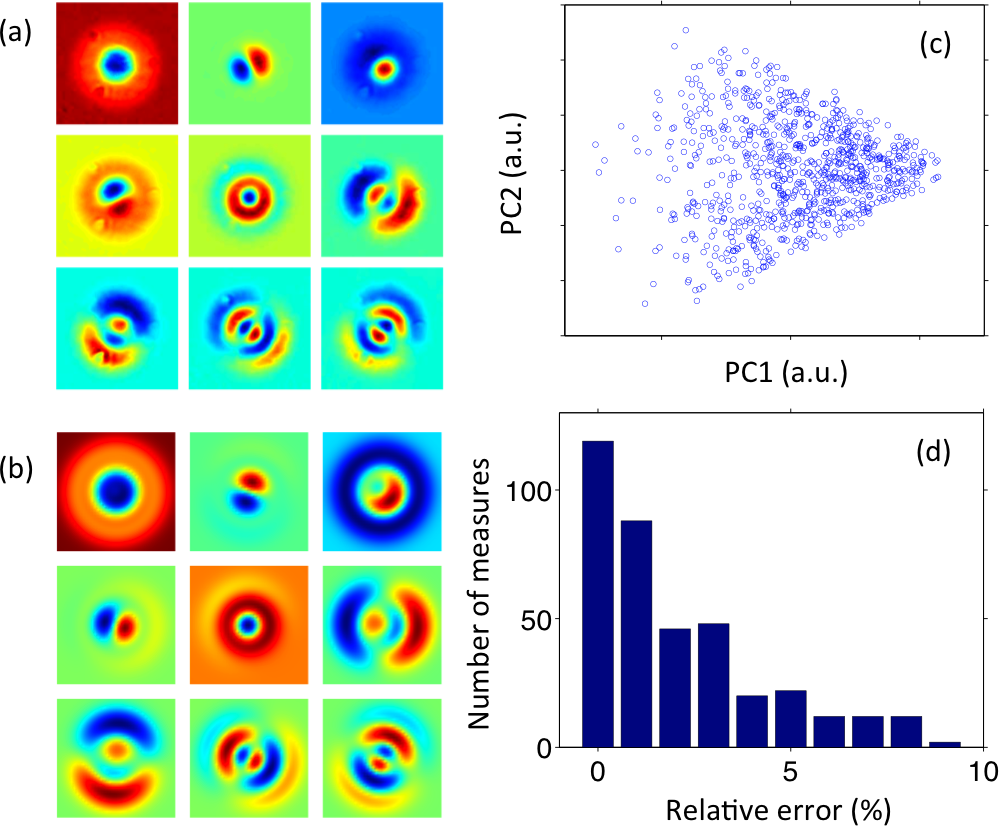
In quantum optics, entanglement requires an analysis of superpositions of states. Such superpositions may also occur in the classical domain, for example when considering light fields with fractional azimuthal index [18]. It is therefore interesting to extend our approach to the more general case of a superposition of multiple LG beams having different relative amplitudes and phases [19]. To that end, we trained the PCA eigenface algorithm on a set of 900 random complex superpositions (keeping the total intensity constant) of four LG beams. A startling observation is that 97% of the whole training-set’s variability can be accounted for by only the first nine principal components (fig. 4a,b). Indeed, the superposition is described by four complex numbers leading to four real amplitudes and three relative phases. The non-linear relationship between these degrees of freedom and the far-field diffraction pattern leads to the nine linear degrees of freedom observed experimentally (fig. 4a) and numerically (fig. 4b). Further, the projections onto these first principal components forms a dense cloud showing a non-normal distribution due to the constant intensity constraint (fig. 4c). Finally, we can identify the amplitude distribution of an unknown beam by using nearest neighbour classification. Experimentally, the best results were achieved when averaging over the six closest neighbours (see error histogram fig. 4d). The relative phase between the constituent beams can be retrieved by using an optical eigenmode [20, 21] GS algorithm [22] (for more details see supplement S4).
In this letter, we have presented a straight forward approach to determine both the radial and azimuthal indices of LG beams by measuring their far-field diffraction pattern from random matrices. This method is robust and can even tolerate a certain degree of beam mis-alignment and beam waist variations. Additionally, our method is able to measure the amplitudes of the different LG components in a superposition of LG beams. Whilst we concentrate here on the LG family of optical beams, the approach we present is generic and can be readily applied to the detection of other family of beams such as Hermite-Gaussian or Bessel beams. Finally, with suitable training, one could envisage the use of this approach to detect low order aberrations that can be described by the family of Zernike polynomials. The mode determination method may be applied beyond the field of electromagnetic waves to sound and matter waves, for example, electron beams. In future work, we will expand the method to the single photon case, enabling the encoding, decoding and manipulation of the radial and azimuthal degrees of freedom of single quanta of light.
Methods
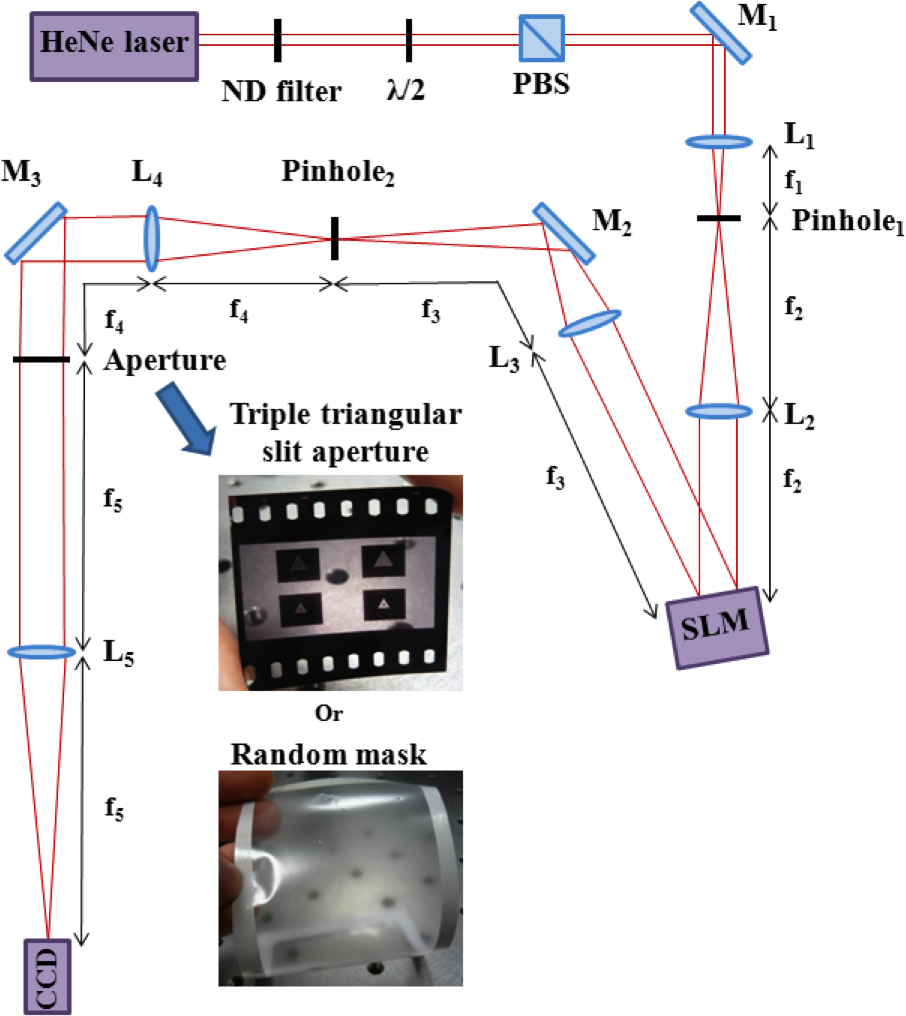
A Helium Neon laser source ( = 633 nm, = 5 mW) was used. The laser beam was additionally sent through a 50 µm pinhole in order to obtain a beam featuring a homogeneous Gaussian intensity profile. The laser beam was then subsequently expanded with a telescope ( and ) in order to slightly overfill the chip of a spatial light modulator (SLM) which was a Holoeye LC-R 2500. The SLM operated in the standard first-order configuration and was used to imprint the vortex phase on the incident beam where the LG beam was created in the far-field of the SLM. In order to filter the first order beam, carrying the vortex, from the unmodulated zero-order beam, a pinhole aperture was located in the back focal plane of lens . Lens was then used to image the & mode beam on the triple triangular slit aperture, with an aperture’s size roughly matching the beam waist. A static triple triangular slit aperture imprinted onto photographic film was used and measurements were performed also using a random transparent medium aperture. Finally, lens served to create the far-field diffraction pattern in the respective back focal plane where a CCD camera (Basler pi640-210gm, pixel size: 7.4 µm 7.4 µm) was used, in order to record and save the images of the far-field diffraction patterns onto the hard drive of a computer (see supplement for experimental setup figure). To record distinct images, an adjustment between both the size and the thickness of the aperture to the size of the beam waist of the LG beam should be done. Since the diameter of the bright ring depends on the azimuthal index, , and the number of nodal rings to the radial index, , respectively. The diffraction patterns are blurred and deformed if the size of the aperture is not commensurate with the diameter of the bright ring. Moreover, the pattern intensity is larger for a large thickness while the pattern gets more distinct for a smaller thickness [23]. We have adjusted the CCD camera exposure time in order to best highlight the pattern morphology for each recorded pattern.
References and Notes
- [1] A. Alexandrescu, D. Cojoc, and E. Fabrizio, “Mechanism of Angular Momentum Exchange between Molecules and Laguerre-Gaussian Beams,” Phys Rev Lett, vol. 96, no. 24, p. 243001, 2006.
- [2] L. Allen, M. Beijersbergen, R. Spreeuw, and J. Woerdman, “Orbital angular momentum of light and the transformation of Laguerre-Gaussian laser modes,” Phys Rev A, vol. 45, no. 11, pp. 8185–8189, 1992.
- [3] G. Molina-Terriza, J. Torres, and L. Torner, “Management of the Angular Momentum of Light: Preparation of Photons in Multidimensional Vector States of Angular Momentum,” Phys Rev Lett, vol. 88, no. 1, p. 013601, 2001.
- [4] D. G. Grier, “A revolution in optical manipulation,” Nature, vol. 424, no. 6950, pp. 810–816, 2003.
- [5] G. C. G. Berkhout and M. W. Beijersbergen, “Method for Probing the Orbital Angular Momentum of Optical Vortices in Electromagnetic Waves from Astronomical Objects,” Phys Rev Lett, vol. 101, no. 10, p. 100801, 2008.
- [6] S. W. Hell, R. Schmidt, and A. Egner, “Diffraction-unlimited three-dimensional optical nanoscopy with opposing lenses,” Nat Photon, vol. 3, no. 7, pp. 381–387, 2009.
- [7] J. Verbeeck, H. Tian, and P. Schattschneider, “Production and application of electron vortex beams,” Nature, vol. 467, no. 7313, pp. 301–304, 2010.
- [8] A. Mourka, J. Baumgartl, C. Shanor, K. Dholakia, and E. M. Wright, “Visualization of the birth of an optical vortex using diffraction from a triangular aperture,” Opt Express, vol. 19, no. 7, p. 5760, 2011.
- [9] J. M. Hickmann, E. J. S. Fonseca, W. C. Soares, and S. Chavez-Cerda, “Unveiling a Truncated Optical Lattice Associated with a Triangular Aperture Using Light’s Orbital Angular Momentum,” Phys Rev Lett, vol. 105, no. 5, p. 053904, 2010.
- [10] Q. S. Ferreira, A. J. Jesus-Silva, E. J. S. Fonseca, and J. M. Hickmann, “Fraunhofer diffraction of light with orbital angular momentum by a slit,” Opt Lett, vol. 36, no. 16, p. 3106, 2011.
- [11] H. Sztul and R. R. Alfano, “Double-slit interference with Laguerre-Gaussian beams,” Opt Lett, vol. 31, no. 7, pp. 999–1001, 2006.
- [12] G. C. G. Berkhout, M. P. J. Lavery, J. Courtial, M. Beijersbergen, and M. J. Padgett, “Efficient sorting of orbital angular momentum states of light,” Phys Rev Lett, vol. 105, no. 15, p. 153601, 2010.
- [13] G. C. G. Berkhout, M. P. J. Lavery, M. J. Padgett, and M. W. Beijersbergen, “Measuring orbital angular momentum superpositions of light by mode transformation,” Opt Lett, vol. 36, no. 10, pp. 1863–1865, 2011.
- [14] Y. Ohtake, T. Ando, N. Fukuchi, N. Matsumoto, H. Ito, and T. Hara, “Universal generation of higher-order multiringed Laguerre-Gaussian beams by using a spatial light modulator,” Opt Lett, vol. 32, no. 11, pp. 1411–1413, 2007.
- [15] T. Cover and P. Hart, “Nearest neighbor pattern classification,” IEEE Trans. Inform. Theory, vol. 13, pp. 21–27, Jan. 1967.
- [16] B. Draper, K. Baek, M. Bartlett, and J. Beveridge, “Recognizing faces with PCA and ICA,” Comput Vis Image Und, vol. 91, pp. 115–137, 2003.
- [17] M. P. J. Lavery, G. C. G. Berkhout, J. Courtial, and M. J. Padgett, “Measurement of the light orbital angular momentum spectrum using an optical geometric transformation,” J. Opt., vol. 13, no. 6, p. 064006, 2011.
- [18] J. B. Götte, K. O’Holleran, D. Preece, F. Flossmann, S. Franke-Arnold, S. M. Barnett, and M. J. Padgett, “Light beams with fractional orbital angular momentum and their vortex structure,” Opt Express, vol. 16, no. 2, p. 993, 2008.
- [19] A. Vaziri, G. Weihs, and A. Zeilinger, “Superpositions of the orbital angular momentum for applications in quantum experiments,” J. Opt. B: Quantum Semiclass. Opt., vol. 4, pp. S47–S51, 2002.
- [20] A. C. De Luca, S. Kosmeier, K. Dholakia, and M. Mazilu, “Optical eigenmode imaging,” Phys Rev A, vol. 84, no. 2, p. 021803(R), 2011.
- [21] M. Mazilu, J. Baumgartl, S. Kosmeier, and K. Dholakia, “Optical Eigenmodes; exploiting the quadratic nature of the energy flux and of scattering interactions,” Opt Express, vol. 19, no. 2, p. 933, 2011.
- [22] R. Gerchberg and W. Saxton, “A practical algorithm for the determination of the phase from image and diffraction plane pictures,” Optik, vol. 35, no. 2, pp. 237–237246, 1972.
- [23] L. Yongxin, T. Hua, P. Jixiong, and L. Baida, “Detecting the topological charge of vortex beams using an annular triangle aperture,” Optics and Laser Technology, vol. 43, no. 7, pp. 1233–1236, 2011.
- [24] G. Spalding, J. Courtial, and R. D. Leonardo, “Holographic Optical Trapping,” in Structured Light and its Applications: An Introduction to Phase-Structured Beams and Nanoscale Optical Forces, Elsevier, Academic Press, 2008.
Acknowledgements
We acknowledge helpful critical discussions with Prof. E. M. Wright. We thank the UK Engineering and Physical Sciences Research Council for funding. Kishan Dholakia is a Royal Society-Wolfson Merit Award Holder.
Author Contributions
K.D. and M.M. developed and planned the project. M. M. performed the bulk of the analysis, along with optical modelling and algorithm design. A. M. and T. V. performed the experimental work. All authors contributed to the writing of the manuscript.
Supplementary information
S1 Far field diffraction from triangular apertures of Laguerre-Gaussian beams
In the focal plane (defined as ), Laguerre-Gaussian beams are described by the scalar field
| (1) | |||||
where , and are Cartesian coordinates with the direction of propagation, corresponds to the Gaussian beam waist, to the radial index and to the sign of the azimuthal index . Further, are the generalised Laguerre polynomials. These beams are characterised by the total phase change, equal to , acquired when integrating the local phase change on a closed loop around the optical axis (). Additionally, the radial index determines the number of radial nodes to be determined by the roots of the Laguerre polynomial.
The Laguerre-Gaussian beams, as defined by (1), form a complete orthonormal basis over the transverse -plane
| (2) |
where is the Kronecker delta function. Any transversal beam profile can therefore be decomposed into a sum of Laguerre-Gaussian beams. In general, this sum includes terms having nonzero azimuthal and radial index. Only very specific beam symmetries and profiles allow for a decomposition into beams that involve only Laguerre-Gaussian modes with . This is the main motivation into the study of the detection of general Laguerre-Gaussian beams using the triple triangular slit aperture.
In general, a paraxial optical system is defined by the ABCD matrix describing the changes in beam profile and phase front curvature as the beam propagates through the system. This ABCD matrix defines the propagation through the generalized Huygens-Fresnel integral of the form:
| (3) | |||||
where and are respectively the fields in the initial and final transverse planes. The coefficients A, B, C and D are obtained through the matrix product of all associated matrices of the optical elements involved.
After the spatial light modulator, we propagate through a single lens to form the far field in its focal plane. The associated ABCD matrix is given by
| (4) |
Here, we remark that the Huygens-Fresnel integral (3) simplifies to a 2D Fourier transform for this specific ABCD matrix. Finally, the correct diffraction pattern is achieved by setting where corresponds to the transmission function which is only transmissive in the domains that the triangular slit is transparent.
For the numerical implementation of the far-field diffraction pattern, we used the above mentioned Fourier transform property. The scaler field of each Laguerre-Gaussien beam is discretised on a square grid and apertured by the triple triangular slit mask. The choice of the mask is based on the ability of the single triangular aperture to distinguish between different azimuthal indices. Additionally, we need to probe with the same mask the number of radial nodes present in the general Laguerre-Gaussian profile. Figure 5 shows an example Laguerre-Gaussian beam, the triple triangular slit and the associated far field diffraction pattern.

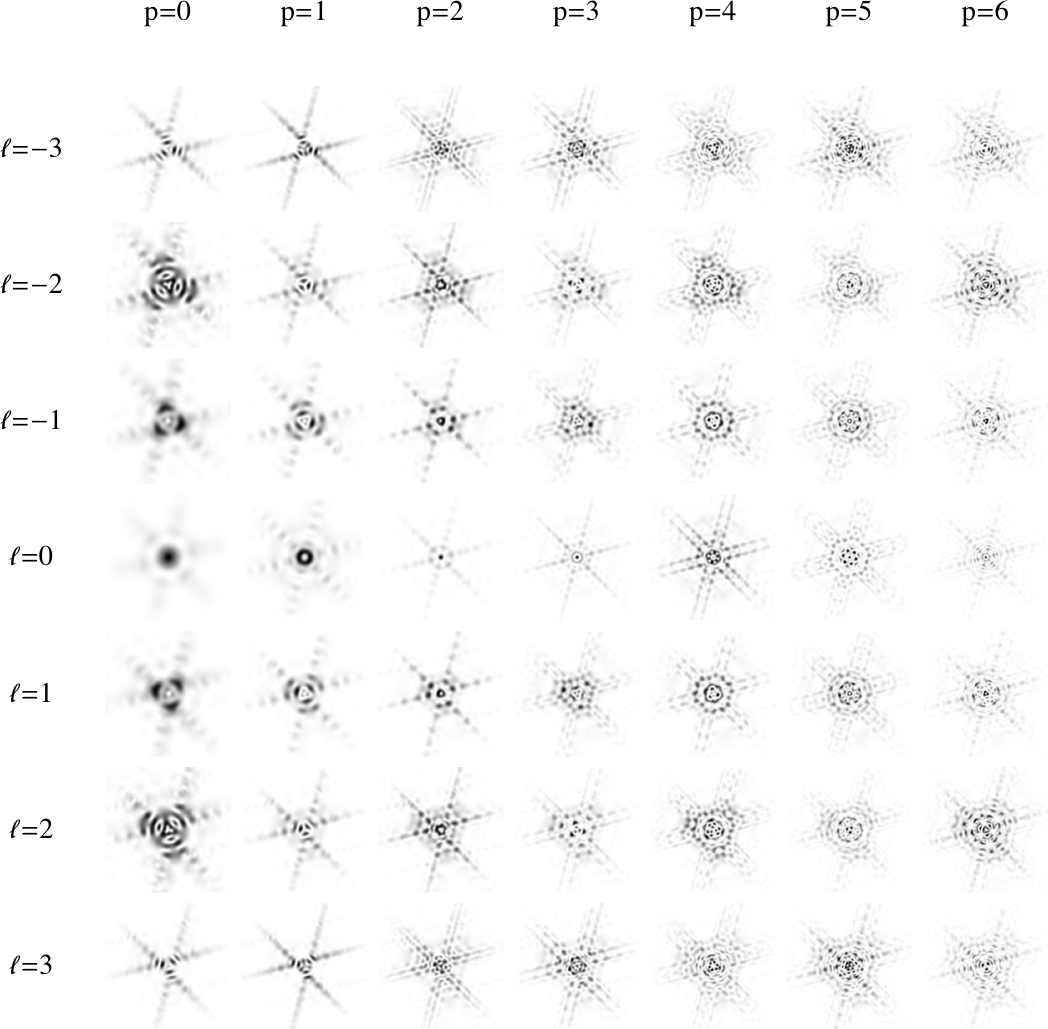
In Fig. 7 we can observe the diffraction patterns of different beams. In general, these patterns show a complex interference interaction between the waist of the beam, the size and width of the triangular slit apertures, the number of triangular slit apertures and the azimuthal and radial indices of the Laguerre-Gaussian beams.
S2 Optical eigenmode decomposition
The optical eigenmode decomposition is based on the definition of the total intensity measured in a given region of interest (ROI). Here we consider a superposition of LG beams described by with . The total intensity, , incident in the region of interest is given by
| (5) |
where . Matrix can be decomposed into a set of eigenvectors delivering an orthonormal set of optical eigenmodes defined as:
| (6) |
with and where is an eigenvalue and the associated eigenvector.
S3 Wavefront correction using optical eigenmodes
To mitigate the effect of optical aberrations inherent in any optical set-up, we employ an eigenmode wavefront correction algorithm based on equations (5-6); however, adapted for an experimental setting. We measure the intensity operator describing the linear transfer between the SLM plane and the imaging plane by interfering a reference beam () with a set of probe beams . The progress of the algorithm is exemplified graphically in Fig. 8a and b for the representative probe beams 1, 9, 25, 49, and 81. Note that an accurate superposition of the reference and a probe beam can be obtained efficiently by designating half of the SLM pixels to each beam [24]. As depicted in Figure 8c, the phase between the two beams is varied in four steps of and the complex field is retrieved using the equations:
| (7) |
where the term corresponds to intensity measured at the detector in the presence of field . Figure 8c shows the four intensity images used in the calculation of probe step 9, together with the complex image plane field calculated from the four intensity images using equation (6). The procedure can be seen as a phase sensitive lock-in technique where the reference beam corresponds to a reference signal with respect to which the phase and amplitude of is measured. Using these measures we can define the intensity operator . Its principal eigenvector defines the optical eigenmode that delivers the largest intensity on the detector whilst maintaining the total power in the system. The phase only part of the SLM mask implementing this eigenmode delivers the wavefront correction mask (see [21] for a discussion on the number of probes used).
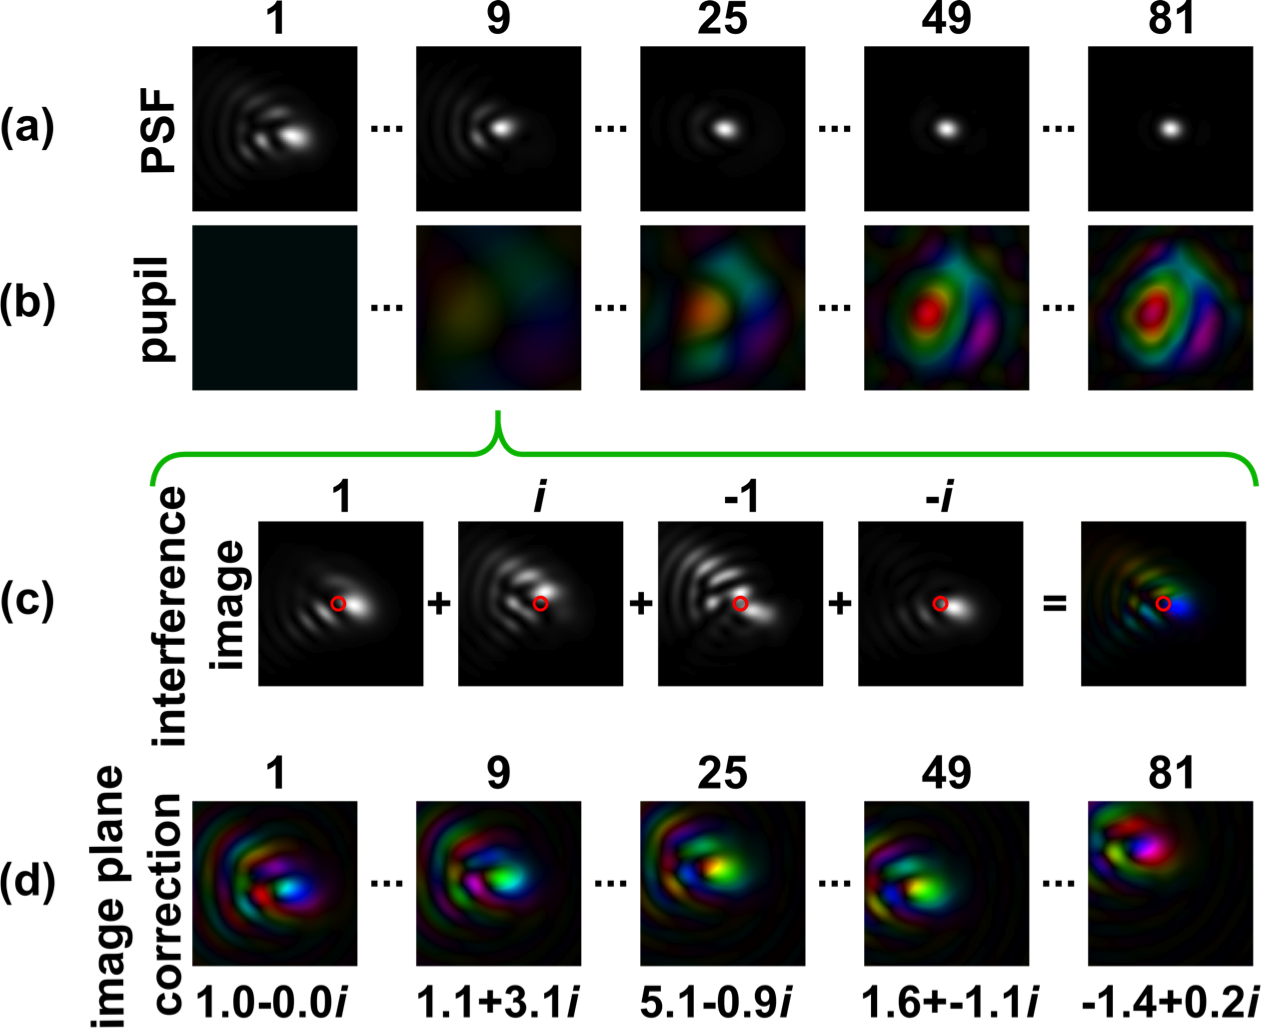
The top row of images in Figure. 8 shows the spot after probing steps 1, 9, 25, 49, and 81 respectively. The false colour images on the second row show the complex correction applied by the SLM. As before, brightness indicates amplitude and hue indicates phase. The complex correction is calculated as a linear combination of the probe beams with coefficients determined by interfering the probe beam with a reference beam. This is exemplified for step 9 in Figure 8(c,d). The probe beams, linear phase gradients in this case, are phase shifted in steps of and interfered with the reference beam. For clarity, in this example the unmodulated beam is chosen as the reference. The four phase modulated probe beams are shown in colour coding in the top half of the second part of Figure 8. The four interference images are displayed below the corresponding probe patterns. We aim to maximise the intensity on the central image pixel by introducing a corrective pupil modulation that is a linear combination of the probe patterns. In this step of the algorithm we must therefore determine the coefficient of probe beam 9. This coefficient can be determined via lock-in amplification from the intensity values measured at that pixel for the four phase shifts. The lock-in amplification determines the amplitude and phase of the complex coefficient. Since the intensity operator matrix is of rank 1, the largest eigenvector is simply the complex conjugate of this coefficient.
S4 LG beam superposition phase retrieval using optical eigenmode Gerchberg-Saxton algorithm
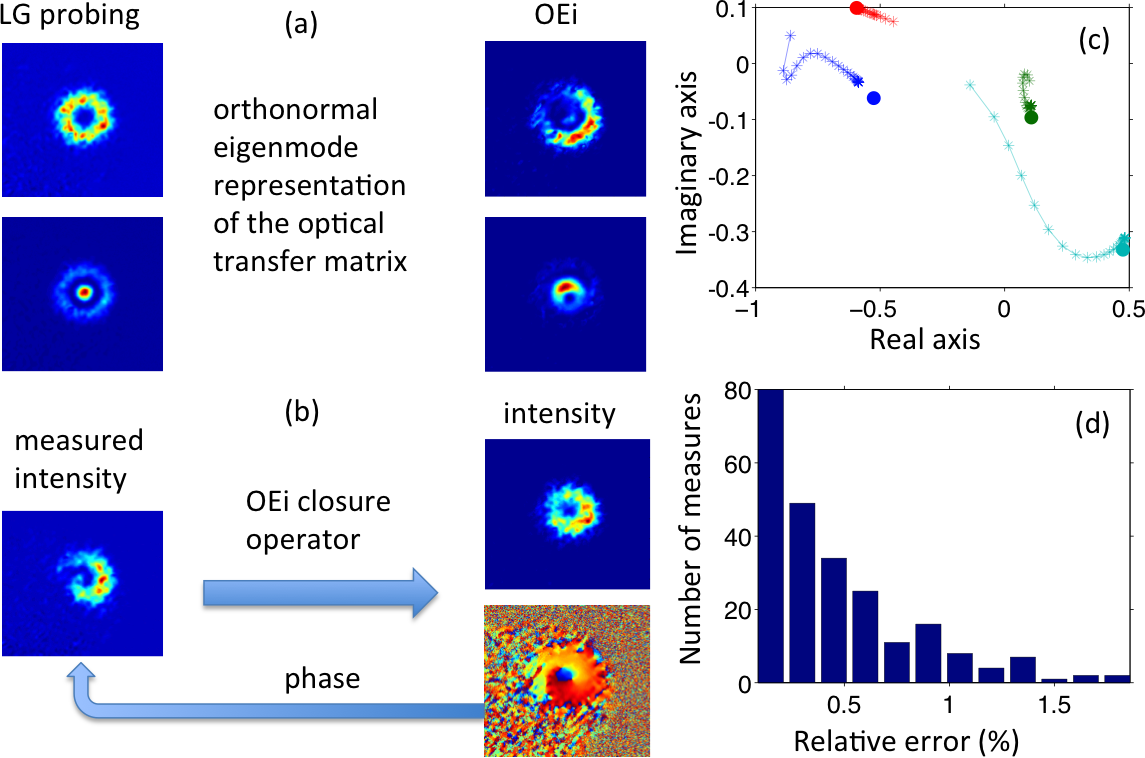
The PCA method employed in this letter is able to retrieve the real amplitude of a superposition of LG beams. To deduce the relative phase between the different LG beam constituents we use a method based upon a generalised Gerchberg-Saxton [22] algorithm (GS) working in tandem with an optical eigenmode decomposition [20, 21]. These eigenmodes correspond to a family of electromagnetic fields that in the imaging plane form, by construction, an orthogonal set of fields (see supplement S2 for details). The OEi can be measured experimentally by probing the optical system with a set of interfering beams created with the SLM [20] (schematically illustrated in figure 9a). If this set forms a large enough set of independent beams then the deduced OEi can be considered to form a complete basis accounting for all the optical degrees of freedom of the system. If the probing set is not large enough then the closure relationship of the OEi base corresponds to a projection operator, account only for a restricted set of degrees of freedom of the system. Here, we use the LG beams considered for the superposition to measure this closure operator that subsequently can be used to describe the propagation of the electromagnetic field as a superposition of the same considered LG beams. Replacing the Fourier transform in the GS algorithm with this closure operator delivers a constrained iterative GS procedure that can be used to deduce the complex superposition coefficients of the incident LG beams 9b. Figure 9c,d shows that this iterative process converges to the correct relative phases in more than 60% of cases. This convergence is helped through the use of the amplitudes measured using the PCA method as starting points.