Dust in Historical Galactic Type Ia Supernova Remnants with Herschel††thanks: Herschel is an ESA space observatory with science instruments provided by European-led Principal Investigator consortia and with important participation from NASA.
Abstract
The origin of interstellar dust in galaxies is poorly understood, particularly the relative contributions from supernovae and the cool stellar winds of low-intermediate mass stars. Recently, large masses of newly-formed dust have been discovered in the ejecta of core-collapse supernovae. Here, we present Herschel PACS and SPIRE photometry at 70-500 m of the historical, young supernova remnants: Kepler and Tycho; both thought to be the remnants of Type Ia explosion events. We detect a warm dust component in Kepler’s remnant with and mass ; this is spatially coincident with thermal X-ray emission and optical knots and filaments, consistent with the warm dust originating in the circumstellar material swept up by the primary blast wave of the remnant. Similarly for Tycho’s remnant, we detect warm dust at with mass . Comparing the spatial distribution of the warm dust with X-rays from the ejecta and swept-up medium, and H emission arising from the post-shock edge, we show that the warm dust is swept up interstellar material. We find no evidence of a cool (25-50 K) component of dust with mass as observed in core-collapse remnants of massive stars. Neither the warm or cold dust components detected here are spatially coincident with supernova ejecta material. We compare the lack of observed supernova dust with a theoretical model of dust formation in Type Ia remnants which predicts dust masses of for ejecta expanding into ambient surrounding densities of . The model predicts that silicon- and carbon-rich dust grains will encounter, at most, the interior edge of the observed dust emission at 400 years confirming that the majority of the warm dust originates from swept up circumstellar or interstellar grains (for Kepler and Tycho respectively). The lack of cold dust grains in the ejecta suggests that Type Ia remnants do not produce substantial quantities of iron-rich dust grains and has important consequences for the ‘missing’ iron mass observed in ejecta. Finally, although, we cannot completely rule out a small mass of freshly-formed supernova dust, the Herschel observations confirm that significantly less dust forms in the ejecta of Type Ia supernovae than in the remnants of core-collapse explosions.
keywords:
Supernovae: individual: Kepler, Tycho – ISM: submillimetre dust: ISM – Galaxies: abundances – submillimetre1 Introduction
Dust in galaxies is thought to be produced by in the stellar winds of both low-intermediate mass (LIM) Asymptotic Giant Branch (AGB) stars (e.g. Gehrz 1989; Whittet 2003; Sargent et al. 2010) and, to an unknown extent, by massive stars (Höfner 2009; Gomez et al. 2010; Andrews et al. 2011; Gall, Hjorth & Anderson 2011a). Massive stars may also produce dust in the expanding gas ejecta when they explode as supernovae (e.g. Clayton et al. 2001; Todini & Ferrara 2001). In the Milky Way (see Zhukovska & Gail 2008), the major dust source is presumed to be LIM stars, but when accounting for dust destruction timescales and the observed dust mass in the Galaxy, the dust injection rate from stars required is an order of magnitude higher than observed. An alternative source of dust is required to make up the dust budget (e.g. Jones 2001). This shortfall in the dust mass estimated from the dust injection rates from LIM stars is also observed in the interstellar medium (ISM) of the Large Magellanic Cloud (Matsuura et al. 2009), in galaxies out to (Dunne et al. 2011) and in dusty high-redshift galaxies (see Morgan & Edmunds 2003; Dwek, Galliano & Jones 2007). Although recent work by Jones & Nuth (2011) suggest that the dust-budget problem is not as problematic as previous works suggest given the uncertainties in mass loss rates and the efficiencies of dust formation in stellar winds, it is clear that significant dust production in SN ejecta would alleviate this dust budgetary problem. The average dust yield per SN required to explain dusty galaxies at both low and high redshifts is of order (Michałowski, Watson & Hjorth 2010; Gall, Anderson & Hjorth 2011b).
Although SNe have long been proposed as a source of dust in the ISM (Dwek & Scalo 1980; Clayton et al. 2001), observational evidence has been scarce until recently. Wooden et al. (1993) first detected emission from of dust in SN1987A using the Kuiper Airborne Observatory. Subsequent Mid-far-infrared (FIR) observations of Galactic and extra-galactic core-collapse remnants with the Spitzer Space Telescope detect small quantities of warm dust () in young (1000 days - Sugerman et al. 2006; Meikle et al. 2007, 2011; Kotak et al. 2009; Andrews et al. 2010, 2011; Fabbri et al 2011; Szalai et al. 2011) and old remnants (Williams, Chu & Gruendl 2006; Rho et al. 2008). The evidence for dust production in Type Ia remnants is scarce (Borkowski et al. 2006; Seok et al. 2008): mid-IR observations of the Kepler SNR with the Infrared Space Observatory (ISO; Douvion, Lagage & Pantin 2001) found thermal emission from warm dust (100 K) with mass . More recently, Ishihara et al. (2010) detected of swept-up (warm) dust in the Tycho SNR with AKARI, with a tentative suggestion that of dust seen in the north-east of the remnant may have been formed in the ejecta. Outside of our Galaxy, Borkowski et al. (2006) obtained mid-IR observations of four Ia remnants in the Large Magellanic Cloud, finding of swept-up interstellar dust. The dust masses from the mid-far IR studies are orders of magnitude lower than needed to solve the dust budget issues.
In order to investigate if supernova remnants (SNRs) contain cold dust missed by previous infrared (IR) observations, the Submillimetre Common User Bolometer Array (SCUBA) was used to observe Cassiopeia A (Cas A), a remnant of a Galactic core-collapse SNe (Krause et al. 2008a). The cold dust seen at 450 and 850 m was interpreted as emission from dust associated with the remnant due to the spatial correlation with the X-ray, radio and submillimetre (submm) emission (Dunne et al. 2003). Subsequently, a significant fraction of the submm emission was shown to originate from molecular clouds along the line of sight (Krause et al. 2004; Wilson & Batrla 2005). Recent observations with the Balloon-borne Large Aperture Submillimeter Telescope, BLAST and the Herschel Space Observatory showed it was difficult to distinguish between cold dust in the remnant and cold dust from intervening interstellar clouds using photometry alone (Sibthorpe et al. 2010; Barlow et al. 2010). These studies revealed a new cool component of dust in Cas A with mass at , yet even if all of the dust survived the passage through the shock, the dust mass is about one order of magnitude lower than necessary to solve the dust budget problem.
A possible method to distinguish between supernova dust and contamination from interstellar material along the line of sight was proposed by Dunne et al. (2009) where they traced the alignment of the dust towards Cas A with the SNR magnetic field using polarimetry at 850 m. They find that a significant fraction of the submm emission towards Cas A is strongly aligned with the magnetic field of the remnant. The dust mass inferred from the polarimetry study of Cas A agrees with the dust masses estimated from Herschel photometry observations of the core-collapse SNe SN1987A (Matsuura et al. 2011); in the former of dust was detected depending on the composition. The limit on the ejected heavy element mass in these sources places a further constraint on the maximum physical dust mass, finding .
The evidence for dust formation in core-collapse SNRs is accumulating, though it is not yet understood whether the amount of SN dust created is dependent on the progenitor mass, the metallicity or the type of explosion. Neither is it clear how much dust will survive, though theoretical studies suggest a significant fraction of dust grains formed in ejecta will be destroyed before injection into the ISM (Jones 2001; Bianchi & Schneider 2007) particularly in the ejecta of envelope-poor core-collapse SNe or Type Ia remnants (Nozawa et al. 2010; Nozawa et al. 2011). As yet, there is no clear evidence for freshly formed dust in the remnants of Type Ia explosions, though theoretical models of dust formation in the remnants of Type Ia events suggests that up to dust could form in the ejecta (Nozawa et al. 2011).
Historical remnants are unique probes for understanding dust production and indeed, destruction following core collapse Type II supernovae as well as low mass binary Type I events. In the Herschel era, we are finally beginning to probe the contribution of SNe to the dust budget, yet given the somewhat large uncertainties in our understanding of the dust yield from stellar sources in other galaxies and in interpreting statistical descriptions of the dust content in galaxies from wide-area surveys (e.g. Dunne et al. 2011), it is important to investigate dust production in those nearest, youngest and resolved galactic remnants. One can also argue that understanding dust formation in supernovae is important regardless of the explosion mechanism: dust formation following Type-II SNe might suggest that Type-Ia SNe would also be likely dust producers (Clayton et al. 1997; Travaglio et al. 1999). Alternatively, detecting dust from circumstellar material swept up by the blast wave of a Type Ia can be a useful probe of the progenitor and explosion mechanism.
The resolution, wavelength coverage and sensitivity of Herschel allows us to investigate the origin and quantity of dust in historical supernova remnants. Here we present IR and submm observations (§2) of the Tycho and Kepler remnants. We determine the dust mass in and towards the remnants in §3 and §4 and compare the IR emission with multiwavelength tracers in §3.1 and §4.1. The origin of the dust is discussed in §5 and we use the theoretical model of Nozawa et al. (2011) to compare the expected dust masses with the observations. The results are summarised in §6.
2 Observations and data reduction
2.1 Herschel Photometry
The Kepler and Tycho supernova remnants were observed with the Herschel (Pilbratt et al. 2010) Photodetector Array Camera and Spectrometer (PACS; Poglitsch et al. 2010) and Spectral and Photometric Imaging Receiver (SPIRE; Griffin et al. 2010) at 70, 100, 160, 250, 350 and 500 m as part of the Mass Loss from Evolved StarS survey (MESS: Groenewegen et al. 2011). Kepler was observed on 10th Sept and 11th March 2010; Tycho on 20th March 2010 and 18th Jan 2010 for PACS and SPIRE respectively. The PACS data were obtained in ‘scan-map’ mode with speed including a pair of orthogonal cross-scans over an area . The SPIRE maps were observed in ‘Large Map’ mode with scan length of over ; a cross-scan length is also taken, with a repetition factor of three. The data were processed following the detailed description given in Groenewegen et al. (2011).
The PACS maps were reduced with the Herschel Interactive Processing Environment (HIPE; Ott 2010) applying all low-level reduction steps (including deglitching) to Level 1. The SCANAMORPHOS software (Roussel 2011) was then used remove effects due to the thermal drifts and the uncorrelated noise of the individual bolometers. Final Level 2 map creation through data projection onto a changeable spatial grid was performed with SCANAMORPHOS. Since the HIPE reduction was based on the calibration file version v5, interim calibration factors of 1.12, 1.15 and 1.17 were applied to the PACS data at the respective wavelengths to be consistent with the current calibration file v6. The Full Width Half Maximum (fwhm) at 70, 100 and 160 is 6, 8 and 12 respectively. The flux calibration uncertainty for PACS is currently estimated as 10 per cent for the 70 and 100 m bands and 20 per cent at 160 m (Poglitsch et al. 2010). Colour corrections for PACS are expected to be small compared to the calibration errors. To correct for colour with dust spectrum and temperatures of , we divided by 1.00 and 1.03111http://herschel.esac.esa.int/twiki/pub/Public/PacsCalibrationWeb/ at 70 and 100 m. The 20 K interstellar dust component dominates the 160 m image, and as such the correction factor is 0.957.
For SPIRE, the standard photometer pipeline (HIPE v.5.0) was used (Griffin et al. 2010) with an additional iterative baseline removal step (e.g. Bendo et al. 2010). The SPIRE maps were created with the standard pipeline NAÏVE mapper. We multiply the 350 m data product by 1.0067 to be in line with most recent calibration pipeline (equivalent to HIPE v7 reduction). Since the beam areas increase as a function of pixel scale222http://herschel.esac.esa.int/Docs/SPIRE, the fwhm is 18.1, 24.9 and 36.4′′ for pixel sizes of 6, 10 and 14′′, at 250, 350 and 500 respectively. The SPIRE calibration methods and accuracies are outlined by Swinyard et al. (2010) and are estimated to be approx 10 per cent. The pipeline produces monochromatic flux densities for point sources with but at the longer wavelengths, colour corrections become significant. We multiplied by the colour corrections as defined in the Herschel SPIRE manual2, appropriate for and extended sources.
2.2 Multiwavelength Datasets
Optical data for the Tycho and Kepler remnants were obtained from the Hubble Space Telescope (HST) archive via ALADIN (Bonnarel et al. 2000). For Kepler’s remnant we used observations in the filters 658, 660 and 502 where the emission originates from + [Nii], [Nii] and [Oiii] respectively (e.g. Sankrit et al. 2008). Bad pixels were masked by hand. For Tycho, we use data observed at 656 nm (Lee et al. 2010), tracing in the eastern limb of the remnant.
Spitzer Multiband Imaging Photometer (MIPS; Rieke et al. 2004) Level 2 calibrated data were obtained via the archive333http://irsa.ipac.caltech.edu/data/SPITZER/docs/spitzerdataarchives/ (Kepler: PI W.Blair; Tycho: PI J.Rho) at 24 and 70 m. For 100 m data, we use the Improved Reprocessing of the IRAS Survey (IRIS; Milville-Deschenes & Lagache 2005) which have been calibrated with respect to data taken with the Diffuse Infrared Background Experiment (DIRBE). Wide field Infrared Survey Explorer (WISE; Wright et al. 2010) data were also obtained at 22 m.
The radio data at 18 cm for Tycho was obtained through the Very Large Array (VLA) archive. The Kepler data at 6 cm was kindly provided by T. DeLaney (DeLaney et al. 2002). The Chandra X-ray data for Kepler (PI S. Reynolds; Reynolds et al. 2008) and Tycho (PI J.Hughes; see Badenes et al. 2006; Katsuda et al. 2010) were available online as calibrated files extracted into soft and hard regions of the X-ray spectrum444http://chandra.harvard.edu/pwarmo/openFITS/. For Kepler’s remnant, the X-ray data used here range from , and , and for Tycho, we have , and . These ranges show line emission from silicon and iron orginating from the ejecta as well as soft and hard (with thermal and non-thermal contributions) X-ray continuum orginating from the blast wave.
To compare the submm data with the molecular emission towards and surrounding the remnants, we use high resolution and observations for Kepler (see Gomez et al. 2009 for full details). We also include our SCUBA image of Kepler at 850 m (Morgan et al. 2003; Gomez et al. 2009). Low resolution carbon monoxide maps for Tycho’s remnant were taken from the Canadian Galactic Plane Survey (CGPS; Taylor et al. 2003). The data were integrated over to to compare the remnant with molecular gas thought to be interacting with the supernova remnant (see §3.1).
2.3 Zero Levels
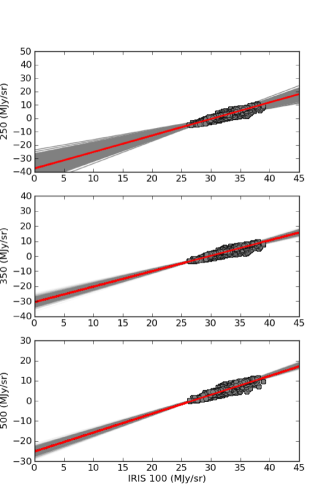
Due to the difficulty in finding a suitable baseline with which to subtract the background in the Herschel SPIRE maps, we correlate the pixel intensity from Herschel with the archival IRAS IRIS maps (calibrated with respect to DIRBE) to estimate the zero level (see Fig. 1, Table 1). The Herschel data were convolved to the same angular resolution as the IRIS 100-m map () and regridded to pixels. A least squares fit analysis was performed on the Herschel vs. IRIS data (whilst masking out the remnant) to determine the flux offsets; this sets the zero level of the PACS and SPIRE data assuming that the IRIS data is a true representation of the sky. A further scaling factor needs to be accounted for due to the expected colour correction between the bands when comparing to the 100 m band (the so-called ‘gain’ factor). These were estimated by interpolating a modified blackbody curve (after a preliminary correction of the zero levels). The zero level of the PACS and SPIRE maps are negative except for the PACS 70 m map of Kepler. The least squares fit was then repeated (see e.g. Bracco et al. 2011). The errors on the fitting were estimated using the confidence intervals from the bootstrap method, where 1000 fits were made to the bootstapped data, Table 1. This error is added in quadrature along with the calibration errors listed above and introduces (at most) an error of (well within the 20% calibration error used for PACS at 160 m); note that this does not account for any systematic errors.
| Wavelength | Zero level () | |
|---|---|---|
| () | Kepler | Tycho |
| 70 | ||
| 100 | ||
| 160 | ||
| 250 | ||
| 350 | ||
| 500 | ||
3 Kepler’s Supernova Remnant
The Kepler supernova event was first seen by Johannes Kepler in 1604 and the remnant has a shell-like structure 3 arcmin in diameter. Estimates of its distance, using H I absorption features, range from 3.9 to 6 kpc (Reynoso & Goss 1999; Sankrit et al. 2008). Its classification has been controversial (see the excellent reviews in Blair et al. 2007; Reynolds et al. 2008; Sankrit et al. 2008) with evidence pointing towards both Type-Ia – the thermonuclear explosion of a low-mass accreting star in a binary system – or Type-Ib – the core collapse of a massive star. The deepest X-ray analysis with Chandra (Reynolds et al. 2008), however, suggests that a Type-Ia is the most likely classification using both iron abundance constraints and the lack of a neutron star. The deep X-ray images also provide evidence of the blast-wave interacting with dense circumstellar material (CSM). This is unexpected for Type Ia events although observations of CSM are becoming more widespread; the presence of such a dense CSM surrounding Kepler led Reynolds to suggest the thermonuclear explosion of a single massive star () as an alternative to the canonical White-Dwarf (WD) binary scenario of Ia explosions. Whether Kepler was the result of a single progenitor or WD-AGB-binary system explosion, the mechanism was likely to be a deflagration explosion (Yang et al. 2009; see Woosley, Taam & Weaver 1986 for a review on explosion models). In this scenario, the heating of the ejecta by radioactive elements is higher than in core-collapse remnants, the ejecta densities will also decrease rapidly, though the ejecta is well mixed since the reverse shock progresses quickly through the layers in a deflagration explosion (see §5.1).
The warm dust emission detected in Kepler with ISO (Douvion et al. 2001), follows the well-known north-south shell asymmetry seen also at optical, X-ray and radio wavelengths. The correlation of the dust with the optical suggested the dust was shock-heated circumstellar dust, swept up by the shockwave of the blast. Blair et al. (2007) used Spitzer to revise the dust mass to . They also found that emission at arises only in the brightest knots of the shell seen at . The Spitzer data was poor-quality due to its low resolution and strong background gradient. Morgan et al. (2003) originally interpreted their longer wavelength 450 and 850- SCUBA data as evidence for 0.3–1 of cold dust associated with the remnant. They compared the emission from interstellar material towards Kepler using submm continuum imaging and spectroscopic observations of atomic and molecular gas, via H I, 12CO and 13CO and detected weak CO emission from diffuse, optically thin gas at the locations of some of the submm clumps. The contribution to the submm emission from foreground molecular and atomic clouds using these CO tracers was found to be negligible, but these emission lines may not be tracing all of the gas in the ISM.
The three colour Herschel PACS image of Kepler is displayed in Fig. 2. The remnant is clearly seen in blue and follows the same asymmetric structure as seen in the X-ray and radio (§3.1): the emission is brightest in the north along an arc-like shell and some emission is seen towards the centre of the remnant. The low level red structures seen across the map (outside of the remnant) originate from dusty interstellar clouds with temperatures .
3.1 The multiwavelength view
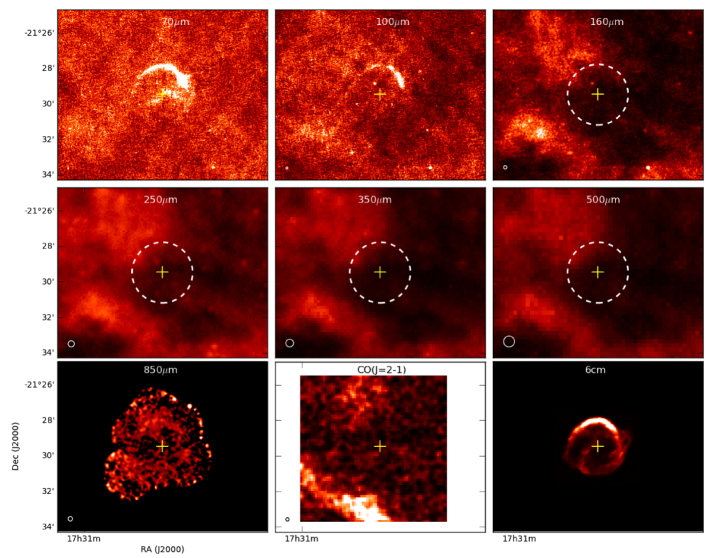
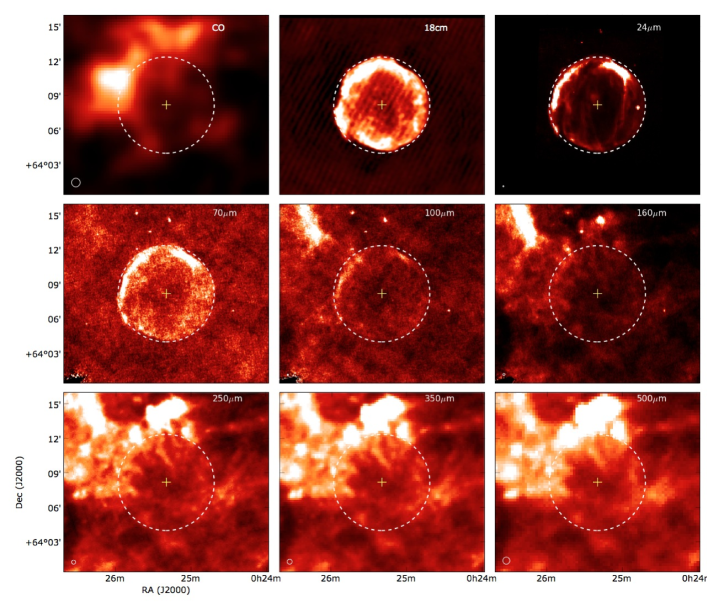
In Fig. 3, we present a multiwavelength view centred on Kepler’s SNR, comparing the Herschel PACS and SPIRE photometric data with synchrotron emission from the remnant at 6 cm, unrelated molecular gas (traced by the CO emission) and 850 emission from cold dust. The complete shell-like structure of SN material is clearly seen at radio wavelengths, tracing the forward and reverse shocks (DeLaney et al. 2002). In Fig. 4 we compare the optical and X-ray emission with the warm dust from Herschel-PACS at . The well-known north-south asymmetry seen at optical, radio and X-ray wavelengths with the enhanced northern emission (thought to originate from the motion of Kepler through the surrounding interstellar material) is also seen in the PACS data. The ‘arm’ structure across the middle (clearly seen in the radio, Fig. 3) originates from a projection effect of material in the front and back of the shell (Blair et al. 2007). Herschel detects faint IR emission arising from this component at 70 m. The faint ‘ear’-like features seen along the outermost midsection of the expanding shell at radio and X-ray wavelengths (Figs. 3 & 4) are not seen in the infrared. At the longer (160 m) PACS and the SPIRE wavelengths, it is difficult to disentangle any SNR emission from the large-scale interstellar structures extending across the region; the maps are increasingly dominated by unrelated dust clouds at temperatures of . The southern cloud of dust which is outside the area of the blast wave and ejecta regions is the same cloud orginally detected in molecular emission by Gomez et al. (2009) at 5 . The cold dust cloud in the north-east is coincident with the CO structure at 10 (see §5.3 for more discussion).
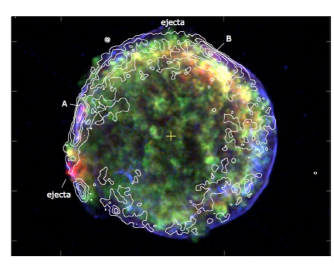
Optical emission arising from dense, knotty regions in the circumstellar medium overrun by the blast wave, is traced in [NII] and . Interestingly, the 70 m emission correlates with the + [Nii] features (Fig. 4) in both the northern limb (particularly in the north-west region) and across the projected shell along the middle. Since the emission originates from collisional heating of the thin region behind the SN shockfront (i.e. from swept-up surrounding material), the spatial agreement with the PACS emission and the ionised features suggest this dust component arises from the swept up medium. This is further supported when comparing the FIR with X-ray emission. There are three X-ray components in Kepler: continuum X-rays from the blast wave sweeping up surrounding circumstellar and interstellar material, X-ray line emission from the warm ejecta, and continuum emission arising from the non-thermal synchrotron emission in the north, south and eastern limbs. The warm dust emission in the FIR is confined within the radius of the outer blast-wave and is seen only at the brightest points in the optical, radio and X-ray (Fig. 4 - as noted in Blair et al. 2007) with peaks at 70 m seen where the soft and hard thermal X-rays overlap. Therefore, the warm dust is associated with the densest gas behind the forward shock rather than the inner ejecta material; this confirms the dust originates from the outermost regions of the remnant i.e. from the swept up shocked circumstellar and/or interstellar medium (§5.2).
3.2 The spectral energy distribution
| IR Fluxes Towards Kepler SNR (Jy) | ||||||||
| Published | .. | .. | ||||||
| This work | ||||||||
| Nonthermal | 0.02 | 0.05 | 0.06 | 0.09 | 0.12 | 0.16 | 0.20 | 0.29 |
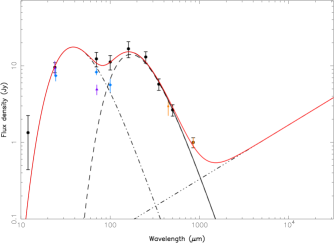
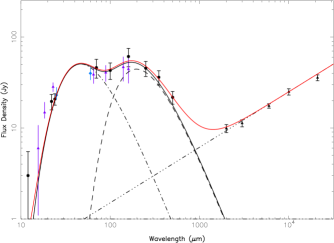
The IR-submm spectral energy distribution (SED) towards Kepler’s SNR is shown in Fig. 5. The fluxes estimated from Spitzer, Herschel and SCUBA in this work within an aperture of radius centred on the remnant, are plotted with their errors (estimated from the calibration error, the error in the zero level estimated in §2.3 and from the variations in the pixel RMS within the aperture). All the data were smoothed to the resolution of the SPIRE 500 m data using a Gaussian kernel. The aperture is somewhat larger than the SNR boundary defined by the edge of the radio () but was chosen to encompass the SNR emission in the images smoothed to the 500 m beam. The Spitzer fluxes were colour corrected using algorithms detailed in the MIPS handbook555http://irsa.ipac.caltech.edu/data/SPITZER/docs/mips/. We also compare our fluxes with previously published fluxes in the literature (Arendt 1989, Braun 1987, Douvion et al. 2001, Morgan et al. 2003, Blair et al. 2007) although these were obtained using apertures with radius ranging from and therefore differ from the fluxes in Table 2 accordingly. Note also that we measure the flux encompassed in the aperture around Kepler, and therefore includes emission from the foreground cloud.
The contribution to the IR/submm fluxes from synchrotron emission is obtained by scaling the VLA radio map of Kepler using a constant spectral index, where the mean value of is but ranges from -0.6-0.85 (DeLaney et al. 2002). The synchrotron emission at 500 m is ( per cent of the total flux). We fit a two-component modified blackbody to the dust SED after the synchrotron component has been subtracted; the model is the sum of two modified Planck functions each with a characteristic temperature, and (Eq. 1):
| (1) |
where and represent the relative masses in the warm and cold component, is the Planck function and is the dust emissivity index. The model was fitted to the SED (constrained by the 12 m flux) and the resulting parameters (, , , , ) which gave the minimal chi-squared were found. We also applied a bootstrap analysis to our SED-fitting to determine the errors on the SED model. The photometry measurements were perturbed according to the errors at each wavelength, the new fluxes were fitted in the same way, and the SED parameters recorded, with the procedure repeated 1000 times.
The total dust mass is calculated using Eq. 2:
| (2) |
where is the dust absorption coefficient and is the distance (we choose the 500 m flux since this is less sensitive to the temperature). The distance to the remnant is uncertain, with measurements of Hi absorption placing Kepler at (see Reynoso & Goss 1999 for a full discussion). Sankrit et al. (2008) have revised the measurement to using HST proper motion data. We follow Blair et al. (2007) in adopting a distance of . To determine the dust mass, we use with , appropriate for grains in the Milky Way and (Draine & Lee 1984). The best-fit dust mass within the aperture obtained from the SED model (Eqs. 1 & 2) is therefore and , with temperatures , and . The temperature of the warm component is consistent with collisional heating of dust in the shocked gas with temperature and electron density of 1.2 keV and (Bouchet et al. 2006, their Fig. 15).
The median parameters and confidence intervals from the bootstrap method are listed in Table 4. The dust mass depends strongly on the choice of , for example, typical interstellar dust grains are described well with at 70 m (e.g. Draine & Li 2001). In this case, the warm dust mass would be reduced to . We note that the uncertainty in could be an order of magnitude.
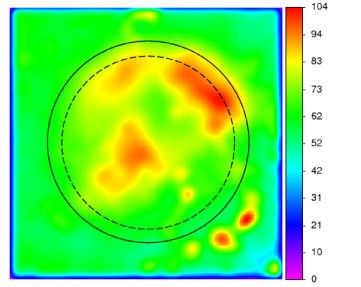
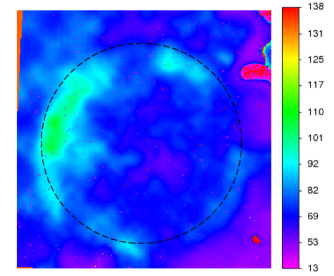
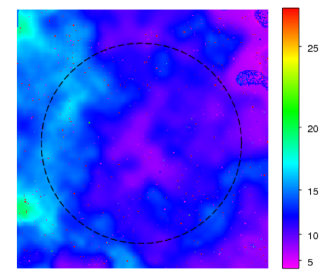
Temperature maps of the dust emission towards Kepler were created using the convolved IR-submm maps from 24-500 m, and fitting a two-temperature modified blackbody SED to each pixel. We extracted the warm and cold components for each pixel, shown in Fig. 6 (a) and (b). In order to account for the non-thermal component, the flux due to synchrotron radiation was subtracted from the dust maps on a pixel-by-pixel basis before the greybody fits were made. The synchrotron contribution in each pixel was estimated using a spectral index map created from the 6 cm and 23 cm VLA observations convolved to the same beam (see also DeLaney et al. 2002). The somewhat flatter spectral index in the northern bright ring ( compared to the average value of -0.71) resulted in removing most of the cold dust in this region, though there is residual emission associated with this component within the SNR shell (Fig. 6 (b)). This cold dust feature appears to be coincident with a similar structure seen in the warm dust component but the cold dust is further out from the centre by compared to the warm dust emission which is spatially coincident with the radio (Fig. 6 (a)).
The cold dust structures in the north are also coincident with the structures seen at 850 m with the SCUBA camera (Gomez et al. 2009, Fig. 3) originally attributed to supernova dust due to the lack of correspondance between the CO gas from molecular interstellar clouds towards Kepler (Fig. 3) and the 850 m emission. The larger Herschel map clearly shows large-scale and exended interstellar dust structures right across the entire region towards Kepler and implies that that the argument in Gomez et al. was flawed. This could simply be due to a non-constant ratio of molecular gas-to-dust, or that the 12CO and 13CO lines are not effective tracers of the gas in this region. Alternatively, it is possible that, towards Kepler, the interstellar dust structures are associated with atomic rather than molecular gas.
If the cold dust in the north of the remnant is located at the distance of the remnant, the location of the emission is suggestive of dust swept up by the blast wave, though the mass of dust in the northern shell is rather substantial at for . Elsewhere, the cold dust component does not spatially coincide with any of the SNR tracers including X-ray, radio and optical emission and is unlikely to be related to the SN itself. We discuss the origin of the cold dust further in §5.3.
Finally, we also tested for the presence of cool dust with temperatures in the range 30-40 K as found in Cas A (Sibthorpe et al. 2010; Barlow et al. 2010): the flux contribution of the warm component (visible at 24 m) was subtracted from the 70 and 100 m maps, however, we find no evidence of a cool dust component.
4 Tycho’s Supernova Remnant
The Tycho supernova event was observed by Tycho Brahe in 1572. It lies at a distance of kpc (Reynoso et al. 1997; Krause et al. 2008b) and has a thin shell-like morphology with diameter across. Here, we use the distance given in as this is consistent with the historical records of the explosion, the non-detection of the remnant and the distance to the proposed binary companion (Lu et al. 2011) (see Krause et al. 2008b for more details). The outer blast wave extends to an average distance of from the centre, with the contact discontinuity between the reverse shock material and swept up ISM at angular distances of , and depending on the position angle (Warren et al. 2005). Tycho’s light echo spectrum has revealed it to have been a Type Ia event (Krause et al. 2008b); it is the remnant of a canonical single-degenerate binary explosion (Lu et al. 2011) as evident from X-ray ejecta abundances (Decourchelle et al. 2001). This is further supported by the lack of similarity in Tycho’s optical light curve with typical sub-luminous (van den Bergh 1993) and over-luminous (Ruiz-Lapuente 2004) Type Ia explosions (Krause et al. 2008b). Badenes et al. (2006) performed detailed comparison between the X-ray spectra and the results from hydrodynamical modeling of the supernova shocks, and found that the delayed detonation explosion model was the best fit to the data. In this scenario, the SNR is expanding into an ambient density of , with an ejecta mass of .
Many authors have suggested that Tycho is interacting with molecular clouds (Reynoso & Goss 1999; Lee, Koo & Tatenatsu 2004; Cai, Yang & Lu 2009; Xu, Wang & Miller 2011) particularly with a large CO structure seen in the north and north-east at velocities between -63.5 and -61.5; this structure is believed to be responsible for the asymmetry seen in the X-ray and radio (see Fig. 8). Cai et al. (2009) showed that interaction with the ISM occurs along the entire boundary of the remnant with interstellar structures detected at velocities -69 -58; the total gas mass of clouds interacting with Tycho is (Xu et al. 2010). Conversley, Tian & Leahy (2011) propose that the CO clouds are not interacting with the remnant since the densities of the molecular gas clouds in the north are , compared to the X-ray ejecta parameters which suggest the remnant is ploughing into material of density (Decourchelle et al. 2001, Badenes et al. 2006). The difference in the density estimated for the surrounding material from CO/X-ray abundances is a factor of 60 (rather than the three orders of magnitude quoted in Tian & Leahy (2011)). However, the density of the Hi cloud they detect at -43 57 is comparable to the density obtained from X-ray observations and could therefore be tracing gas interacting with the remnant. Using a flat galactic rotation model (with standard constants) places this Hi cloud at which is consistent with the distance of Tycho’s SNR.
Ishihara et al. (2010) detect warm dust features in the north of the remnant with AKARI and suggest these are linked to the CO structures in the northeast. They also find enhanced dust emission in the northwest region of the shell and since they find no corresponding CO feature, they suggest this component could originate from SN dust. Without the long wavelength data, they were unable to constrain the amount of cold dust arising from SN material within the blast wave.
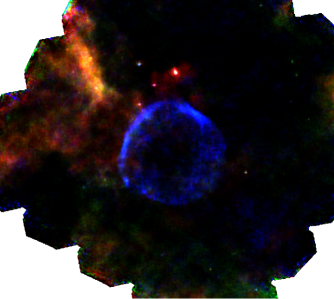
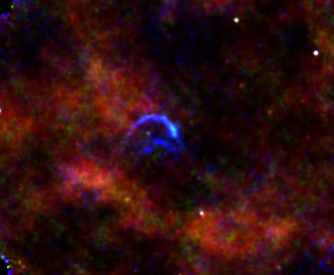
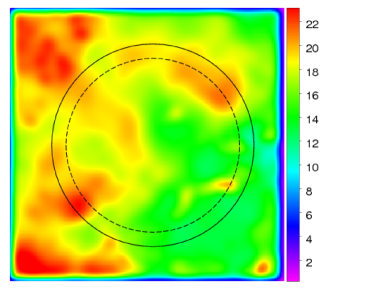
The three colour Herschel PACS image is presented in Fig. 7. As in Kepler, the remnant is clearly visible in blue, and the interstellar structures become clearer at the longer PACS and SPIRE wavelengths (Fig. 8). Cold, dusty clouds peaking at 250 m are seen to the immediate east and west of the remnant and have temperatures typical of the ISM. The bright SPIRE interstellar structure to the immediate north of the remnant in Fig. 8, is highly suggestive of emission originating from gas and dust swept up by the expanding SNR. The structure is similar in appearance to the submm cavities blown out by the winds from warm OB stars (e.g. Schneider et al. 2010) with filamentary fingers pointing inwards to the centre of the ionising radiation (in this case the SNR). In the higher resolution PACS data (Fig. 7), we see three small, warm sources embedded within the SPIRE clouds (see §4.2 for further discussion). The compact blue source to the north (Fig. 7) is the Cepheid Variable star, AS Cas.
4.1 The multiwavelength view
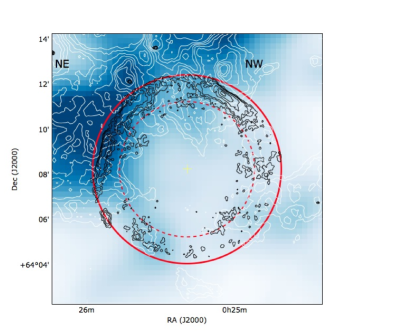
The emission from warm dust at 70 m in the north has two bright components in the NE and NW (Fig. 8); seen also in the AKARI data at wavelengths out to m. This corresponds spatially to peaks in 24 m emission as well as the X-ray continuum which traces the forward blast wave. The longer wavelength Herschel-SPIRE data do not spatially correlate with radio or X-ray emission from the remnant. In Fig. 9, we compare the PACS 70 m emission with a three-colour X-ray image (0.95-1.26, 1.63-2.26 and 4.1-6.2 keV). The emission from warm dust at 70 m is bounded within the forward and reverse shocks of the SNR at and respectively (Warren et al. 2005) and we do not see FIR emission towards the interior of the remnant. The 250 m emission (Fig. 8), however, extends far outside the shock boundary and spatially correlates with the low-level structures and the peaks seen in the CO map (Fig. 10). There doesn’t appear to be any agreement between the peaks at 70 and 250 m though we see emission at both FIR wavelengths where there is also CO emission. Comparing with the CO molecular gas, the interstellar clouds seen by Herschel close to the remnant in the north (labeled NW and NE) and to the east, match structures seen at and . In the southeast and southwest, two faint CO clouds are seen in the same range of velocity, both with associated 70 m and 250 m emission.
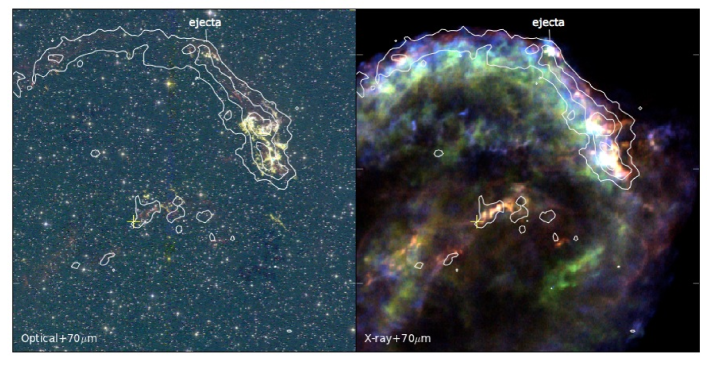
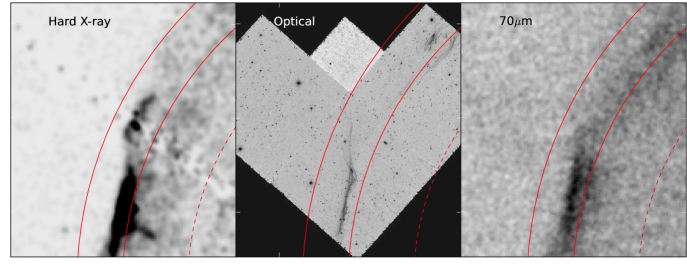
The correlation between the 70 m emission and the X-rays emitted at the outer edges of the SNR is striking. The hard X-ray emission (4.1-6.2 keV) is filamentary in structure with thin rims extending outside of the circular edge both in the north and south-east side of the remnant. The peaks in the warm dust trace the peaks in the hard X-rays. The FIR emission does not spatially coincide with the soft X-rays (Fig. 9) with peaks in the soft X-ray lagging behind the 70 m peaks by in the northwest, though the soft emission at the edges of the outer blast wave do correlate with the FIR (regions ‘A’ and ‘B’ in Fig. 9). The peaks in the radio emission also lag by . The ejecta material does not spatially correlate with the IR emission, with the peak in the northwest lagging behind the FIR by . The correlation of warm dust with the hard X-ray emission at the edges of the remnant is slightly surprising due to the large fraction of non-thermal emission expected from shocks in this energy regime. However, dust is seen where soft X-rays (from thermal emission due to the blast wave sweeping up interstellar material) and hard X-rays overlap. Lee et al. (2010) showed that the hard X-rays also contain a significant fraction of thermal emission, we therefore conclude that the warm dust is spatially correlated with the swept up material. The lack of 70 m emission in the SW region of the remnant, where the hard X-rays are bright, may suggest that the CO (Fig. 10) and 250- m structure in this region orginates from a foreground cloud which is not associated with the remnant; this would mean very little interstellar dust is being swept up on this side (in agreement with the faster expansion rate of the SNR observed in this region). The hard X-rays in the west-southwest region are produced by non-thermal synchrotron emission revealed by the presence of X-ray ‘stripes’ due to tangled magentic fields on small scales (Eriksen et al. 2011). Here then the hard X-rays are dominated by non-thermal processes and the lack of warm dust in this region further supports the hypothesis that we only see dust in the shocked, swept-up ISM where we find thermal continuum X-rays and emission - this is highlighted in Fig. 11.
There is no correlation between the FIR and X-rays for the outermost ejecta material which has broken through the reverse shock region out to the very edge of the SNR (as labeled in Fig. 9). We conclude that there is no evidence to suggest that the warm dust is associated with the ejecta.
4.2 The spectral energy distribution
| IR Fluxes towards Tycho SNR (Jy) | |||||||||
| Published | .. | .. | .. | .. | .. | ||||
| .. | .. | .. | .. | .. | .. | .. | |||
| This work | .. | .. | |||||||
| .. | |||||||||
| Nonthermal | .. | 0.65 | 1.28 | 1.58 | 1.98 | 2.09 | 2.73 | 3.34 | 4.14 |
The IR-submm SED towards Tycho’s SNR is shown in Fig. 12. The fluxes estimated from Spitzer and Herschel within an aperture of radius centred on the remnant, are plotted with their errors (Table 3; the zero-level offsets were applied to the maps before fluxes were measured - §2.3). As the synchrotron emission in Tycho has been steadily decreasing with a decay rate of (Klein et al. 1979), the radio fluxes were corrected for this decay rate to represent the same epoch as the Herschel observations. The radio spectral slope exponent in the literature ranges from (Katz-Stone et al. 2000) to (Green 2001); for the contribution of synchrotron to the 500 m flux is 4 Jy (17%), for this becomes 5 Jy. We use the former spectral index in this work since this describes the observed radio fluxes (Fig. 12). The submm flux within the aperture defined by the outer blast wave is therefore well above the expected synchrotron emission.
As described in §3.2, we fit the IR-radio SED with two-temperature modified blackbodies and a power law spectrum. The best fit parameters from the SED are , , and dust mass and . The median parameters and confidence intervals from the bootstrap method are listed in Table 4. The temperature maps are shown in Fig. 13. The warm dust is clearly seen within the remnant at the same location as the 24 m emission and the outermost radio emission. The cold dust map highlights a dust structure on the eastern edge which appears to overlap with the warm dust (Fig. 13 (b)) and appears to be swept up material. If this structure is at the distance of Tycho with and absorption properties similar to interstellar dust, the dust mass would be , well above the mass of heavy elements available to form dust.
As with Kepler, we find no evidence for a separate cool dust component (at ) in the SNR when subtracting the hot dust traced by emission at 24 m from the 70 and 100 m maps.
4.3 An aside on Triggered Star Formation
Returning to the three FIR-bright, small clumps seen in Fig. 8, one may jump to the conclusion that the remnant has triggered star formation in the compression of material as the blast wave moves outwards. Triggered star formation has long been suggested as a viable star forming mechanism (e.g. Elmegreen & Lada 1977), where an expanding Hii region compresses gas between the ionization front and the shock front, causing fragmentation into gravitationally unstable, star-forming cores. Supernova-triggered star formation has been inferred through evidence of supernova-shocked molecular gas (e.g. Reach & Rho 1999, Reynoso & Magnum 2001). The FIR-bright clumps seen by Herschel are detected at 24 m, suggesting these are star-forming cores rather than protostars. The temperatures we obtain from fitting their SEDs from 24-500 m suggest each core has a warm and cold dust temperature component with and with dust masses ranging from for the two smaller cores and for the largest and brightest core. These masses were estimated using standard interstellar values and (assuming they are at the distance of Tycho) indicate the formation of intermediate- and high-mass stars.
The star-forming clumps lie outside of the average shockfront boundary of () from the centre but the nearest, faintest clump (Fig. 8) is consistent with the distance reached by the outermost blast wave in this region at (as traced by the hard X-rays). Indeed, the travel-time for the shockfront to reach these star-forming cores at radius from the centre is given by (assuming the SNR is in the Sedov phase where is the expansion velocity - - Hayato et al. 2010). The shockfront would therefore be expected to reach the observed star-forming regions at yrs. However, a simple timescale argument rules out any triggered star formation by Tycho’s SN since the gravitational collapse of a cloud requires timescales of yrs, with the proceeding protostellar phase needing approximately yrs. It is possible that the stellar wind of the progenitor or the binary companion was responsible for creating a low density bubble due to its stellar wind. Such a scenario was suggested by Badenes et al. (2007) to explain RCW86 (confirmed observationally by Williams et al. 2011) and the star-forming loop around the SNR G54.1+0.3 (Koo et al. 2008).
5 Discussion
5.1 A theoretical model of ejecta dust formation
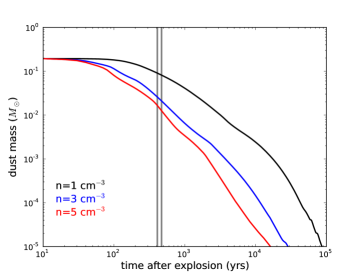
Nozawa et al. (2011) have developed a theoretical model to follow the dust formation in a carbon deflagration event (Nomoto, Thielmann & Yokoi et al. 1984) with ejecta mass of . In this model, dust grains form early-on, but are almost completely destroyed over a timescale of years due to the passage through the reverse shock. The total dust masses formed at 100-300 days range from , depending on the sticking probability of the grains and/or whether CO or SiO molecules are formed in the ejecta (since this will affect the composition and mass of grains that condense out of the ejecta gas - Nozawa et al. 2003). Here, we use this model to compare the dust masses observed with Herschel and the mass expected to have formed and survived in the ejecta at approximately 400 years after the explosion event. (We refer the reader to the full description in Nozawa et al. (2011) for details of the simulation).
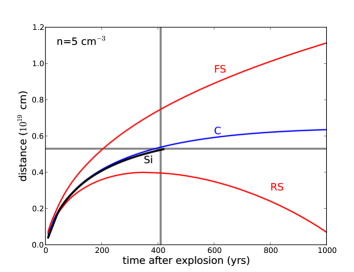
Fig. 14 (a) shows the time evolution of the total dust mass of supernova grains for a Type Ia using the dust formation calculation with a sticking probability equal to one. We consider three ambient gas densities in which the ejecta is expanding into, where , and since this will affect the amount of destruction of the dust grains we expect; the figure clearly shows that dust destruction is more efficient for higher ambient densities. Using the relative ages of Kepler and Tycho at 410(440) years and assuming that the ejecta is expanding into an ambient gas density of , the model predicts a surviving dust mass of : an order of magnitude more than the warm dust mass of estimated from the Herschel observations (Table 4). If the remnant is expanding into denser material, as certainly suggested for both the Kepler and Tycho remnants, the surviving dust mass is consequently reduced with and of dust surviving at 410(440) years for ambient densities of and respectively; the surviving dust mass is still too high to be consistent with the observations.
The comparison between the dust mass estimated from simulations and that observed with Herschel implies that even if all the warm dust observed here was produced in the ejecta, the model still overestimates the amount of dust expected in the ejecta. One possible explanation for this discrepancy is that the formation of dust grains in the ejecta is less efficient than the model e.g. the sticking coefficient needed to form the grains is lower, or that the radioactive heating from nickel and cobalt is higher, therefore inhibiting the formation of dust (Nozawa et al. 2011). It is also possible that dust destruction via sputtering may be more efficient than the model, for example due to smaller grain sizes formed and/or higher ambient densities; the Herschel observations would then suggest that dust destruction occurs efficiently on timescales of 400 years in Type Ia ejecta. Finally, using a lower mass absorption coefficient in our estimate of the observed dust masses would also alleviate this discrepancy.
Similarly, we see no observational evidence for cool or cold dust associated with ejecta material as predicted using the dust formation model. The lack of cold ejecta dust has important consequences on our understanding of the formation of iron-rich dust grains. Type Ia ejecta are prime candidates for producing iron-rich dust as they synthesise an order of magnitude more (which eventually decays into Fe) than Type-II SNe. Furthermore, there is a well known problem in reconciling the predicted ejecta abundances of iron using theoretical models (e.g. Thielemann, Nomoto & Hashimoto 1996) with observed abundances which can differ by more than an order of magnitude. It has long been suggested that one way to reconcile this issue is to ‘hide’ the missing iron in dust grains. The Nozawa et al. (2011) model predicts that any newly formed iron-rich dust grains (which would form in the innermost regions of the ejecta) would not yet be swept by the reverse shock at 400 days and would still be cold. Since Herschel does not detect any significant (subsolar) mass of cool dust associated with the ejecta, this strongly suggests that neither Kepler nor Tycho produced significant amounts of iron grains. These observations suggest that the formation of dust cannot explain the discrepancy between the observed and expected iron abundances in Type Ia supernova ejecta (see also Hamilton & Fesen 1988).
5.2 The origin of the warm dust component
Given that we observe less dust than expected to be formed in the ejecta itself, could a non-supernova source of dust explain the IR emission? One can estimate the mass of dust (Table 4) we would expect to be swept-up from circumstellar and interstellar material by the SN blast wave using simple arguments. Kepler is not yet in the Sedov phase (Decourchelle & Ballet 1994; Kinugasa & Tsunemi 1999; Cassam-Chenai et al. 2004) which suggests that the remnant is still dominated by the dynamics of the ejecta and has swept-up a mass similar or less than that ejected in the explosion. The interstellar density at the location of Kepler’s remnant ( out of the galactic plane) is expected to be low at (Vink 2008). Estimating the volume encompassed by the SN blast wave, the swept up interstellar gas mass would be and hence the swept up dust mass is (with gas-to-dust ratios of - e.g. Devereux & Young 1990). This is two orders of magnitude lower than the dust mass observed in Kepler.
As suggested by Blair et al. (2007) and Douvion et al. (2001), the origin for the IR emission in Kepler could be swept up circumstellar dust. X-ray emission arises from this shocked dense circumstellar component with mass (Kinugasa & Tsunemi 1999; Blair et al. 2007; Chiotelis, Schure & Vink 2011). Given standard gas-to-dust ratios, this mass could easily explain the warm dust masses seen in the IR. In this scenario, the explosion is single-degenerate and the progenitor has a relatively massive evolved companion, indeed Chiotellis, Schure & Vink (2011) suggest the companion was a AGB star. Is the dust mass we observe here consistent with the expected mass loss from an evolved companion star? Given the typical timescale for an AGB mass-loss phase of and typical dust mass-loss rates of (Meixner et al., 2004; Groenewegen et al. 2007; Lagadec et al. 2008), we would expect ejected during this phase666Since some of the circumstellar/interstellar dust swept up by the supernova shock wave will also be destroyed via sputtering, the masses estimated from these simple swept-up volume arguments are therefore upper limits on the actual swept-up dust mass we’d expect.. This is consistent with the mass of warm IR-emitting dust in Kepler and supports either the explosion of an intermediate mass WD-AGB binary system (e.g. Chiotellis et al. 2011) or the single progenitor AGB-star thermonuclear explosion suggested by Reynolds et al. (2008).
In Tycho’s remnant, it is unlikely that the swept-up dust originates from the CSM as the companion star was inferred to be a low mass sub-giant (Lu et al. 2011). Some of the dust could have been created during the prior AGB phase of the WD star; using the argument above, we could again expect to see of dust ejected in this phase which is consistent with the measured dust mass for Tycho. However, there is no evidence for the presence of a dense CSM surrounding Tycho. The ambient interstellar density as measured from X-ray and radio evolution is often quoted as (Dwarkadas & Chevalier 1998; Cassam-Chenaí et al. 2004; Katsuda et al. 2010) but recent simulations suggest (Badenes et al. 2007). We would therefore expect a swept-up dust mass6 of up to for the range of ambient gas densities (with gas-to-dust ratio of 120). This is consistent with the warm dust component we measure in Tycho’s remnant.
| Parameters | Dust mass | ||||
| (K) | (K) | ||||
| Kepler | |||||
| Tycho | |||||
Recently, Tian & Leahy (2011), using Hi absorption lines, showed that a number of the molecular clouds thought to be interacting with Tycho are not at the location of the remnant. This would imply there is not enough interstellar medium surrounding Tycho for the remnant to sweep up the dust we observe. However, they identify one Hi cloud which they rule out as interacting with the remnant due to its density of , yet we include this here since this is comparable to the density of the surrounding material as estimated from hydrodynamical modelling (Badenes et al. 2006). The mass of gas in this cloud is . Furthermore, we identify a faint cloud overlapping with the warm dust in the NW of Tycho at (with gas mass using a CO- factor of ) which is massive enough to explain the origin of the warm dust feature detected here6 and in Ishihara et al. (2010).
The warm dust we observe in these remnants is therefore coincident with the outermost shockfronts, indicative of swept-up circumstellar or interstellar material. We can test this by investigating the location of the dust grains expected to form from the ejecta gas using the model of Nozawa et al. (§5.1) w.r.t the forward and reverse shocks. In Fig. 14 (b), we show the distance the freshly-formed ejecta grains will have reached in 1000 years with ejecta ploughing into an ambient medium of density (chosen so that the model forward shock location for Kepler agrees with the observed shock radius at ). This figure suggests that silicon and carbon dust grains formed in the ejecta will encounter the reverse shock after 50 years, and at 400 years (due to deceleration from the gas drag), will be trapped at from the centre; for , the dust would be trapped at . The model thus predicts that any supernova dust in Kepler would lie at an angular distance of . The latter distance is consistent with the interior edge of the dust emission seen with Herschel (Fig. 3) but not consistent with the emission seen out to . In Tycho, the observed warm dust is confined between a thin region at from the centre (Figs. 10 and 11). The model suggests that for a forward shock of , the supernova dust would be located at approx. , i.e. at an angular distance of , again consistent with the interior edge of the observed warm dust emission in Tycho.
If the warm dust was formed in the supernova ejecta, we would expect it to be distributed within the forward and reverse shocks across the entire remnant. However, in Kepler’s SNR, the warm dust exhibits a north-south asymmetry, and in Tycho, there is a north-north-east asymmetry and we therefore only observe warm dust emission where there is also plenty of surrounding material. For Kepler, this is the circumstellar material in the north which the remnant is ploughing into as it moves at high velocities, and in Tycho, the dust originates from regions where we see dense molecular clouds at the edge of the remnant. This indicates that the majority of the warm dust is therefore swept-up. In summary, we cannot absolutely rule out that a small fraction of the warm dust in both remnants is formed in the supernova ejecta, but we propose that, from the spatial distribution, the warm dust in Tycho orginates from swept-up interstellar dust, and in Kepler, the warm dust originates from swept-up circumstellar dust.
5.3 The origin of the cold dust component
Approximately of cold dust is found in the apertures chosen to encompass the SNR, for Kepler and Tycho respectively (Table 4). The substantial amount rules out a swept-up CSM or ISM origin of dust, but could this massive cold component be freshly-formed dust in the supernova ejecta?
As well as using the temperature maps (Figs 6 & 13), we also searched for an excess of submm emission in the SNR compared to the unrelated molecular gas. The CO and submm fluxes (using the 250 m) in each pixel were compared and a best-fit relation determined, producing, for each pixel, an estimate of the 250 m flux that corresponds to a given CO flux. The scatter in the CO and 250-m fluxes for Kepler’s remnant is considerable, and when the submm flux associated with the CO is subtracted from the 250 m map, residual submm emission remains in the northern shell (in the same location as the structure seen in the cold temperature map, Fig 6 (b)); the dust mass in this feature is for . The cold dust does not spatially coincide with any of the ejecta tracers, and therefore we conclude that the submm emission is not dust formed in the supernova ejecta.
There is no obvious CO structure at the location of the cold dust shell seen in Kepler, though the difference between the flux at 250 m in this region and the interstellar cloud to the east of the remnant is a factor of 5; the expected CO emission associated with this faint cold dust feature is therefore at the noise level of the CO map. There is submm ‘excess’ over the molecular gas both inside and outside the remnant, suggesting that these dust clouds in general are not always well traced by the 12CO(J=2-1) emission; this method is therefore not able to distinguish between dust associated with the foreground dust component and the remnant.
Towards Tycho, a large mass of cold dust exists within the aperture encompassing the forward blast wave. Assuming that this dust component originates from the swept-up interstellar material would imply more than of gas has been swept up in the last 440 years. This is unphysical since Tycho is still in the Sedov phase where the swept up mass . The cold dust on the eastern edge of the remnant as seen clearly in the temperature map (Fig. 13) appears (at first glance) to be swept-up cold dust, but the large mass of dust in this feature () again rules this scenario out. There are a significant number of atomic and molecular clouds overlapping on the line of sight, the average column density towards the remnant (as estimated from the CO map) is , with clouds of sizes at distances of , suggesting gas masses of . Therefore, given the abundance of gas towards and behind Tycho (and spatially bounded between the SN shock radius), it is likely that we are observing a small amount of cold dust swept up in the ISM along with a significant amount of dust emission from interstellar clouds along the line of sight to the remnant.
6 Conclusions
Herschel observations of the remnants of the core-collapse SNe Cas A and SN1987A show evidence for a significant mass of dust spatially coincident with SNe ejecta. Using Herschel observations of Kepler and the Type Ia SNR, Tycho, we do not find evidence for freshly-formed supernova dust in these historical remnants.
We confirm a previously known warm dust component in Kepler’s remnant with , somewhat cooler than the dust previously detected by Spitzer and ISO, and revise the dust mass to . The warm dust is spatially coincident with thermal X-ray emission and optical knots and filaments on the outer edges of the shockfront, confirming that this component originates in the material swept up by the primary blast-wave. Given the mass and the density of the surrounding ISM, the warm dust could not have originated from swept up interstellar material, but is consistent with swept-up circumstellar dust, confirming the presence of CSM surrounding Kepler. The Herschel SPIRE images are dominated by emission from cold foreground insterstellar clouds () which overlap with the small dust clumps detected by previous ground-based SCUBA measurements. These were originally attributed to a large mass of dust either formed in the ejecta and/or swept up by the circumstellar medium. The resolution of Herschel does not allow us to distinguish between cold supernova dust or intervening interstellar material, however using dust temperature maps, and a comparison with molecular gas (traced by CO), we find that most of the cold dust originates from foreground, unrelated ISM. There is no evidence that any of the cold dust within the aperture is spatially coincident with ejecta material.
Similarly for Tycho’s remnant, we detect warm dust at with mass . Comparing the spatial distribution of the warm dust with thermal and non-thermal X-rays from the ejecta and swept up medium, and with collisionally heated H emission arising from the thin post-shock edge, we suggest the warm dust is swept up interstellar material. This is further supported by the significant amount of molecular gas surrounding the regions where warm dust is observed and the large mass of interstellar gas swept up by the remnant. We find no evidence for cool supernova dust at temperatures of as detected in the core collapse remnants Cas A and SN1987A; the lack of freshly formed dust in both remnants supports the view that Kepler was the result of a Type Ia explosion.
We compare the dust masses with the recent theoretical dust formation model of Nozawa et al. (2011) where approximately of dust is expected to form in Kepler and Tycho. The Si and C grains formed are expected to have traversed the reverse shock approximately 50 years after the explosion and are then trapped at 400 years at a distance consistent with the interior edge of the warm dust emission detected by Herschel. The observed dust mass of the warm component is lower than the model predicts, suggesting that dust formation in the ejecta is inhibited or destroyed more efficiently. We do not detect a cool dust component in the innermost regions of un-shocked ejecta, suggesting that Type Ia ejecta are not producing substantial masses of iron and are not responsible for the ‘missing’ iron mass problem in the ejecta. The mass of dust in these remnants is lower than that measured in core-collapse SNRs, though there is a possibility that a fraction of the cold dust observed towards both Tycho and Kepler could be hidden amongst the dust components along the line of sight. Resolved observations of younger Type Ia remnants with low ambient densities (and little foreground contamination) are needed to investigate the evolution of supernova dust mass further.
Acknowledgements
We thank the referee for their helpful comments on the manuscript. The images were produced with the software package APLpy http://aplpy.github.com/: thanks to Eli Bressart & Thomas Robotaille for this. We thank Jason Kirk, Tracey DeLaney and Chris North for useful discussions. H.L.G. would like to acknowledge the support of Las Cumbres Observatory Global Telescope Network.
PACS has been developed by a consortium of institutes led by MPE (Germany) and including UVIE (Austria); KU Leuven, CSL, IMEC (Belgium); CEA, LAM (France); MPIA (Germany); INAF-IFSI/OAA/OAP/OAT, LENS, SISSA (Italy); IAC (Spain). This development has been supported by the funding agencies BMVIT (Austria), ESA-PRODEX (Belgium), CEA/CNES (France), DLR (Germany), ASI/INAF (Italy), and CICYT/MCYT (Spain). SPIRE has been developed by a consortium of institutes led by Cardiff University (UK) and including Univ. Lethbridge (Canada); NAOC (China); CEA, OAMP (France); IFSI, Univ. Padua (Italy); IAC (Spain); Stockholm Observatory (Sweden); Imperial College London, RAL, UCL-MSSL, UKATC, Univ. Sussex (UK); and Caltech/JPL, IPAC, Univ. Colorado (USA). This development has been supported by national funding agencies: CSA (Canada); NAOC (China); CEA, CNES, CNRS (France); ASI (Italy); MCINN (Spain); Stockholm Observatory (Sweden); STFC, UKSA (UK) and NASA (USA). This work is based [in part] on observations made with the Spitzer Space Telescope, which is operated by the Jet Propulsion Laboratory, California Institute of Technology under a contract with NASA.
References
- [1] Andrews J., Gallagher J.S., Clayton G.C., et al., 2010, ApJ, 715, 541
- [2] Andrews J.E., Clayton G.C., Wesson R., et al., 2011, AJ, 142, 45
- [3] Arendt R.G., 1989, ApJS, 70, 189
- [4] Badenes C., Borkowski K.J., Hughes J.P., Hwang U., Bravo E., 2006, ApJ, 645, 1373
- [5] Badenes C., Hughes J.P., Bravo E., Langer N., 2007, ApJ, 662, 472
- [6] Barlow M., Krause O., Swinyard B.M., et al., 2010, A & A, 518, L138
- [7] Bendo G. J. Wilson C. D., Pohlen M., et al., 2010, A&A, 518, L65
- [8] Bianchi S., Schneider R., 2007, MNRAS, 378, 973
- [9] Blair W.P., Ghavamian P., Long K.S., Williams B.J., Borkowski K.J., Reynolds S.P., Sankrit R., 2007, ApJ, 662, 998
- [10] Bonnarel F.,Fernique P., Bienaymé O., Egret D., Genova F., Louys M., Ochsenbein F., Wenger M., Bartlett W.G., 2000, A & A Suppl. Ser. 143, 33
- [11] Borkowski K.J., Kazimierz J., Williams B.J., Reynolds S.P., Blair W.P., Ghavamian P., Sankrit R., Hendrick S.P., et al. 2006, ApJ, 642, L141
- [] Bouchet P., Dwek E., Danziger J., et al., 2006, ApJ, 650, 212
- [12] Bracco A., Cooray A., Veneziani M., et al., 2011, MNRAS, 412, 1151
- [13] Braun R., 1987, A&A, 171, 233
- [14] Cai Z., Yang, J., & Lu D. 2009, Chin. Astron. Astrophys., 33, 393
- [15] Cassam-Chenai G., Decourchelle A., Ballet J., Hwang U., Hughes J.P., Petre R., 2004, A&A, 414, 545
- [16] Chiotellis A., Schure K.M., Vink J., 2011, A & A submitted, arXiv:1103.5487
- [17] Clayton D.D., Arnett D., Kane J., Meyer B.S., 1997, 486, 824
- [18] Clayton D.D., Deneault E.A-N., Meyer B.S., Thé, L.S., 2001, ApJ, 562, 480
- [19] Decourchelle A., Ballet, 1994, A & A, 287, 206
- [20] Decourchelle A., Sauvageot, J. L., Audard M., Aschenbach B., Sembay S., Rothenflug R., Ballet J., Stadlbauer T., West R. G., 2001, A & A 365, L218
- [21] DeLaney T., Koralesky B., Rudnick L., Dickel J.R., 2002, ApJ, 580, 914
- [22] Devereux N.A., & Young J.S., 1990, ApJ, 359, 42
- [23] Douvion T., Lagage P.O., Pantin E., 2001, A&A, 369, 589
- [24] Draine B.T., Lee H.M., 1984, ApJ, 285, 89
- [25] Draine B.T., Li A., 2001, ApJ, 551, 807
- [26] Dunne L., Eales S., Ivison R.J., Morgan H., Edmunds M., 2003, Nature, 424, 285
- [27] Dunne L., Maddox, S., Ivison R.J., et al., 2009, MNRAS, 394, 1307
- [28] Dunne L., Gomez H.L., da Cunha E., et al. 2011, MNRAS, 417, 1510
- [29] Dwarkadas V.V., & Chevalier R.A., 1998, ApJ, 497, 807
- [30] Dwek E., Scalo J.M., 1980, ApJ, 239, 193
- [31] Dwek E., Galliano F., Jones A.P., 2007, ApJ, 662, 927
- [32] Elmegreen B.G., Lada C.J., 1977, ApJ, 214, 725
- [33] Erikson K. A., Hughes J. P., Badenes C., et al. 2011, ApJ, 728, L28
- [34] Fabbri J., Otsuka M., Barlow M., et al., 2011, MNRAS, 418, 1285
- [35] Gall C., Hjorth J., Anderson A.C., 2011a, The Astronomy and Astrophysics Review, 19, 43
- [36] Gall C., Anderson A.C., & Hjorth J., 2011b, A & A, 528, 14
- [] Gehrz R., 1989, in Interstellar Dust, IAU symposium eds. L.J. Allomandola and A.G.G.M. Tielens, Vol, 135, p. 445, Kluwer Academic Publishers, Dordrecht
- [37] Gomez H.L., Dunne L., Ivison R.J., et al. 2009, MNRAS, 397, 162
- [38] Gomez H.L., Vlahakis C., Stretch C.M., Dunne L., Eales S.A., Beelen A., Gomez E.L., Edmunds M.G., 2010, MNRAS, 401, L48
- [39] Green, D.A., 2001, A Catalogue of Galactic Supernova R nants (2001, De- cember version), Mullard Radio Astronomy Observatory, Cavendish Laboratory, Cambridge, U.K. (also available at http://www.mrao.cam.ac.uk/surveys/snrs/)
- [40] Griffin, M.J., Abergel, A., Abreu, A., et al., 2010, A&A, 518, L3
- [41] Groenewegen M.A.T., Wood P.R., Sloan G.C., et al., 2007, MNRAS, 376, 313
- [42] Groenewegen M.A.T., Waelkens C., Barlow M.J., et al., 2011, A & A, 526, 162
- [43] Hamilton A.J.S., & Fesen R.A., 1988, ApJ, 327, 178
- [44] Hayato A., Yamaguchi H., Hiroya T., et al. 2010, ApJ, 725, 894
- [45] Höfner S., 2009, in Cosmic Dust - Near and Far, eds. T. Henning, E. Grún, and J. Steinacker, ASP, 414, p.3
- [46] Ishihara D., Kaneda H., Furuzawa A., Kunieda H., Suzuki T., Koo B.-C., Lee H.-G., Lee J.-J., Onaka T., 2010, A & A, 521, L16
- [47] Jones A.P., 2001, Phil. Trans. R. Soc. Lond., 359, 1961
- [48] Jones A.P., Nuth J.A., 2011, A & A., 530, 44
- [49] Katz-Stone, D.M., Kassim, N.E., Lazio, T., Joseph, W., O’Doneel, R., 2000, ApJ, 529, 453
- [50] Katsuda S., Petre R., Hughes J.P., Hwang U., Yamaguchi H.Hayato A., Koji Mori K., Tsunemi H., 2010, ApJ, 709, 1387
- [51] Kinugasa K., Tsunemi H., 1999, PASJ, 51, 239
- [52] Klein U., Emerson D.T., Haslam C.G.T, Salter C.J., 1979, A & A, 76, 120
- [53] Koo B.-C., McKee C. F., Lee J.-J., Lee H.-G., Lee J.-E., Moon D.-S., Hong S. S., Kaneda H., Onaka T., 2008, ApJ, 673, 147
- [54] Kotak R., Meikle W. P. S., Farrah D., et al., 2009, ApJ. 704, 306
- [55] Krause O., Birkmann S.M., Reike G., Lemke D., Klaas U., Hines D.C., Gordon K.D., 2004, Nature, 432, 596
- [56] Krause O., Birkmann S. M., Usuda T., Hattori T., Goto M., Rieke G. H., Misselt K. A., 2008a, Science, Vol. 320, 1195
- [57] Krause O., Tanaka M., Usuda T., Hattori Takashi., Goto M., Birkmann S., Nomoto K., 2008b, Nature, 456, 617
- [58] Lagadec E., Zijlstra A.A., Matsuura M., Mezies J.W., van Loon J. Th., Whitelock P.A., 2008, MNRAS, 383, 399
- [59] Lee J.J, Koo B.C., Tatematsu K., 2004, ApJ, 605, L113
- [60] Lee J.J., Raymond J.C., Park S., Blair W.P., Ghavamian P., Winkler P.F., Korreck K., 2010, ApJ, 715, L146
- [61] Lu F.J., Wang Q.D., Ge M.Y., Qu J.L., Yang X.J., Zheng S.J., Chen Y., 2011, ApJ, 732, L11
- [62] Matsuura M., Barlow M.J., Zijlstra A.A., et al., 2009, MNRAS, 396, 918
- [] Matsuura M., Dwek E., Meixner M., et al., 2011, Science, 333, 1258
- [63] Meikle W. P. S., Mattila S., Pastorello A., et al., 2007, ApJ, 665, 608
- [64] Meikle W. P. S., Kotak R., Farrah D, et al., 2011, ApJ, 732, 109
- [65] Meixner M., Zalucha A., Ueta T., Fong D., Justtanont K., 2004, ApJ, 614, 371
- [66] Michałowski M.J., Watson D., Hjorth J., 2010, ApJ, 712, 942
- [67] Milville-Deschênes M.-A., Lagache G., 2005, ApJS, 157, 302
- [68] Morgan, H.L., Edmunds, M.G., 2003, MNRAS, 343, 427
- [69] Morgan H.L., Dunne L., Eales S., Ivison R.J., Edmunds M.G., 2003, ApJ, 597, L33
- [] Nomoto K., Thielemann, F. K., Yokoi, K. 1984, ApJ, 286, 644
- [] Nozawa T., Kozasa T., Umeda H., Maeda K., Nomoto K., 2003, ApJ, 598, 785
- [70] Nozawa T., Kozasa T., Tominaga N., Maeda K., Umeda H., Nomoto K., Krause O., 2010, ApJ, 713, 356
- [71] Nozawa T., Maeda K., Kozasa T., Tanaka M., Nomoto K., Umeda H., 2011, ApJ, 736, 45
- [72] Ott S., 2010, in Astronomical Data Analysis Software and Systems XIX, eds. Mizumoto Y., Morita K.-I., and Ohishi M., ASP Conf. Ser. Vol. 434, p.139
- [73] Pilbratt, G.L., Riedinger, J. R., Passvogel, T., et al., 2010, A & A, 518, L1
- [74] Poglitsch A., Waelkens C., Geis N., et al. 2010, A& A, 518, L2
- [75] Reach W.T., Rho J., 1999, ApJ, 511, 836
- [76] Reynoso E.M., Moffett D.A., Goss W.M., Dubner G.M., Dickel J.R., Reynolds S.P., Giacani E.B., 1997, ApJ, 491, 816
- [77] Reynoso E.M., Goss W.M., 1999, AJ, 118, 926
- [78] Reynoso E.M., Magnum J.G., 2001, AJ, 121, 347
- [79] Reynolds S.P., Borkowski K.J., Hwang U., Hughes, JP., Badenes C., Laming J.M., Blondin J.M. 2008, ApJ, 668, L135
- [80] Rho J., Kozasa, T., Rudnick L., Smith J.D., Reach W., Gomez, H., DeLaney, T., ApJ, 673, 271, 2008
- [81] Rieke G. H., Young E. T., Engelbracht C. W., et al., 2004, ApJS, 154, 25
- [82] Roussel H., 2011, submitted A & A
- [83] Ruiz-Lapuente P., 2004, ApJ, 612, 357
- [84] Saken J.M., Fesen R.A., Shull J.M., 1992, ApJS, 81, 715
- [85] Sankrit R., Blair W.P., Frattare L.M., Rudnick L., DeLaney T., Harrus I.M., Ennis J.A., 2008, ApJ, 135, 538
- [] Sargent B.A., Srinivasan S., Meixner M., et al., 2010, ApJ, 716, 878
- [86] Schneider N., Motte F., Bontemps S., et al., 2010, A & A, 518, L83
- [87] Szalai T., Vinkó J., Balog Z., Gáspár A., Block M., Kiss L. L., 2011, A & A., 527, 61
- [] Seok J.Y., Koo B-C., Onaka T. et al., 2008, Publications of the Astronomical Society of Japan, Vol.60, No.SP2, 453
- [88] Sibthorpe B., Ade P.A.R., Bock J.J., et al., 2010, ApJ, 719, 1553
- [89] Sugerman, B.E.K., Ercolano B., Barlow M.J., Tielens A.G.G.M., Clayton G.C., Zijlstra, A.A., Meixner, M., Speck, A. et al., 2006, Science, Vol. 313, 196
- [90] Swinyard, B.M., Ade, P., Baluteau, J.-P., et al., 2010, A&A, 518, L4
- [91] Taylor A.R., Gibson S.J., Peracaula M., et al. 2003, AJ, 125, 3145
- [92] Tian W.W., Leahy D.A., 2011, ApJ, 729, L15
- [93] Thielemann F.K., Nomoto K., Hashimoto M.-A., 1996, ApJ, 460, 408
- [94] Todini P., & Ferrara A., 2001, MNRAS, 325, 726
- [95] Travaglio C., Gallino R., Amari S., Zinner E., Woosley S., Lewis R.S., 1999, ApJ, 510, 325
- [96] van den Bergh S., 1993, ApJ, 413, 67
- [97] Warren J.S., Hughes J.P., Badenes C., et al. 2005, ApJ, 634, 376
- [98] Whittet D.C.B., 2003, Dust in the Galactic Environment, Second Edition, IOP, UK
- [] Williams R.M., Chu Y.-H.,& Gruendl R., 2006, AJ, 132, 1877
- [99] Williams B.J., Blair W.P., Blondin J.M., et al., 2011, ApJ, 741, 96
- [] Wilson T.L., Batrla W., 2005, A & A, 430, 461
- [100] Wooden D.H., Rank D.M., Bregman J.D., Witteborn F. C., Tielens A.G.G.M., Cohen, M., Pinto, P.A., Axelrod T.S., 1993, ApJS, 88, 477
- [101] Woosley S. E., Taam R. E., Weaver T. A., 1986, ApJ, 301, 601
- [] Wright E.L., Eisenhardt P.R.M., Mainzer A.K., et al., 2010, AJ, 140, 1868
- [102] Xu J.-L., Wang J.J., Miller M., 2011, Research in Astronomy and Astrophysics, Vol, 11., p. 537
- [103] Vink J., 2008, ApJ, 689, 231
- [] Yang X.J., Tsunemi H., Lu F.J., Chen L., 2009, ApJ, 692, 894
- [104] Zhukovska S., Gail H.-P., 2008, A & A, 486, 229