Branching actin network remodeling governs the force-velocity relationship.
Abstract
Actin networks, acting as an engine pushing against an external load, are fundamentally important to cell motility. A measure of the effectiveness of an engine is the velocity the engine is able to produce at a given force, the force-velocity curve. One type of force-velocity curve, consisting of a concave region where velocity is insensitive to increasing force followed by a decrease in velocity, is indicative of an adaptive response. In contrast, an engine whose velocity rapidly decays as a convex curve in response to increasing force would indicate a lack of adaptive response. Even taken outside of a cellular context, branching actin networks have been observed to exhibit both concave and convex force-velocity curves. The exact mechanism that can explain both force-velocity curves is not yet known. We carried out an agent-based stochastic simulation to explore such a mechanism. Our results suggest that upon loading, branching actin networks are capable of remodeling by increasing the number filaments growing against the load. Our model provides a mechanism that can account for both convex and concave force-velocity relationships observed in branching actin networks. Finally, our model gives a potential explanation to the experimentally observed force history dependence for actin network velocity.
Key words: Branching actin networks; actin-based motility; force-velocity relationship; stochastic simulations
Introduction
Branching actin networks are the principle engine that drives cell motility ranging from cell migration (1, 2) to endomembrane trafficking (3). In the lamellipodium of migrating cells, actin filaments grow from their barbed-ends, pushing against the plasma membrane in the direction of cell movement. New filaments branch off of existing filaments through the actin related protein (Arp2/3) complex, activated by WASP at the membrane. Filaments branch at a characteristic angle of . Capping proteins limit the growth of filaments by binding to the barbed-end of the filament. At the back of the network, actin filaments depolymerize and are severed, providing a fresh actin monomer supply to the front (1, 2). Understanding the basic process by which an actin network is able to exert force against a load is a fundamental step to understanding a number of cellular processes (4).
Both in vitro and in vivo experiments have been performed to probe the force-velocity relationship of growing actin networks (5, 6, 7, 8, 9, 10). Migrating cells show an adaptive response exhibiting a concave force-velocity relationship (6, 7). However, the concave force-velocity relationship is preceded by a large reduction in velocity to small forces (6). The mechanism controlling the concave force-velocity relationship and the initial response to small forces in cells is complicated by other cellular components such as focal adhesions. To study the exact mechanism that determines the force-velocity relationship of a branching actin network, in vitro experiments with more controllable conditions have been performed. One study measured the velocity of an actin network growing against a constant load force set by an atomic force microscope, and the resulting force-velocity relationship was convex (10). In a different in vitro experiment, the actin network grew against the flexible cantilever. The load force thus progressively increased as actin polymerization deflected the cantilever, and the network showed a concave force-velocity relationship (9). That experiment also showed a hysteresis effect where the velocity of the network was dependent upon the past forces applied to the network.
Experiments done in vitro have demonstrated both convex and concave force-velocity relationships in branching actin networks. This suggests that actin networks can respond to external forces in both an adaptive and a non-adaptive manner outside of cellular context. Even within the simplified in vitro setting, it is still unclear how the individual factors that govern branching actin network dynamics generate both the convex and the concave curves. It has previously been proposed that the actin network remodels itself in response to force (9), but the nature of such remodeling is largely unknown.
Evidence suggests that actin filaments utilize thermodynamic free energy to add additional monomers to exert force towards the leading edge of the network (11). The proposed model for that behavior has been termed the Brownian ratchet (12, 13, 14). The Brownian ratchet mechanism takes advantage of the asymmetry in the on and off rates of actin monomer binding to an existing filament. Small gaps arise between the actin filaments and the leading edge due to thermodynamic fluctuations. Monomers are able to bind during such fluctuations and push the leading edge forward. The predicted force-velocity curve for a single filament is a convex negative exponential function. When many filaments grow against the same load, they are able to share the load. A simple force-sharing mechanism predicted that the force-velocity curve is nonetheless convex (15), even though its slope is shallower than that for single filament. A model that tries to explain the force-insensitive region of the concave force-velocity curve (16) is largely incapable of accounting for the convex curve.
Our theoretical model was built to study both types of force-velocity relationships for branching actin networks. We used an agent-based stochastic simulation method inspired by Weichsel et al. (17) and Schaus and Borisy (18). Our results show that the balance between growth, branching and capping events controls the ability of a branching actin network to reinforce itself against a load. The model can explain both convex and concave force-velocity relationships.
Model Description
To discern the physical mechanism governing the force-velocity relationships of branching actin networks, we aimed to construct the simplest model able to reproduce the observed effects without compromising the physical essence of actin networks. The model therefore only includes the four essential processes of branching actin networks in in vitro conditions. Below, we describe the qualitative features of our model.
1. Filaments grow by adding new monomers to the barbed end of the filaments. When the filament is not in contact with the load, it does not feel the load and, hence, it could grow at its free rate . When a filament is in contact with the load surface, the rate of growth follows the Brownian ratchet mechanism, where the growth velocity of the filament is reduced by a Boltzmann factor:
| (1) |
where is the force felt by the filament, is the length of an individual actin monomer, is Boltzmann’s constant, and is the absolute temperature.
2. New filaments are created by branching off existing filaments. Arp2/3 binds to existing filaments and creates a site for a new filament to grow and generates the characteristic angle in between the original and newly branched filaments (19). Branching was modeled as a zero-order reaction, independent of the number of actin filaments, which is consistent with the experiments that suggest WASP/Scar-mediated Arp2/3 activation is the limiting factor of network growth (20). And the branching angle followed a Gaussian distribution that centers at , with a standard deviation of (19).
3. Capping proteins can bind to the tips of actin filaments, preventing them from further elongation. In in vitro conditions, the lifetime of barbed end-bound capping proteins is 30 min (21). This feature is modeled by filament growth stopped once capped. We modeled filament capping as a first-order reaction: the capping rate was proportional to the number of free barbed ends, which is agreement with in vitro experiment measurements (22, 23).
4. A significant factor in the efficiency of a growing actin network against a load is the ability of the network to share the load across multiple filaments at the leading edge, which has been a recent topic of study (15). We implemented a similar load-sharing scheme to Schaus and Borisy (15) among the filaments in contact with the load surface, i.e., the sum of the load force felt by each contacting filament is in balance with the total load. Note that the load forces felt by individual contacting filaments across the leading edge are not equal, because the closer the filament orientation is to the normal of the load surface, the larger share of the load force this filament will feel.
At each time step, calculations were done in the following order. First, the location of the leading edge was determined by the location of the foremost filament. Then, filaments in contact with the leading edge (see methods for definitions) were located. Filaments were next capped and branched, the rates of which were calculated based on the location of the filaments and Poisson statistics. Finally, the positions of all the filament tips were updated by the growth rate for each filament in accordance to force-sharing mechanism.
Model parameters were estimated based on experiment evidence where possible, and they are listed in Table 1 with references.
Methods
Actin Model
Each filament was modeled as a point in a two-dimensional plane representing the filament barbed end. The plane was bounded by a hard leading edge in the principle direction of motion (X) and periodic boundaries in the perpendicular (Y) direction. Each filament had three properties: an X-coordinate, a Y-coordinate and an angle of growth which was relative to the X-direction. As the filament grew, the X and Y coordinates would change in time, e.g. for filament growing at an angle , while the angle () for each filament did not change. The filaments were limited to having angles in as filaments growing against the principle direction of growth (X) are not seen in experiment (24) and would quickly grow too far away from the leading edge to contribute to the network velocity. The default parameters for the model are listed in Table 1.
The filaments grew against the force exerted by the leading edge (at point X=0). A filament was treated as being in contact with the boundary if the tip of the filament was within one subunit length () from the leading edge. Identifying the filaments that were in contact with the leading edge was performed at the beginning of each time step.
Within the simulations, new filaments were generated by branching from existing filaments. The filaments branched at a constant rate, calculated using zeroth-order Poisson statistics. Having a constant rate of branching new filaments essentially assumes that the rate limiting factor is the concentration of Arp 2/3 (20, 16, 25, 17). The initial tip of a new branch was placed at a point along the initial filament randomly selected from a uniform distribution extending a distance of backwards from the tip of the initial filament. The difference between the angle of the branching filament () and the angle of the initial filament () was drawn from a Guassian distribution () with mean and variance , i.e. , and the filaments branched in both directions ( or ) with equal probability (19). Gaussian random numbers were drawn using the gasdev algorithm in (26). The filaments were capped as a first-order reaction, with first-order Poisson statistics, meaning the capping rate was dependent upon the number of active filaments not in contact with the leading edge. Once a filament was capped, it was no longer able to grow, branch or exert force upon the leading edge (21). The first-order statistics were calculated based on the total number of active, uncapped filaments not in contact with the leading edge. At each time step, the number of filaments added and capped during the time were calculated using a uniform (0,1) random number using the ran1 algorithm in Numerical Recipes (26). Filaments in contact with the leading edge were neither branched nor capped as in previous models (27, 18, 15).
Filaments grew at a deterministic, constant rate in the direction defined by , based on the assumption that the rate of actin subunits adding to the filament is much faster than the rate of the network reorganization. We were principally interested in the geometric structure of the network and considered only average growth dynamics. Similar to in vitro conditions, the actin monomer concentration was modeled as saturated leading to a constant growth rate of . The velocity of each individual filament in contact with the leading edge was reduced by the Boltzmann factor derived from the Brownian-ratchet mechanism (12, 13, 14). The force was shared across all filaments using a modified version of the optimal force sharing from Schaus and Borisy (15). Each time a filament would add an additional actin subunit, the energy penalty would be proportional to , where is the total force applied by the leading edge. Normalizing the individual forces so that the total force adds up to gives the final velocity expression for a filament in contact with the leading edge:
| (2) |
where the sum is over all of the filaments in contact with the leading edge and is the total force applied to the system.
At each time step, calculations were done in the following order. First, the location of the leading edge was calculated, which was defined as the largest X coordinate of the active filaments. The filaments which were then within of the leading edge are marked as in contact with the leading edge and were no longer able to be capped or branch new filaments. Next, the number of branching and capping events between times and was calculated by comparing a uniform random number in (0,1) and the cumulative distribution function for the associated Poisson distribution. Individual filaments were chosen randomly from the population of filaments not in contact with the leading edge to be capped. Following that, filaments were again randomly chosen to serve as the branching point for new filaments. Next, the normalizing constant was calculated by summing over the filaments in contact with the boundary to get the average force exerted by each filament. Finally, the positions of the filaments are advanced by where is the velocity of filament .
All simulations started with independent, identically distributed initial conditions. The simulations started with 200 filaments uniformly distributed in the y direction and uniformly distributed within a box of length in the X direction with the constraint that half of the filaments were in the first and half in the second . The initial filament orientations were randomly drawn from a uniform distribution on . The time step, , used in each simulation was s.
Short Time-Scale
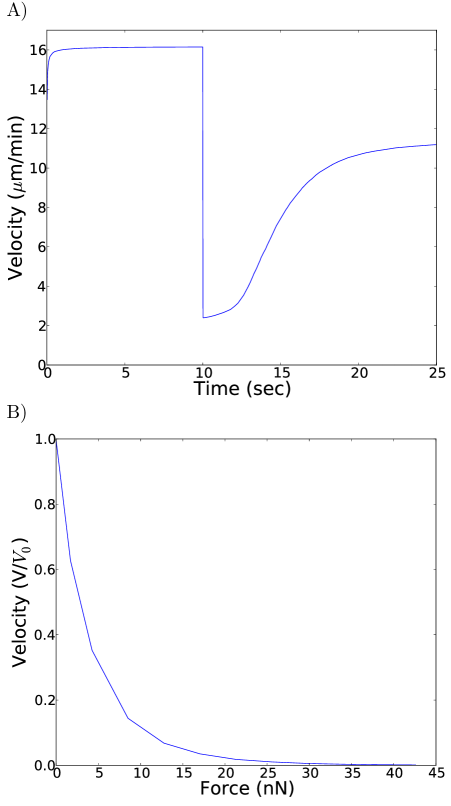
One thousand simulations were run with independent, identically distributed initial conditions as above. The simulations were averaged at each time step to generate Figure 1(A). Figure 1(B) was generated by taking the minimum velocity after force was applied. Parameter values were chosen to be and to emphasize that we were only able to see convex force velocity curves on short time-scales.
Equilibrium Simulations
Each data point from Figure 2 was the result of averaging 10 equilibrium simulations with constant force starting from the initial conditions described above. Simulations were run for a total of 10,000 s with a of s and data was sampled every 0.2 s. Reported data was sampled from the second half of the simulation to allow the system to minimize the influence of initial conditions. The equilibration can be seen in supplemental Figures S1-2.
Hysteresis Simulations
The hysteresis simulations were performed with the same initial conditions. Simulations were run for a total of 7,500 s. The first 2,500 s were run at an initial (low) force to equilibrate the system to the velocity observed in Figure 2. At time 2,500 s, the force was increased to . The system was allowed to equilibrate again to a lower velocity. Finally, at time 5,000 s the force was reduced back to where the velocity rapidly rose before converging back to equilibrium.
Filaments were made to ’stick’ to the leading edge by reducing the amount of force felt by a filament close to away from the leading edge. The new expression force felt by each filament was where is the force used in (2) and is a cubic polynomial such that:
| (3) |
where for our simulations.
Curve Parameter
We characterized the force-velocity curves by their , the force at which the relative velocity was reduced to . Twenty constant force simulations were performed for each pair of branching and capping rates ranging from 850 pN to 17 nN. was estimated by linearly interpolating between the two successive forces where the velocities surrounded . When the velocity at 17 nN was greater than one half, we used the largest force calculated (17 nN) for the purposes of figure 5. Likewise, for the purely convex curves with nN the value 4 nN was used in the graph for clarity.
Results
Our simulations were focused on how the collective properties of a branching actin network influence the ability of the network to grow against a flat surface applying a load force.
Fast force-velocity response is always convex
The first set of simulations we ran tested the temporal response of the velocity of branching actin network against a fixed load force. Figure 1(A) shows that upon loading force, the velocity drops almost instantly, which then recovers in a longer timescale (minutes) reaching a value lower than before the application of a load. Taking the velocity at the bottom of the initial response to force response gives a force-velocity curve for the short time-response of the network. Our model suggests that the force-velocity curve is always convex (Figure 1(B)).
Force-velocity relationship at long-time response can be either convex or concave
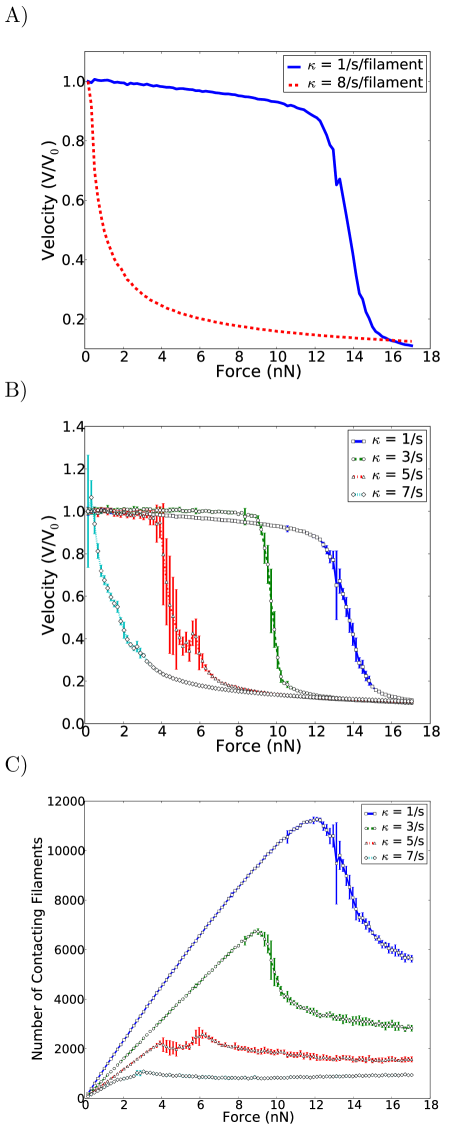
Running the simulations for an extended amount of time allows us to study the equilibrium force velocity relationship. Figure 2(A) shows that we were able to reproduce both convex and concave force-velocity curves. The only difference between the sets of simulations is the absolute value of the capping and branching coefficients. Their ratio, and therefore the average number of filaments, was fixed. We hypothesize that the network is able to reinforce itself by bringing more filaments to the leading edge.
Branching actin networks remodel by increasing the number of filaments contacting the leading edge
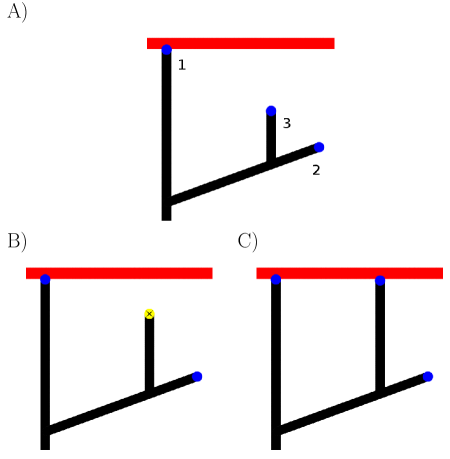
An actin network can be visualized as a population of filaments contacting the boundary and another population of filaments trailing the leading edge in reserve. The network reinforces the filaments at the leading edge when trailing filaments grow to reach the leading edge. That remodeling response simply depends on the rate at which trailing filaments are able to catch up to the leading edge. Figure 3 is an explanatory diagram showing a hypothetical branching pattern. The first filament is in contact with the boundary, the second filament branches off the first one, is further back, and serves as a source for new filaments. We term such filaments “reserve filaments” (Figure 3(A)). Since these reserved filaments are not in contact with the load surface, they don’t feel the load and grow at their free rate faster than the leading edge. Consequently, some of the reserved filaments catch up to the leading edge. When the capping rate is high, these reserved filaments will get capped and stop growing before reaching the load surface (Figure 3(B)). Conversely, when capping rate is low, these reserve filaments grow to be in contact with the load surface, thereby reinforcing the leading edge against the load (Figure 3(C)).
The hypothesis that the network reinforces itself by filaments growing to the leading edge would suggest that a network composed of shorter filaments, being less likely to grow to the leading edge, would stall at lower forces. Increasing the capping rate causes the filaments to grow for shorter periods of time leading to shorter filaments, and indeed, Figure 2(B) shows that by changing the capping rate, the force-velocity curve continuously changes from concave to convex shapes. Fewer filaments reinforce the leading edge leading to lower and lower stall forces. The number of filaments in contact with the leading edge attests the level of reinforcement. Figure 2(C) shows that more filaments are recruited to the leading edge when the capping rate is low for the same level of force.
Figure 2(C) shows that the number of filaments in contact with the leading edge increases with increasing force for all cases. However, the cases with lower capping rates generate a larger increase before peaking and stalling. This is because the branching rate is zeroth order, where the rate is independent of the number of filaments; whereas the capping rate is first order, whose rate increases with the number of available filaments. Before reaching the peak, the network is, in some sense, branching dominated. On the other hand, increases in force increase the number of filaments in contact with the leading edge, so does the capping rate. When the effective capping rate becomes faster than that of branching, the contacting filaments will get capped and, hence, their number will drop off. It is also of note that the specific filaments in contact with the leading edge are constantly changing. When the capping effect dominates over branching, the leading edge velocity is no longer sufficient to provide the turnover to sustain the higher number of filaments. Approximately at the peak of Figure 2(C), the network begins to stall in the force-velocity curves in Figure 2B.
Branching actin network remodeling could account for the observed hysteresis effect
The accumulation of filaments at the boundary is also able to explain some of the hysteresis observed in actin networks. As seen in Figure 2, the number of filaments in contact with the boundary increases with increasing force. Subjecting the network to a large force and subsequently releasing that force should leave excess filaments in contact with the leading edge.
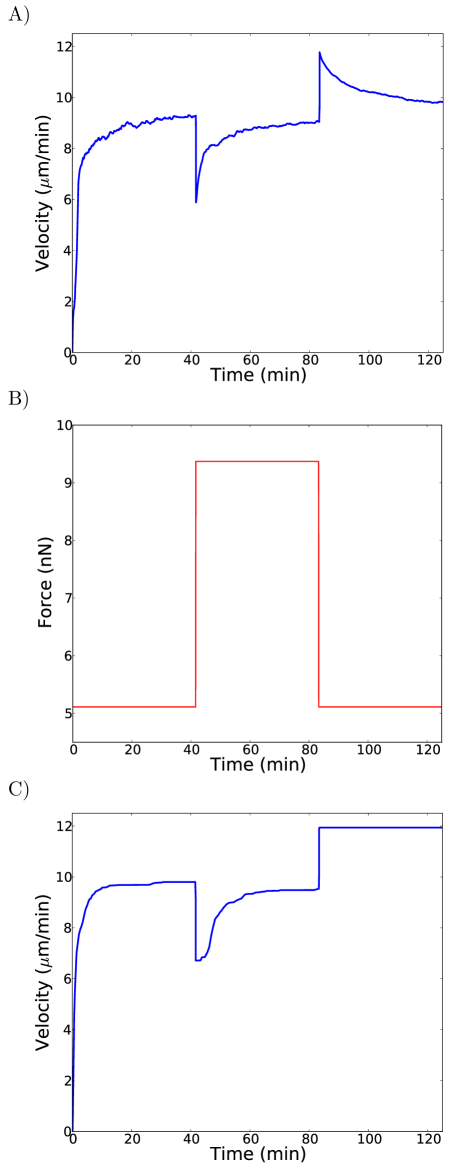
Figure 4(A) shows the velocity of a simulation where the network pushed against low force for the first third of the run, followed by high force in the middle third, and finally the original low force. That is comparable to the experiment in Parekh et al. (9). The velocity initially shoots back up in response to the reduced force, but it rapidly decays back to the initial equilibrium force similar to (16). The reduction in the load force speeds up the growth rate of all the contacting filaments at the leading edge. Due to the angle dependence of the load sharing for individual filaments, the speed-up of growth rates is heterogeneous across the contacting filaments. As a result, some filaments grow faster while staying in con- tact with the load, and slower growing filaments slide of the leading edge and are capped. Ultimately, the number of contacting filaments relaxes back to the velocity corresponding to the original force and completely loses its memory of the previous loading force. Figure 4(B) shows that sustained hysteresis can be realized in the model, if we incorporate a factor that causes the actin filaments to stick to the leading edge. While we do not know the exact nature of such an interaction between the filament tips and the load surface, actin tethering has been theoretically proposed (14) and has some experimental evidence (28, 29, 30, 31, 32).
The balance between capping and branching events dictates actin network remodeling
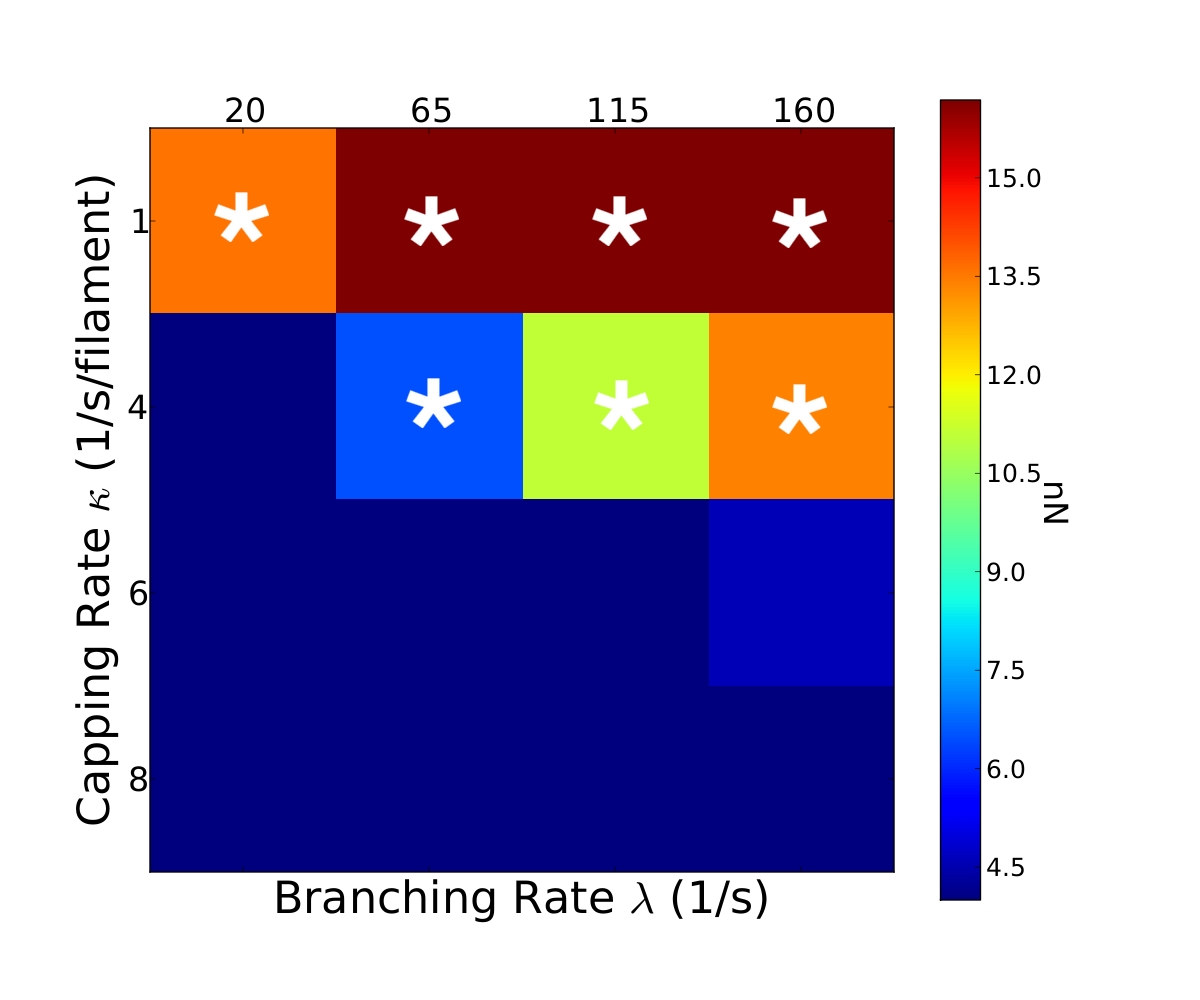
Our results suggest that the actin network remodels itself by changing the number of filaments in contact with the leading edge. That remodeling in turn determines the shape of the force velocity relationship. In particular, it determines the length of the concave portion of the curve. The balance between the branching and capping rates controls the nature of the remodeling. To obtain a systematic, systematic understanding of the rate dependence of the actin force-velocity relationship, we carried out a phase diagram study for the capping and branching rates. We used the force at which the velocity drops to 50% of the small load force to characterize the shape of the force velocity curve. Figure 5 shows the estimated values at each parameter value that constitutes our principle prediction: faster capping rates lead to less concave force velocity curves, and faster branching rates lead to more concave curves.
Discussion
We have proposed a simple mechanism where branching actin networks remodel against a load force. The model shows that the initial response of branching actin networks to loading always gives a convex force-velocity relationship (Figure 1). On longer time scales, smaller capping rates and larger branching rates generate more concave force-velocity relationship (Figure 2 and 5).
A number of recent theoretical studies have focused on how to explain both the convex and concave force-velocity relationships for branching actin networks (17, 33). Likewise, the nature of hysteresis effects observed in experiment (9) remains a subject of inquiry. Multiple attempts have been made to explain the stall force of individual actin filaments, but the stall force of a network of cooperating actin filaments is poorly understood (24). Our simulations yielded a stall force of approximately 2-3 pN/filament (see supplement), which is in close agreement with the reported value of 1.70.8 pN/filament (7). Our reported stall force per filament provides evidence that actin networks use close to optimal force sharing.
The importance of the number of growing filaments at the boundary determining how the network responds to load force has previously been suggested for branching actin networks (9, 16, 27), and for bundled filaments such as actin (34) and microtubules (35, 36). In the context of our model, bundled filaments (actin or microtubule) qualitatively correspond to the case of a very low branching rate or a high capping rate. According to our calculation, although the number of contacting filament in this case increases with the load force, the reinforcement is limited (the lower two curves in Figure 2C). Consequently, the resulting force-velocity curve is always convex, consistent with the previous findings (35, 36, 34).
Our model therefore suggests that branching event is essential in yielding a concave force-velocity relationship of actin network growth against load (Figure 5). It should be noted that a similar conclusion was also reached by Carlsson’s model (16). Carlsson (16) suggested that actin networks with autocatalytic branching would continually increase the number of filaments at the boundary leading to force-independent velocities. Although branching events are autocatalytic as demonstrated in experiments (37), Carlsson’s model (16) by itself can only account for the force-insensitive region of force-velocity curves, i.e., an additional negative feedback would be necessary to limit the increase in density predicted by the model to produce the inevitably reduction in velocity at high forces. Moreover, the Carlsson model (16) predicts a transient hysteresis effect that does not correctly reproduce the sustained hysteresis observed in experiment (9).
In contrast to Carlsson’s model, our model has a built-in negative feedback mechanism. The capping rate is a first-order reaction of the number of free filament barbed ends while the branching rate is constant, independent of the number of filaments. As the number filaments increases with the load force, so does the capping rate. That effect limits the total number of filaments. As such, our model explains both the concave and the convex force-velocity curves without resorting to additional mechanism (Figure 2). Also, our model can explain the sustained hysteresis in force-velocity relationship (9) (Figure 4(C)).
Our model does not preclude any other negative feedback mechanism limiting the density of actin filaments. It is likely that increased filament density would lead to excluded-volume effects at large forces (33). Any external negative feedback mechanism would limit the length of the force-insensitive region of the force-velocity curve. It is important to note that, due to the exponential term in Eq. (1), even a relatively small change in filament density would lead to a large change in velocity. A doubling of the number offilaments, , would lead to an approximately - fold increase in the velocity. A surprising feature we observed in our simulation was a substantial reduction in network velocity to extremely small forces (200 pN, see supplemental figure S3). This reproduces the effect seen in (9), which cannot be reproduced by (33). We hypothesize that network velocity has to be reduced by a sufficient amount before trailing filaments are able to catch up to the leading edge. When the leading edge is moving close to the growth rate of individual filaments, trailing filaments are unable to reach the leading edge. When the leading edge is sufficiently slowed by the opposing force, trailing filaments are able to reach the leading edge and the leading edge velocity stabilizes.
It is generally believed that new filament branching in actin networks occurs in a narrow zone near the membrane (20, 38), although there is no quantitative measurement on the exact location and the size of such active Arp2/3 complex-enriched zone. It has been suggested that the restriction of filament branching at the membrane may have a role in the geometric organization of the network (38, 18). We ran simulations to test if restricting the area where new filaments could branch would change the predictions of our simulations. We restricted the branching of new filaments to a zone of distance L away from, but not at the leading edge, while keeping all the other model parameters the same as those in Figure 2(B). Here, the distance L ranges from 2 to 40 actin subunit lengths, corresponding to 5.4 - 108nm. Figure S4 shows that the spatial restriction of branching events (L = 5.4nm - 108nm) does not significantly change the qualitative behavior of force-velocity relationship as compared to the unrestricted case (Figure 2(B)). If we allowed the branching events strictly at the leading edge, all the resulting force-velocity curves become convex (Figure S5). As experiments show that the Arp2/3 complex itself constitutes the first subunit of the daughter branch (39), the branching point should be at least one subunit length away from the leading edge when the first actin subunit adds to the bound Arp2/3 complex. We therefore deem this case of branching events strictly at the leading edge may not reflect the reality. Nonetheless, Figure S4 and S5 suggest that regulation of the active zone of Arp2/3 complex could modulate the quantitative behavior of the force-velocity relationship of branching actin network.
The majority of our simulations were performed with constant force. However, our model is relevant to both constant and non-constant force because it requires no equilibrium assumptions. Our model showed a relaxation time (minutes) before the network reached equilibrium velocity. Changing the force more slowly than this relaxation time would allow the network to continuously adapt to the increased forces and show strong hysteresis effects. Increasing the force substantially faster than the relaxation time would not allow the network to restructure itself leading to constant force type results; such phenomena are captured by the convex force-velocity relationship predicted by our model (see Figure 1(B)). An experimentally observed value for this relaxation time could be found, and experiments changing the force pressing against an actin network more slowly than the observed relaxation time could test our model prediction.
Figure 2(B) should be qualitatively reproducible in experiment and could serve as an excellent test of several hypotheses for branching actin networks. The relevant biochemical quantities could be manipulated in the vein of Cameron et al. (40). Such an experiment could be performed both with constant force (10) and with a constantly increasing force (9). We further note that the number of active actin nucleation factor (such as WASP) at the load surface can be negatively regulated by the number of free barbed ends at the leading edge (41). This additional negative feedback mechanism could limit the effect of increasing the Arp2/3 concentration. Interestingly, capping proteins could increase the growth rate of branching actin networks by promoting more frequent filament nucleation by Arp2/3, funneling actin monomers to the uncapped barbed ends of actin filaments, without affecting the free filament elongation rate (41). These seminal in vitro studies point to a more intertwined interaction between branching and capping events of actin networks, which will be the future extension of our current model.
Our model implements a load-sharing mechanism where the contacting filaments collectively share the load across the leading edge. That is, the addition of a new actin monomer is only opposed by a fraction of the total load force pressing on the network. In the context of our model, load-sharing mechanism is valid as long as Brownian ratchet mechanism holds up. The Brownian ratchet mechanism assumes that the thermal fluctuations between the filament tip and the load surface are significantly faster than the addition of new actin monomers (13, 14). Fluctuations must be large enough for a new monomer to fit in the gap between the tip and the load. Smaller and or slower fluctuations would then reduce the efficiency of the mechanism. Experiments have indeed demonstrated that reducing thermal fluctuations by lowering the temperature strongly hinders the efficiency of filament growth (11). Thus, it is the thermal fluctuations that buffer between the contacting filament tips and the load surface, providing the flexible interface to accommodate insertions of actin monomers. The separation of time scales also implies that the load force felt by each contacting filament is an average over many fluctuations. Consequently, only the partial load force shared across filaments dictates the network growth rate. In the future, we intend to study how thermal fluctuations influence the efficiency of load-sharing mechanism in further detail.
In the model, the actin network was assumed to be a rigid structure so that does not buckle nor break down. In reality, there will be many cross-linker proteins that stiffen the actin network. In addition, capping events in our model limited filaments to an average length of less than 1 m, significantly less than the persistence length of a single actin filament, 17 m (42). Consequently, each individual actin filament can be viewed as a rigid rod. The actin filaments in our case are highly branched, which is believed to be much more rigid than its unbranched counterpart. Although we did not explicitly incorporate these known properties, our model used their effects and simply assumed that the network was a rigid structure. The model does not consider the cases where the filaments could undergo buckling or even breaking down, the topic of which will be investigated in the future.
Conclusion
The simple physical model shown here gives insight into the behavior of branching actin network remodeling in the presence of a load. In particular, the network velocity dependence upon the number of filaments growing against the leading edge provides a simple mechanical mechanism to explain a number of experimental effects. The ability of actin networks to remodel is controlled by the balance between branching and capping rates. This mechanism can account for both the observed convex and concave force-velocity relationships. Further investigation into actin network properties, both physical and biochemical, that determine how many growing filaments a network is able to recruit to the leading edge will deepen our understanding of actin–based motility.
Acknowledgements
We would like to acknowledge Dr. Alex Sodt for his contribution to the code used for the simulations and Andrea Lively for her helpful comments improving the manuscript. We also would like to thank Dr. Ed Korn and Dr. John Hammer III for stimulating discussions and critical suggestions. This work is supported by the Intramural Research Program of NHLBI at NIH.
References
- Pollard and Borisy (2003) Pollard, T. D., and G. G. Borisy, 2003. Cellular motility driven by assembly and disassembly of actin filaments. Cell 112:453–465.
- Fletcher and Mullins (2010) Fletcher, D. A., and R. D. Mullins, 2010. Cell mechanics and the cytoskeleton. Nature 463:485–492.
- Engqvist-Goldstein and Drubin (2003) Engqvist-Goldstein, A. E. Y., and D. G. Drubin, 2003. Actin assembly and endocytosis: from yeast to mammals. Annu Rev Cell Dev Biol 19:287–332.
- Pollard and Cooper (2009) Pollard, T. D., and J. A. Cooper, 2009. Actin, a central player in cell shape and movement. Science 326:1208–1212.
- McGrath et al. (2003) McGrath, J. L., N. J. Eungdamrong, C. I. Fisher, F. Peng, L. Mahadevan, T. J. Mitchison, and S. C. Kuo, 2003. The force-velocity relationship for the actin-based motility of Listeria monocytogenes. Curr Biol 13:329–332.
- Prass et al. (2006) Prass, M., K. Jacobson, A. Mogilner, and M. Radmacher, 2006. Direct measurement of the lamellipodial protrusive force in a migrating cell. J Cell Biol 174:767–772.
- Heinemann et al. (2011) Heinemann, F., H. Doschke, and M. Radmacher, 2011. Keratocyte lamellipodial protrusion is characterized by a concave force-velocity relation. Biophys J 100:1420–1427.
- Cameron et al. (1999) Cameron, L. A., M. J. Footer, A. van Oudenaarden, and J. A. Theriot, 1999. Motility of ActA protein-coated microspheres driven by actin polymerization. Proc Natl Acad Sci U S A 96:4908–4913.
- Parekh et al. (2005) Parekh, S. H., O. Chaudhuri, J. A. Theriot, and D. A. Fletcher, 2005. Loading history determines the velocity of actin-network growth. Nat Cell Biol 7:1219–1223.
- Marcy et al. (2004) Marcy, Y., J. Prost, M.-F. Carlier, and C. Sykes, 2004. Forces generated during actin-based propulsion: A direct measurement by micromanipulation. Proceedings of the National Academy of Sciences of the United States of America 101:5992–5997.
- Shaevitz and Fletcher (2007) Shaevitz, J. W., and D. A. Fletcher, 2007. Load fluctuations drive actin network growth. Proc Natl Acad Sci U S A 104:15688–15692.
- Peskin et al. (1993) Peskin, C. S., G. M. Odell, and G. F. Oster, 1993. Cellular motions and thermal fluctuations: the Brownian ratchet. Biophys J 65:316–324.
- Mogilner and Oster (1996) Mogilner, A., and G. Oster, 1996. Cell motility driven by actin polymerization. Biophys J 71:3030–3045.
- Mogilner and Oster (2003) Mogilner, A., and G. Oster, 2003. Force generation by actin polymerization II: the elastic ratchet and tethered filaments. Biophys J 84:1591–1605.
- Schaus and Borisy (2008) Schaus, T. E., and G. G. Borisy, 2008. Performance of a population of independent filaments in lamellipodial protrusion. Biophys J 95:1393–1411.
- Carlsson (2003) Carlsson, A. E., 2003. Growth velocities of branched actin networks. Biophys J 84:2907–2918.
- Weichsel and Schwarz (2010) Weichsel, J., and U. S. Schwarz, 2010. Two competing orientation patterns explain experimentally observed anomalies in growing actin networks. Proceedings of the National Academy of Sciences 107:6304–6309.
- Schaus et al. (2007) Schaus, T. E., E. W. Taylor, and G. G. Borisy, 2007. Self-organization of actin filament orientation in the dendritic-nucleation/array-treadmilling model. Proc Natl Acad Sci U S A 104:7086–7091.
- Mullins et al. (1998) Mullins, R. D., J. A. Heuser, and T. D. Pollard, 1998. The interaction of Arp2/3 complex with actin: nucleation, high affinity pointed end capping, and formation of branching networks of filaments. Proc Natl Acad Sci U S A 95:6181–6186.
- Pollard et al. (2000) Pollard, T. D., L. Blanchoin, and R. D. Mullins, 2000. Molecular mechanisms controlling actin filament dynamics in nonmuscle cells. Annu Rev Biophys Biomol Struct 29:545–576.
- Schafer et al. (1996) Schafer, D. A., P. B. Jennings, and J. A. Cooper, 1996. Dynamics of capping protein and actin assembly in vitro: uncapping barbed ends by polyphosphoinositides. J Cell Biol 135:169–179.
- Mullins and Pollard (1999) Mullins, R. D., and T. D. Pollard, 1999. Rho-family GTPases require the Arp2/3 complex to stimulate actin polymerization in Acanthamoeba extracts. Curr Biol 9:405–415.
- Xu et al. (1999) Xu, J., J. F. Casella, and T. D. Pollard, 1999. Effect of capping protein, CapZ, on the length of actin filaments and mechanical properties of actin filament networks. Cell Motil Cytoskeleton 42:73–81.
- Mogilner (2009) Mogilner, A., 2009. Mathematics of cell motility: have we got its number? J Math Biol 58:105–134.
- Schaub et al. (2007) Schaub, S., J.-J. Meister, and A. B. Verkhovsky, 2007. Analysis of actin filament network organization in lamellipodia by comparing experimental and simulated images. J Cell Sci 120:1491–1500.
- Press et al. (1992) Press, W. H., S. A. Teukolsky, W. T. Vetterling, and B. P. Flannery, 1992. Numerical recipes in C (2nd ed.): the art of scientific computing. Cambridge University Press, New York, NY, USA.
- Carlsson (2001) Carlsson, A. E., 2001. Growth of branched actin networks against obstacles. Biophys J 81:1907–1923.
- Giardini et al. (2003) Giardini, P. A., D. A. Fletcher, and J. A. Theriot, 2003. Compression forces generated by actin comet tails on lipid vesicles. Proc Natl Acad Sci U S A 100:6493–6498.
- Upadhyaya et al. (2003) Upadhyaya, A., J. R. Chabot, A. Andreeva, A. Samadani, and A. van Oudenaarden, 2003. Probing polymerization forces by using actin-propelled lipid vesicles. Proc Natl Acad Sci U S A 100:4521–4526.
- Carlier and Pantaloni (2007) Carlier, M.-F., and D. Pantaloni, 2007. Control of actin assembly dynamics in cell motility. J Biol Chem 282:23005–23009.
- Co et al. (2007) Co, C., D. T. Wong, S. Gierke, V. Chang, and J. Taunton, 2007. Mechanism of actin network attachment to moving membranes: barbed end capture by N-WASP WH2 domains. Cell 128:901–913.
- Svitkina (2007) Svitkina, T., 2007. N-WASP generates a buzz at membranes on the move. Cell 128:828–830.
- Schreiber et al. (2010) Schreiber, C. H., M. Stewart, and T. Duke, 2010. Simulation of cell motility that reproduces the force-velocity relationship. Proc Natl Acad Sci U S A 107:9141–9146.
- Tsekouras et al. (2011) Tsekouras, K., D. Lacoste, K. Mallick, and J.-F. Joanny, 2011. Condensation of actin filaments pushing against a barrier. New Journal of Physics 13:103032.
- Mogilner and Oster (1999) Mogilner, A., and G. Oster, 1999. The polymerization ratchet model explains the force-velocity relation for growing microtubules. European Biophysics Journal 28:235–242. 10.1007/s002490050204.
- van Doorn et al. (2000) van Doorn, G. S., C. Tănase, B. M. Mulder, and M. Dogterom, 2000. On the stall force for growing microtubules. European Biophysics Journal 29:2–6. 10.1007/s002490050245.
- Goley and Welch (2006) Goley, E. D., and M. D. Welch, 2006. The ARP2/3 complex: an actin nucleator comes of age. Nat Rev Mol Cell Biol 7:713–726.
- Atilgan et al. (2005) Atilgan, E., D. Wirtz, and S. X. Sun, 2005. Morphology of the lamellipodium and organization of actin filaments at the leading edge of crawling cells. Biophys J 89:3589–3602.
- Rouiller et al. (2008) Rouiller, I., X.-P. Xu, K. J. Amann, C. Egile, S. Nickell, D. Nicastro, R. Li, T. D. Pollard, N. Volkmann, and D. Hanein, 2008. The structural basis of actin filament branching by the Arp2/3 complex. J Cell Biol 180:887–895.
- Cameron et al. (2004) Cameron, L. A., J. R. Robbins, M. J. Footer, and J. A. Theriot, 2004. Biophysical parameters influence actin-based movement, trajectory, and initiation in a cell-free system. Mol Biol Cell 15:2312–2323.
- Akin and Mullins (2008) Akin, O., and R. D. Mullins, 2008. Capping protein increases the rate of actin-based motility by promoting filament nucleation by the Arp2/3 complex. Cell 133:841–851.
- Ott et al. (1993) Ott, Magnasco, Simon, and Libchaber, 1993. Measurement of the persistence length of polymerized actin using fluorescence microscopy. Phys Rev E Stat Phys Plasmas Fluids Relat Interdiscip Topics 48:R1642–R1645.
- Abraham et al. (1999) Abraham, V. C., V. Krishnamurthi, D. L. Taylor, and F. Lanni, 1999. The actin-based nanomachine at the leading edge of migrating cells. Biophys J 77:1721–1732.
| 2.7 nm | Length of an actin subunit. (43) | |
|---|---|---|
| 4.6 pNnm | Absolute temperature. | |
| Branching rates.111 | ||
| 1-8/s/filament | Capping rates. (21) | |
| /s | Default velocity. (43) | |
| 200 | Average number of free filament barbed ends. . | |
| Mean branching angle. (19) | ||
| Branching standard deviation (19) |
1Branching rate was set relative to the capping rate to determine the average number of free filaments.
Figure Legends
Figure 1
A) shows a characteristic time trace of the velocity response to force applied at 100 seconds, and B) shows the convex force-velocity curve generated by the initial response of the network to force. These simulations were run with capping rate and branching rate .
Figure 2
Varying the capping rate () over an order of magnitude changes the shape of the force-velocity curve. A) shows that we are able to qualitatively reproduce both the convex and the concave force velocity curves. B) shows the continuous deformation of the force-velocity curve for a few capping rates. C) shows the relationship between force and the equilibrium number of contacts for the same capping rates as in B. The error bars in B) and C) represent the standard deviation estimated from 10 simulations.
Figure 3
This diagram shows how the average length of the filaments could influence the number of filaments in contact with the leading edge. Filaments are represented by black lines; the red line is the leading edge; the blue circles are actively growing barbed ends; and the yellow circle represents a barbed end that has been capped. A) A hypothetical scenario involving one filament barbed contacting the leading edge with a second filament growing behind the leading edge. B) When the capping rate is high, the reserve filament is capped (yellow circle) before it reaches the leading edge. C) When the capping rate is low, sufficiently long filaments can grow and contact the leading edge, increasing the leading edge velocity.
Figure 4
These are plots of simulations testing for hysteresis in the force-velocity relationship. A) shows a typical simulation result with a transient hysteresis effect. B) shows the time dependent force used in both A and C. C) shows a typical simulation when filaments reaching the leading edge stuck to the leading edge.
Figure 5
The color represents the estimated for a variety of branching and capping rates. The cases with concave force-velocity curves are labeled with white asterisks. Decreasing the capping rate and increasing the branching rate serve to generate more filaments which shifts rightward, meaning a more concave curve.