How Starless Are Starless Cores?
Abstract
In this paper, we present the results of CARMA continuum and spectral line observations of the dense core Per-Bolo 45. Although this core has previously been classified as starless, we find evidence for an outflow and conclude that Per-Bolo 45 is actually an embedded, low-luminosity protostar. We discuss the impact of newly discovered, low-luminosity, embedded objects in the Perseus molecular cloud on starless core and protostar lifetimes. We estimate that the starless core lifetime has been overestimated by 4-18% and the Class 0/I protostellar lifetime has been underestimated by 5-20%. Given the relatively large systematic uncertainties involved in these calculations, variations on the order of 10% do not significantly change either core lifetimes or the expected protostellar luminosity function. Finally, we suggest that high resolution (sub)millimeter surveys of known cores lacking near-infrared and mid-infrared emission are necessary to make an accurate census of starless cores.
Subject headings:
Astrochemistry; Stars: formation; ISM: jets and outflows1. Introduction
Starless cores are the eventual birthplaces of stars, individually or possibly in small multiples. They represent the transition between a diffuse molecular cloud and the next generation of stars to form therein. Dense cores are often identified by their dust continuum emission, and their status as either protostellar or starless can be classified by the respective presence or absence of an embedded infrared object or molecular outflow. For example, cores in nearby molecular clouds identified by their 1.1 mm emission have been classified by Enoch et al. (2008), and cores identified by their 850 µm emission have been classified by Hatchell et al. (2007a), Jørgensen et al. (2007), and Sadavoy et al. (2010a). Given high amounts of extinction from dust, near-infrared observations can sometimes miss deeply embedded protostars, leading to a misclassification of dense cores. Reviews of the evolution of low-mass cores can be found in Di Francesco et al. (2007) and Ward-Thompson et al. (2007).
The first “starless” core observed with the Spitzer Space Telescope (Werner et al., 2004) by the Cores to Disks legacy program (c2d; Evans et al., 2003), L1014, turned out to host an embedded infrared point source (Young et al., 2004). Other supposedly starless cores, such as L1448 and L1521F, were also found to harbour Very Low Luminosity Objects (VeLLOs) that are either protostars or proto-brown dwarfs (Kauffmann et al., 2005; Bourke et al., 2006). VeLLOs are defined to be objects embedded in dense cores that have luminosities (Kauffmann et al., 2005; Di Francesco et al., 2007). A search for VeLLOs in the c2d survey identified 50 such objects, and 15-25% of the “starless” cores in the survey turned out to be misclassified (Dunham et al., 2008). Furthermore, Dunham et al. (2008) postulated that there is likely to be a population of embedded objects even fainter than the sensitivity limit of the c2d survey, leading to the conclusion that there is still a significant number of hidden VeLLOs.
Despite the progress made with Spitzer, deeply embedded protostars will still be missed by near-infrared large-field surveys. For example, the well-studied protostar IRAS 16293-2422 has not been detected at wavelengths shorter than 12 µm (Jørgensen et al., 2008). Recent observations of dense cores with (sub)millimeter interferometers and deeper mid-infrared observations towards known cores have found three new VeLLOs or candidate first hydrostatic cores in the Perseus molecular cloud. A first hydrostatic core is a short-lived stage that occurs after collapse has begun, between the prestellar core and Class 0 protostar phases, in which there is hydrostatic balance between the thermal pressure of molecular hydrogen and gravity. Since first hydrostatic cores qualify as VeLLOs, in this paper we will group these two classes of objects together unless there is observational evidence that a particular VeLLO is a first hydrostatic core. Dunham et al. (2011) have estimated that there should be between 1-6 first hydrostatic cores in the Perseus molecular cloud, based on the expected lifetime of first hydrostatic cores ( - years; Boss & Yorke, 1995; Omukai, 2007; Saigo et al., 2008; Tomida et al., 2010), an assumed lifetime of the embedded protostellar phase ( years; Evans et al., 2009), and the number of embedded prototstars in Perseus (66; Enoch et al., 2009). Three candidate first hydrostatic cores have been identified so far in the Perseus molecular cloud. The first, L1448 IRS2E, previously believed to be starless based on non-detections with Spitzer from 3.6 m to 70 m, was recently found to host a protostar or first hydrostatic core (Chen et al., 2010), based on the detection of a collimated CO (2-1) outflow. The second, Per-Bolo 58 (Enoch et al., 2006), previously believed to be starless based on Spitzer observations from the c2d survey (Evans et al., 2003), was found to host an embedded protostar or first hydrostatic core based on a deep 70 µm map and 3 mm continuum CARMA observations (Enoch et al., 2010; Schnee et al., 2010). The presence of an embedded source in Per-Bolo 58 was then confirmed with SMA observations showing a 1.3 mm continuum source and CO (2-1) outflow (Dunham et al., 2011). Third, L1451-mm was also considered starless based on non-detections in the Spitzer near-infrared and mid-infrared images taken as part of the c2d survey. Follow-up observations of L1451-mm with the SMA, CARMA, and VLA found compact 3 mm and 1 mm continuum emission coinciding with broadened spectral lines (N2H+, NH2D, and NH3) and a slow, poorly collimated CO (2-1) outflow (Pineda et al., 2011). The discovery that L1448 IRS2E, Per-Bolo 58, and L1451-mm are not starless suggests that other “starless” cores have been misidentified and instead harbour deeply embedded VeLLOs that were not detected in wide-area near-infrared and mid-infrared surveys.
In this paper, we present evidence that the dense core Per-Bolo 45 (Enoch et al., 2006), despite non-detections in the 3.6-70 m range, is also protostellar. Per-Bolo 45 is located in the Perseus molecular cloud, near the center of the cluster NGC 1333 and between IRAS 7 (Jennings et al., 1987) to the northeast and SVS 13 (Strom et al., 1976) to the southwest. In §2 we describe new CARMA spectral line observations of Per-Bolo 45. The evidence that Per-Bolo 45 is protostellar is presented in §3. Some implications of the discoveries of embedded sources within Per-Bolo 45, Per-Bolo 58, L1448 IRS2E, and L1451-mm are discussed in §4, and our results are summarized in §5.
2. Observations
Here we present spectral line maps of the dense core Per-Bolo 45 made with the Combined Array for Research in Millimeter-wave Astronomy (CARMA). We made new observations of the 3 mm transitions of HCN, NH2D, SiO, HCO+, HNC, N2H+, and C34S at 5″ resolution, as described in §2.1. We discuss these observations in the context of the 3 mm continuum data previously published by Schnee et al. (2010) and described briefly in §2.2.
2.1. New CARMA Observations
Spectral line observations in the 3 mm window were obtained in July 2010 with CARMA, a 15 element interferometer consisting of nine 6.1 meter antennas and six 10.4 meter antennas. The CARMA correlator records signals in eight separate bands, each with an upper and lower sideband. We configured one band for maximum bandwidth (495 MHz with 95 channels per band) to observe continuum emission, providing a total continuum bandwidth of approximately 1 GHz. The other seven bands were configured to observe spectral lines and have 383 channels covering 7.8 MHz per band, providing native spectral resolution of 20.4 kHz (0.067 km s-1), which we smoothed to 0.1 km s-1 before analysis. The observations were centered around 90.7 GHz, and range from 85.9 GHz to 97.9 GHz. The half-power beam width of the 10.4 m antennas is 74″ at the observed frequencies. Seven-point mosaics were made toward the dense core Per-Bolo 45 (with the phase center located at J2000 3:29:07.7 +31:17:16.8, and rest velocity 8.483 km s-1) in the D and E-array configurations, with baselines that range from 11 m to 150 m. The largest angular scale to which the observations are sensitive is approximately 30″. A summary of the CARMA observations is presented in Table 1.
The observing sequence for the CARMA observations was to integrate on a phase calibrator (0336+323) for 3 minutes and Per-Bolo 45 for 21 minutes. The total time spent on this project was about 8 hours in each of the array configurations. In each set of observations, 3C84 was observed for passband calibration, and observations of Uranus were used for absolute flux calibration. Based on the repeatability of the quasar fluxes, the estimated random uncertainty in the measured source fluxes is %, and the systematic uncertainty is approximately 20%. Radio pointing was done at the beginning of each track and pointing constants were updated at least every two hours thereafter, using either radio or optical pointing routines (Corder et al., 2010). Calibration and imaging were done using the MIRIAD data reduction package (Sault et al., 1995).
Due to instrumental problems, the first correlator band was lost, so we have no data on the HCN (1-0) line. We detected no significant emission of the C34S (2-1) line, and it will not be discussed further in this paper.
2.2. Previous Observations
Per-Bolo 45 was included in a CARMA 3 mm continuum survey of 11 starless cores in the Perseus molecular cloud (Schnee et al., 2010). It is one of two cores that were detected, and has an integrated 3 mm flux density of 110.5 mJy, corresponding to a mass of 0.8 after making reasonable assumptions for the core and dust properties. See Schnee et al. (2010) for more details about the 3 mm continuum observations and the derived core properties.
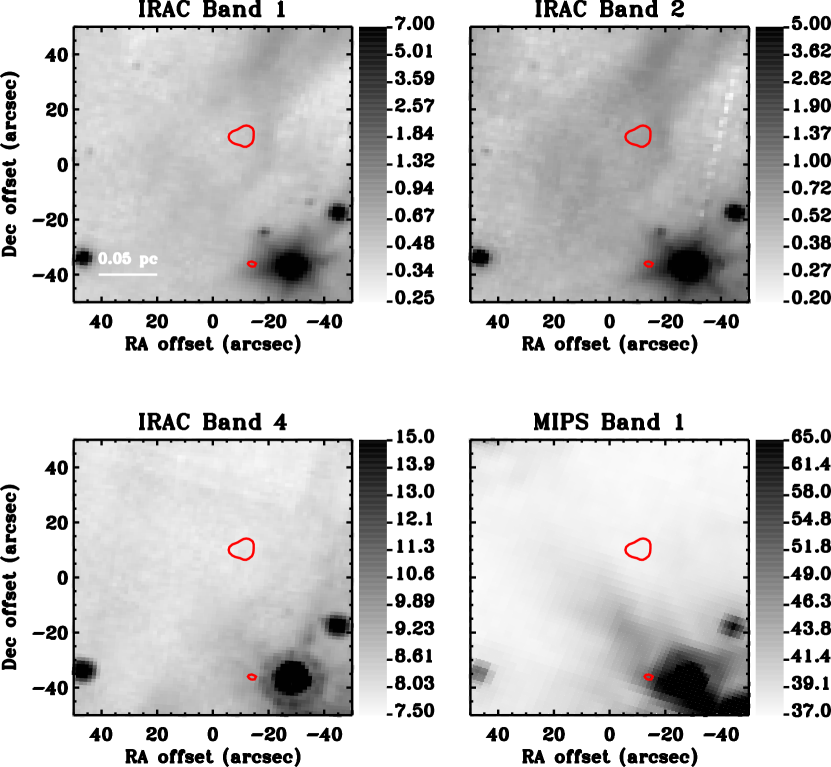
Per-Bolo 45 was classified as a starless core by Enoch et al. (2006, 2008). If a protostar was found within one full-width half-maximum (FWHM) of the center of the 1.1 mm Bolocam core (i.e., 31″, or 0.04 pc), then it was classified as protostellar, otherwise the Bolocam core was classified as starless. Protostars in Enoch et al. (2008) were identified by the shape of their near-infrared to far-infrared spectral energy distributions (SEDs), a minimum flux at 24 µm and the presence of 70 µm point sources not classified as galaxy candidates. Per-Bolo 45 was identified as a Class 0 protostar by Hatchell et al. (2007a) based on the colors of a nearby, but (we believe) unrelated, near-infrared source. There is a possible outflow from Per-Bolo 45 reported by Hatchell et al. (2007b), but due to confusion from nearby protostars this identification is given as tentative. In Jørgensen et al. (2007), cores were identified as protostellar based on either the presence of Spitzer detections and colors within a SCUBA core, or by the concentration of the light profile of the 850 µm SCUBA flux. Neither Jørgensen et al. (2007), Kirk et al. (2007), nor Dunham et al. (2008) found evidence for an embedded source in Per-Bolo 45, and it is classified as a starless core by Sadavoy et al. (2010a). In Fig. 1, we show Spitzer near-infrared and mid-infrared images of Per-Bolo 45 with CARMA 3 mm continuum overlays, and it is clear that there is no embedded point source detected by Spitzer associated within Per-Bolo 45. The area shown in Figures 1 - 6 is approximately the region in which the gain of the mosaic is greater than 0.5. Therefore, the true classification of Per-Bolo 45 is not clear from the literature, but most studies have labeled it “starless.”
3. Analysis
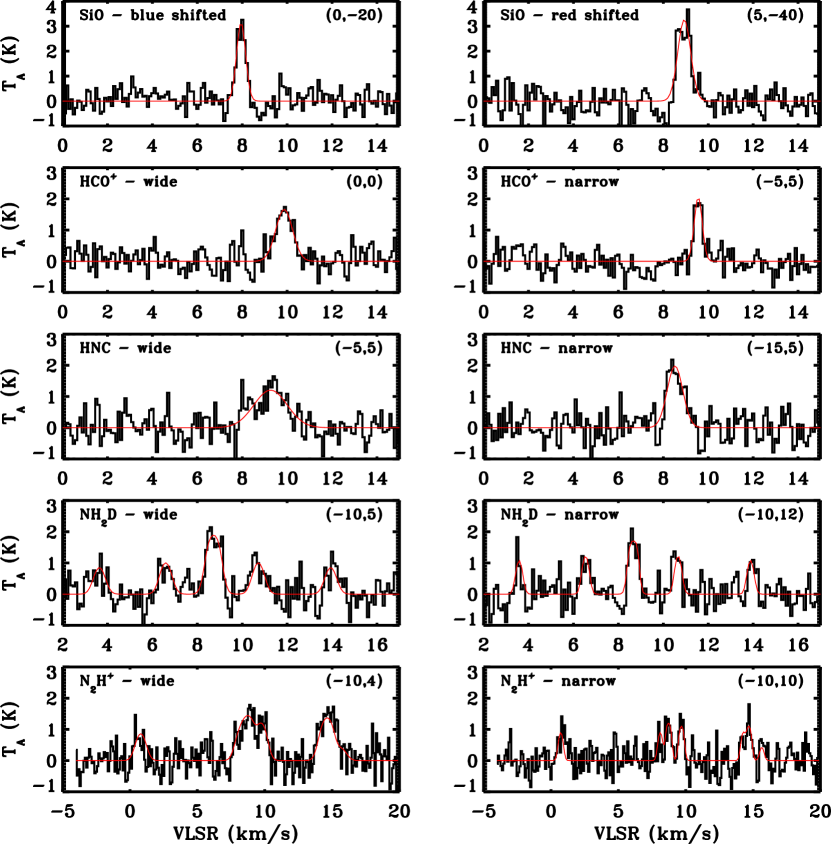
We study the kinematics and morphology of the dense core Per-Bolo 45 by fitting the line profiles of NH2D (11,1 - 10,1), SiO (2-1), HCO+ (1-0), HNC (1-0), and N2H+ (1-0) using the MPFIT package in IDL (Markwardt, 2009). Single Gaussians were fit to the SiO, HCO+, and HNC spectra, and multiple Gaussians were fit to the 7 components of the N2H+ spectra and 6 components of the NH2D spectra. Fits were only made to those profiles that had three independent velocity channels with a signal-to-noise ratio greater than 3.
3.1. Molecular Line Emission
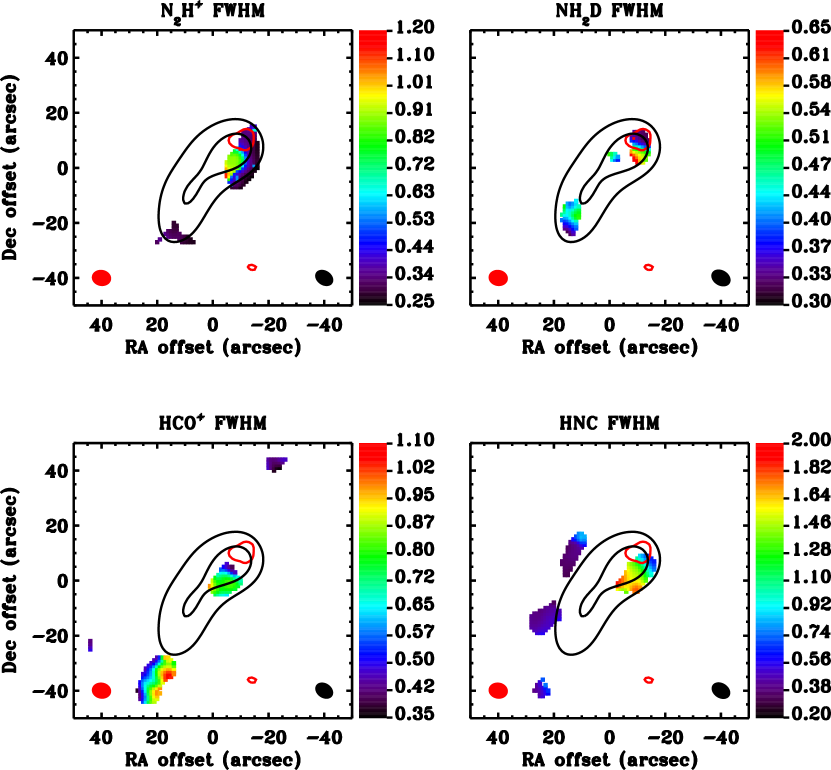
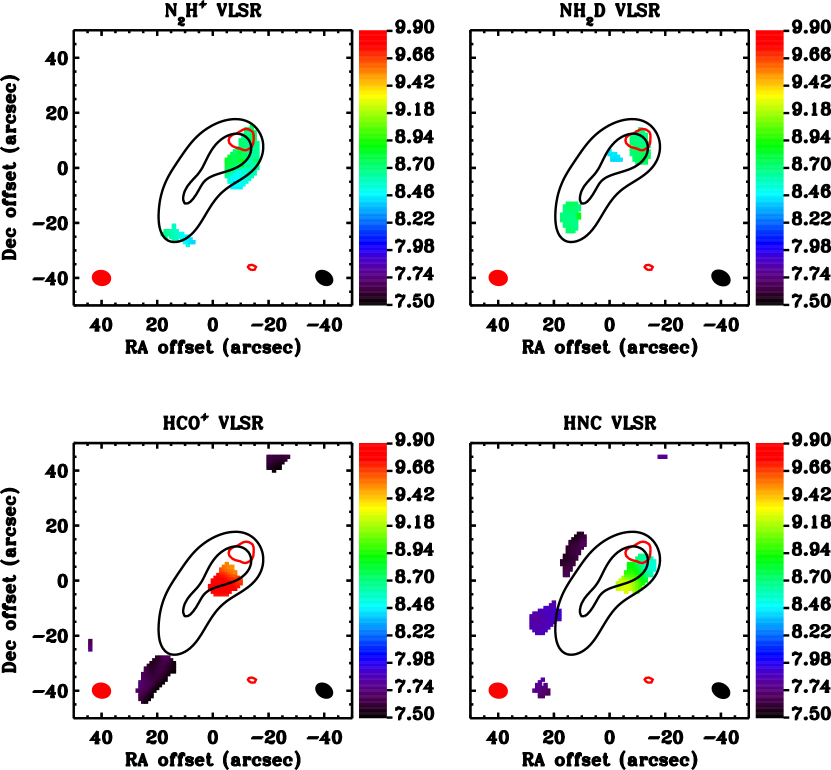
Starless cores are kinematically quiescent objects, with line widths broadened approximately equally by thermal and non-thermal motions. The thermal line widths (FWHM) for the molecular lines presented in this paper are 0.13 km s-1, assuming a typical temperature of 10 K (Schnee et al., 2009). The average non-thermal line width for NH3 in starless cores in the Perseus molecular cloud is greater than the thermal line width of NH3 by a factor of 1.5 (Foster et al., 2009). Broad line widths (FWHM 0.6 km s-1) in N2H+ and NH2D towards the 3 mm continuum peak of L1451-mm led Pineda et al. (2011) to hypothesize the presence of an embedded protostar in a core that had previously been considered starless, which was confirmed by detection of a CO (2-1) outflow. Similarly, velocity gradients in starless cores are small, with a typical value of 1 km s-1 pc-1 (Goodman et al., 1993). We would expect a total velocity gradient across Per-Bolo 45, which has a diameter no greater than 0.2 pc, to be 0.2 km s-1. Furthermore, we would expect the velocity field to be continuous, as seen in interferometric maps of the starless cores L183 (Kirk et al., 2009), L694-2 (Williams et al., 2006), and L1544 (Williams et al., 2006). The kinematics of Per-Bolo 45, as traced by N2H+, NH2D, HCO+, and HNC, are described in Section 3.1.1 and 3.1.2. Maps of the full-width half-maximum (FWHM) of N2H+, NH2D, HCO+, and HNC are shown in Figure 2, and the LSR velocity maps for N2H+, NH2D, HCO+, and HNC are shown in Figure 3. Example spectra demonstrating the variety of line profiles in Per-Bolo 45 are shown in Figure 4.
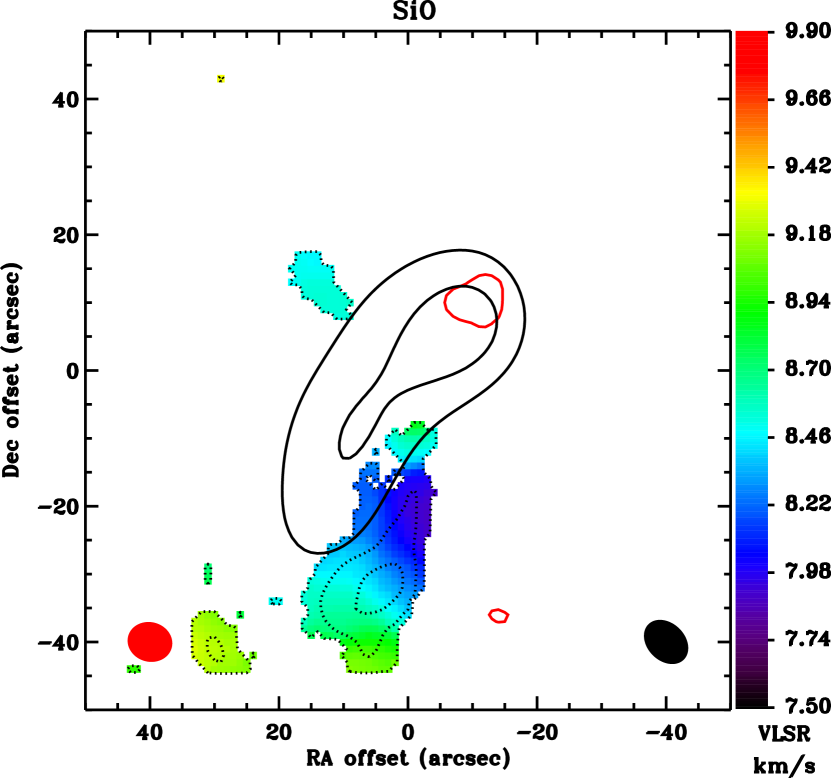
In the dense, cold, and quiescent interstellar medium, SiO is frozen onto the surfaces of dust grains except in regions shocked by outflows that return SiO to the gas phase and excite its emission (Martin-Pintado et al., 1992). The presence of SiO emission is therefore a good indicator of one or more nearby protostars. SiO emission can be grouped into two classes, one that has broad lines (10 km s-1) and is Doppler-shifted by velocities 10 km s-1 from the ambient cloud, and a second component with narrow lines (1 km s-1) found at velocities very close to the cloud material (e.g., Lefloch et al., 1998; Jiménez-Serra et al., 2004). The SiO maps of Per-Bolo 45 are discussed in Section 3.1.3 and presented in Figure 5.
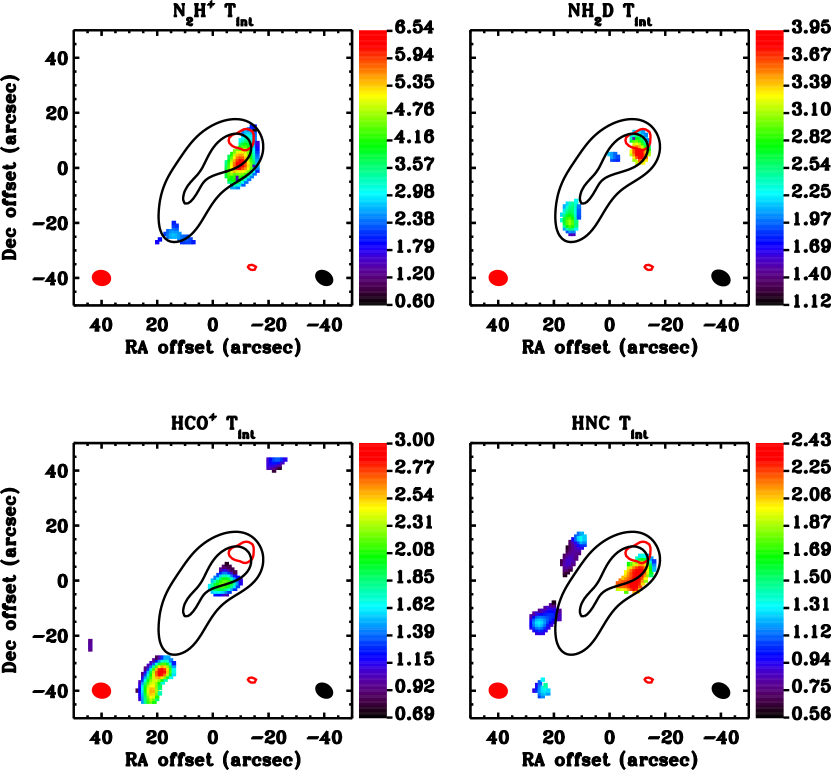
An 850 µm SCUBA map of the dense core Per-Bolo 45 was produced as part of SCUBA Legacy Catalogues (Di Francesco et al., 2008), and is shown in Figure 6 along with the 3 mm continuum emission and integrated intensity maps of N2H+, NH2D, HCO+, and HNC. Whereas the 3 mm continuum emission detected with CARMA has only one peak, the integrated intensity maps of N2H+, NH2D, HCO+, and HNC all have multiple peaks. The morphology of emission towards Per-Bolo 45 varies significantly between molecular lines, and this will be discussed below and presented in Figure 6.
3.1.1 N2H+ and NH2D
The line width of N2H+ in Per-Bolo 45 has a bimodal distribution, with narrow lines (0.3 km s-1) at the position of the dust peak and a small region of much broader (0.5-1.2 km s-1) line width a few arcseconds to the southeast of the dust peak. The line width of NH2D is qualitatively similar to that of N2H+, with a narrow line width at the dust peak and much broader width a few arcseconds to the southeast. We argue that the broad line widths (up to 1.2 km s-1) seen in N2H+ and NH2D towards Per-Bolo 45 point towards the presence of a protostar, which must be low luminosity to have not been detected in mid-infrared Spitzer maps (see § 3.2). The velocity fields of N2H+ and NH2D (as well as HCO+ and HNC) are shown in Fig. 3. The range of velocities seen in N2H+ and NH2D is fairly narrow and similar to the systemic velocity of the core as measured in the single dish maps.
Both N2H+ and NH2D are coincident with the 850 µm dust emission, but extend about 30″ to the southeast beyond the extent of the 3 mm continuum. In both lines the secondary peaks have narrow line widths typical of quiescent cores, so we suggest that this material is part of the envelope of Per-Bolo 45 that is not strongly affected by any outflow. The secondary peaks of N2H+ and NH2D are coincident with the elongation of the 850 µm dust emission seen in the SCUBA map, although they are not accompanied by a similar feature in the 3 mm continuum map. Discrepancies on small spatial scales between the dust emission and dense gas tracers have been seen before, for instance in the dense core Oph B (Friesen et al., 2009, 2010) and in Oph A-N6 (Pon et al., 2009). Furthermore, we show in this paper that the CARMA continuum maps are not sensitive to the emission from starless material.
3.1.2 HCO+ and HNC
The HCO+ integrated intensity map (see Fig. 6) shows two peaks, one immediately to the southeast of the dust peak and the other 40″ further to the southeast. The integrated intensity map of HNC shows a peak immediately to the southeast of the dust peak and also has three more peaks to the east and southeast of the 3 mm continuum emission. Two of the HNC emission peaks to the east and southeast have no counterparts in the dust emission or with the other features in molecular line maps. Both HCO+ and HNC show a broad range of velocities and both have line widths many times greater than the thermal line width, as shown in Figs. 2 and 3. In the case of HCO+, both redshifted and blueshifted emission are seen with a spread of 1 km s-1 from the systemic velocity of the core, and no emission is seen at the systemic velocity of Per-Bolo 45. The HNC emission adjacent to the 3 mm continuum peak is at the systemic velocity of the core and has broad line widths (up to 2 km s-1), while the other HNC peaks are blue-shifted and have narrow line widths.
Although the interpretation of the emission is complicated by dissimilarities between the morphologies of the emission, we argue that the broad line widths (up to 2 km s-1) and velocities Doppler-shifted from the systemic velocity of the core (by 1 km s-1 in the case of HCO+) are likely caused by an outflow driven by Per-Bolo 45. Neither kinematic feature would be expected in a starless core, as explained in Section 3.1. The regions of narrow line width seen in HNC and HCO+(as well as N2H+ and NH2D) likely trace the more quiescent gas in a dense envelope. HCO+ has been seen to trace outflows in the cluster NGC 1333 (e.g., Walsh et al., 2007), of which Per-Bolo 45 is a member. Given that HCN has been also seen to trace outflows in NGC 1333 (Jørgensen et al., 2004), it is reasonable to suggest that the broad line width HNC in Per-Bolo 45 traces an outflow as well. HNC has been seen to trace dense material around a protostar as well as material associated with the protostellar outflow (Arce & Sargent, 2004), so the appearance of both quiescent and turbulent HNC in Per-Bolo 45 is not unexpected if it harbors a protostar.
3.1.3 SiO
Per-Bolo 45 exhibits SiO emission, with 1 km s-1 line widths (see Fig. 4) and velocities within 1 km s-1 of the ambient medium (see Fig. 5). The systemic velocity of Per-Bolo 45 is 8.5 km s-1 (Kirk et al., 2007; Rosolowsky et al., 2008). The systemic velocity of the ISM around Per-Bolo 45, measured in an FCRAO map of CS (2-1) by the COMPLETE survey (Ridge et al., 2006), is 8.6 km s-1, with a 1.7 km s-1 line width. The velocity range of the SiO (2-1) emission towards Per-Bolo 45 is therefore entirely consistent with the range of velocities of the ambient material. The morphology of the SiO emission is perhaps suggestive, being extended with the long axis of the emission pointing towards the 3 mm continuum emission.
We interpret the detection of SiO (2-1) emission immediately adjacent to Per-Bolo 45 as further evidence for the presence of an embedded protostar. An outflow launched by a protostar in Per-Bolo 45 would liberate SiO from the dust in the ISM, creating the conditions required for the observed emission. Since we only detect the narrow component of SiO emission that traces the ambient cloud material, the velocity map shown in Fig. 5 is not sufficient to say for certain what portion of the outflow is exciting the emission. The velocity structure seen in Fig. 5 is likely that of the ISM around Per-Bolo 45, and not that of the outflow. The velocity range covered by the CARMA observations ( km s-1 VLSR 21 km s-1) was not wide enough to find the high-velocity, broad component of the SiO emission more closely associated with the outflow, if present.
3.1.4 The case for the protostellar nature of Per-Bolo 45
We have shown that Per-Bolo 45 exhibits several traits of protostellar cores, despite the non-detection of mid-infrared emission in IRAC and MIPS Spitzer maps (see Fig. 1). The line widths seen in N2H+, NH2D, HCO+, and HNC are several times larger than the thermal line width, behaviour not found in starless cores but which could be explained by the presence of an embedded protostar. Broad line widths of N2H+ and NH2D in L1451-mm led to the discovery of a protostar in that core even though it had previously been identified as starless (Pineda et al., 2011). The presence of redshifted and blueshifted HCO+ emission seen about 1 km s-1 from the systemic velocity of the core would also not be expected in a starless core, but could be explained by an outflow from an embedded protostar. SiO emission located adjacent to Per-Bolo 45 can be explained by the interaction between the ambient material in the molecular cloud and an outflow launched by the core. Finally, the 3 mm continuum emission detected towards Per-Bolo 45 is also suggestive of a possible embedded source, given that 3 mm continuum emission was detected with CARMA towards Per-Bolo 58 and L1541-mm, two supposedly “starless” cores that were subsequently found to be protostellar (Enoch et al., 2010; Dunham et al., 2011; Pineda et al., 2011). None of the other starless cores surveyed with CARMA by Schnee et al. (2010) exhibited 3 mm continuum emission.
Given that Per-Bolo 45 is in the NGC 1333 cluster, it is important to check that the outflow does not originate from another nearby protostar. The elongation of the SiO emission points back towards the HH 7-11 group associated with SVS 13, and even further perhaps towards IRAS 4, but each of these cores have well-known outflows going in directions other than towards Per-Bolo 45. For example, a CO (3-2) map of NGC 1333 shows no outflow directed towards Per-Bolo 45 from any other object (Curtis et al., 2010). Instead, Per-Bolo 45 seems to be adjacent to a compact red lobe emanating from IRAS 7 to the northeast and a very extended red lobe emanating from IRAS 2 in the southwest. These redshifted lobes have velocity ranges of 12 km s-1 to 18 km s-1 and their blueshifted lobes range from -5 kms to 3 km s-1, both outside the range of velocities associated with the redshifted and blueshifted HCO+ emission from Per-Bolo 45. It would also be difficult to explain how an outflow from elsewhere in the NGC 1333 cluster could interact with the dense material in Per-Bolo 45 traced by N2H+ and NH2D in such a way as to increase turbulence immediately to the south-east of the 3 mm continuum peak without also affecting the area with nearly thermal line widths around it. We conclude that the molecular line observations presented in this paper are best explained by the presence of a protostar embedded within Per-Bolo 45.
3.2. Embedded Source
A relationship between the internal luminosity of a young stellar object (YSO) and its 70 µm flux is given by Equation 2 in Dunham et al. (2008). Per-Bolo 45 is not detected at 70 µm, but we can use a 3 upper limit to its 70 µm flux to estimate an upper limit to the internal luminosity of the embedded source. We find that the internal luminosity of Per-Bolo 45 is less than , similar to the upper limit for L1451-mm by Pineda et al. (2011) and lower by a factor of about 10 than the luminosities of the embedded protostars observed by Spitzer with published models shown in Table 1 of Dunham et al. (2008). The upper limit to the luminosity of the embedded source in Per-Bolo 45 is consistent with the sensitivity limit of the c2d survey. Assuming that Per-Bolo 45 is protostellar, the lack of observed 70 µm flux would make this source a VeLLO by the definition given in Di Francesco et al. (2007). A protostellar source with a disk viewed edge-on might remain invisible at the observed sensitivity limits, so it is possible that the internal luminosity of Per-Bolo 45 is higher than that of a VeLLO and it appears dim because of the viewing angle. Given its low 70 µm luminosity, the source embedded in Per-Bolo 45 is also a plausible first hydrostatic core candidate.
4. Discussion
In this paper we identify Per-Bolo 45 as a core with an embedded source, changing its classification from starless core (Enoch et al., 2008) to VeLLO. Other cores in the Perseus molecular cloud, previously identified as starless due to their lack of near- and mid-infrared emission (e.g. Enoch et al., 2008; Sadavoy et al., 2010a) but subsequently found to show evidence for protostellar activity, such as launching molecular outflows, include Per-Bolo 58 (Enoch et al., 2010; Dunham et al., 2011) , L1448 IRS2E (Chen et al., 2010), and L1451-mm (Pineda et al., 2011).
Out of the 11 “starless” cores in Perseus surveyed by Schnee et al. (2010) with interferometric observations of their 3 mm continuum, the only two cores detected (Per-Bolo 45 and Per-Bolo 58) have since been shown to harbour embedded objects. This fraction of misidentified starless cores in Perseus, 2/11 or 18%, is probably an upper limit given that the cores in the Schnee et al. (2010) sample were chosen to have high surface brightnesses in the 1.1 mm continuum map of Enoch et al. (2006), and the presence of a protostar would increase the peak flux of a dense core.
A lower limit to the number of cores in Perseus misidentified as starless can be derived from the number of previously identified starless cores and the number of newly identified protostars and VeLLOs. This estimate provides a lower limit because not every core identified in wide-field dust continuum maps of Perseus has been followed up with (sub)millimeter interferometric molecular line observations to find outflows. Sadavoy et al. (2010a) find 97 starless cores and 46 protostellar cores in Perseus, using SCUBA 850 µm maps to identify the cores and Spitzer maps between 3.6 and 70 µm to determine the starless or protostellar status of each core. Jørgensen et al. (2007) and Enoch et al. (2008) find similar numbers of starless cores and protostars using similar techniques. Although the census of protostellar cores and starless cores detected by Herschel has not yet been released for the Perseus molecular cloud, a 2:1 ratio of prestellar cores to protostellar cores in the Aquila rift was reported by Könyves et al. (2010) and Bontemps et al. (2010), in good agreement with the pre-Herschel studies of Perseus described above. Considering the four newly-identified VeLLOs in Perseus, a lower limit of 4/97 “starless” cores, or 4%, have been misclassified. Our upper limit of 18% would imply that 17 cores have been misclassified as starless. We note that it is likely that not all of the dense cores in Perseus have been identified, given that the published (sub)millimeter surveys used to identify such cores have had limited sensitivity to faint and extended structures.
The lifetime of starless cores can be estimated from the relative number of starless cores and protostellar cores, given a reasonable estimate of the protostellar lifetime and assuming that the rate of star formation is constant over time. Enoch et al. (2008) found that a mean lifetime for starless cores in nearby molecular clouds is Myr, so the 20% change in the number of starless cores in Perseus resulting from the discovery of embedded sources in previously identified “starless” cores is roughly comparable to the uncertainty coming from other systematics in the estimate of starless core lifetimes.
Similarly, increasing the number of protostars increases the resultant protostellar lifetime. Evans et al. (2009) found 87 Class 0/I protostars in the Perseus molecular cloud, so adding 4-17 more sources into the Class 0/I category would increase the Class 0/I lifetime by 5-20%. This increase in the Class 0/I lifetime would not significantly affect modelling of the expected accretion luminosity averaged over the lifetime of a protostellar core, given the significant uncertainties on both the observational and theoretical sides of the problem, as summarized in Offner & McKee (2011).
Many studies of nearby molecular clouds (e.g., Motte et al., 1998; Nutter & Ward-Thompson, 2007; Ward-Thompson et al., 2007; Enoch et al., 2008; Könyves et al., 2010) have shown that the starless core mass function (CMF) has a similar shape to the stellar initial mass function (IMF). These studies depend on the ability to distinguish starless dense cores from protostellar dense cores. Hatchell & Fuller (2008), Enoch et al. (2008) and Di Francesco et al. (2010) each found that their most massive cores tended to be protostellar, which suggests that either prestellar cores have an upper mass limit, consistent with gravitational stability inequalities (e.g., Jeans analysis), or that the more massive prestellar cores have very short lifetimes. Furthermore, Sadavoy et al. (2010b) found that the most massive “starless” cores in Orion and Perseus had ambiguous infrared emission towards them and thus, changed their classification to “undetermined.” If the most massive “starless” cores tend to be misclassified VeLLOs, then the CMF will lack the massive core tail found in the IMF. This difference will steepen the starless CMF slope with respect to the IMF slope, i.e., the two mass functions will have different shapes.
Three of the VeLLOs in Perseus (Per-Bolo 45, Per-Bolo 58, and L1448 IRS2e) were included in the Sadavoy et al. (2010b) investigation into the gravitational stability of starless cores in Perseus. None of these sources were found to be particularly unstable. Instead, they reside, along with the majority of starless cores, in a mass range of 1-3 Jeans masses (see Sadavoy et al., 2010b, for details on how the stability analysis was performed). The only possible hint that these cores are unique is that all three have relatively small sizes (compared with other cores at similar level of Jeans instability). That these cores are not clearly distinguishable by a Jeans analysis further suggests that deep mid-infrared and interferometric observations will be required to uncover the majority of VeLLOs. Given that only a few “starless” cores have been proven to be misclassified, and that these cores do not stand out as being especially massive, the shape of the CMF, as discussed above, has not been biased by the presence of low-luminosity protostellar objects.
In a 3 mm continuum survey of 11 “starless” cores, Schnee et al. (2010) found that only two (Per-Bolo 45 and Per-Bolo 58) were detected and concluded that the density distribution in starless cores must be smooth and not strongly peaked. The subsequent discovery that both cores are actually VeLLOs (Enoch et al., 2010; Dunham et al., 2011, this paper) strengthens the claim that starless cores in Perseus have smooth and shallow density profiles. A shallow inner density profile in starless cores has been previously reported by several groups, (e.g., Ward-Thompson et al., 1994, 1999; Shirley et al., 2000). Had the starless cores in our Perseus sample been in the process of fragmentation, we would have been able to detect the resultant fragments in the dust emission maps.
Although Spitzer surveys were more sensitive than those conducted with previous instruments and found embedded objects in cores that had been identified as starless (Young et al., 2004; Kauffmann et al., 2005; Bourke et al., 2006), it is also true that deeply embedded protostars can be missed at wavelengths less than 12 µm (Jørgensen et al., 2008) by surveys like c2d (Evans et al., 2003). In addition, Dunham et al. (2008) have found that there is likely to be a population of VeLLOs too faint to have been detected in current surveys. New Herschel observations will be able to find fainter protostars than Spitzer was able to detect, and in the Aquila region seven of the 50 Class 0 protostars detected by Herschel were missed by Spitzer (Bontemps et al., 2010). Still, Bontemps et al. (2010) reported that compact sources in Aquila were identified down to the Herschel 70 µm detection limit, implying that a population of even fainter sources have yet to be discovered. Given that low-luminosity embedded objects can be found through high-resolution observations of their dust continuum emission and molecular outflows, we suggest that interferometric (sub)millimeter observations are a promising method for determining what fraction of “starless” cores have been misclassified.
5. Summary
In this paper, we report on CARMA maps of the 3 mm continuum and 3 mm window spectral lines of NH2D, SiO, HCO+, HNC, and N2H+. Our main results are:
-
•
Despite non-detections in Spitzer maps at 3.6-24 µm, Per-Bolo 45 is a protostellar core, as inferred from large line widths, Doppler-shifted emission, and the presence of SiO emission.
-
•
There are at least four cores in Perseus, previously identified as starless, that recent observations have shown to contain low-luminosity embedded objects with molecular outflows (Chen et al., 2010; Enoch et al., 2010; Dunham et al., 2011; Pineda et al., 2011). If this result can be generalized to other nearby molecular clouds, we estimate that the lifetime of starless cores has been overestimated by 4-18% and the lifetime of Class 0/I protostars has been underestimated by 5-20%. These changes are within the previously published uncertainties of starless and protostellar core lifetimes (Enoch et al., 2008; Evans et al., 2009).
-
•
Although recent infrared surveys of nearby molecular clouds have made great progress towards classifying starless and protostellar cores (e.g., Hatchell et al., 2007a; Jørgensen et al., 2007, 2008; Enoch et al., 2008; Dunham et al., 2008; Evans et al., 2009; Sadavoy et al., 2010a; Könyves et al., 2010; Bontemps et al., 2010), we suggest that an improved census will require high-resolution (sub)millimeter observations to survey known cores and identify embedded low-luminosity objects and outflows.
References
- Arce et al. (2010) Arce, H. G., Borkin, M. A., Goodman, A. A., Pineda, J. E., & Halle, M. W. 2010, ApJ, 715, 1170
- Arce & Sargent (2004) Arce, H. G., & Sargent, A. I. 2004, ApJ, 612, 342
- Bontemps et al. (2010) Bontemps, S., André, P., Könyves, V., et al. 2010, A&A, 518, L85
- Boss & Yorke (1995) Boss, A. P., & Yorke, H. W. 1995, ApJ, 439, L55
- Bourke et al. (2006) Bourke, T. L., Bourke, Myers, P. C., Evans, N.J., II, et al. 2006, ApJ, 649, L37
- Chen et al. (2010) Chen, X., Arce, H. G., Zhang, Q., et al. 2010, ApJ, 715, 1344
- Corder et al. (2010) Corder, S. A., Wright, M. C. H., & Carpenter, J. M. 2010, Proc. SPIE, 7733,
- Curtis et al. (2010) Curtis, E. I., Richer, J. S., Swift, J. J., & Williams, J. P. 2010, MNRAS, 408, 1516
- Di Francesco et al. (2010) Di Francesco, J., Sadavoy, S., Motte, F., et al. 2010, A&A, 518, L91
- Di Francesco et al. (2008) Di Francesco, J., Johnstone, D., Kirk, H., MacKenzie, T., & Ledwosinska, E. 2008, ApJS, 175, 277
- Di Francesco et al. (2007) Di Francesco, J., Evans, N. J., II, Caselli, P., et al. 2007, Protostars and Planets V, B. Reipurth, D. Jewitt, and K. Keil (eds.), University of Arizona Press, Tucson, p.17-32
- Dunham et al. (2011) Dunham, M. M., Chen, X., Arce, H. G., et al. 2011, ApJ, 742, 1
- Dunham et al. (2008) Dunham, M. M., Crapsi, A., Evans, N. J., II, Bourke, T. L., Huard, T. L., Myers, P. C., & Kauffmann, J. 2008, ApJS, 179, 249
- Enoch et al. (2010) Enoch, M. L., Lee, J.-E., Harvey, P., Dunham, M. M., & Schnee, S. 2010, ApJ, 722, L33
- Enoch et al. (2009) Enoch, M. L., Evans, N. J., II, Sargent, A. I., & Glenn, J. 2009, ApJ, 692, 973
- Enoch et al. (2008) Enoch, M. L., Evans, N. J., II, Sargent, A. I., et al. 2008, ApJ, 684, 1240
- Enoch et al. (2006) Enoch, M. L., Young, K. E., Glenn, J., et al. 2006, ApJ, 638, 293
- Evans et al. (2009) Evans, N. J., Dunham, M. M., J rgensen, J. K., et al. 2009, ApJS, 181, 321
- Evans et al. (2003) Evans, N. J., II, Allen, L. E., Blake, G. A., et al. 2003, PASP, 115, 965
- Foster et al. (2009) Foster, J. B., Rosolowsky, E. W., Kauffmann, J., et al. 2009, ApJ, 696, 298
- Friesen et al. (2009) Friesen, R. K., Di Francesco, J., Shirley, Y. L., & Myers, P. C. 2009, ApJ, 697, 1457
- Friesen et al. (2010) Friesen, R. K., Di Francesco, J., Shimajiri, Y., & Takakuwa, S. 2010, ApJ, 708, 1002
- Goodman et al. (1993) Goodman, A. A., Benson, P. J., Fuller, G. A., & Myers, P. C. 1993, ApJ, 406, 528
- Hatchell & Fuller (2008) Hatchell, J., & Fuller, G. A. 2008, A&A, 482, 855
- Hatchell et al. (2007a) Hatchell, J., Fuller, G. A., Richer, J. S., Harries, T. J., & Ladd, E. F. 2007, A&A, 468, 1009
- Hatchell et al. (2007b) Hatchell, J., Fuller, G. A., & Richer, J. S. 2007, A&A, 472, 187
- Jennings et al. (1987) Jennings, R. E., Cameron, D. H. M., Cudlip, W., & Hirst, C. J. 1987, MNRAS, 226, 461
- Jessop & Ward-Thompson (2000) Jessop, N. E., & Ward-Thompson, D. 2000, MNRAS, 311, 63
- Jiménez-Serra et al. (2004) Jiménez-Serra, I., Martín-Pintado, J., Rodríguez-Franco, A., & Marcelino, N. 2004, ApJ, 603, L49
- Jørgensen et al. (2008) Jørgensen, J. K., Johnstone, D., Kirk, H., et al. 2008, ApJ, 683, 822
- Jørgensen et al. (2007) Jørgensen, J. K., Johnstone, D., Kirk, H., & Myers, P. C. 2007, ApJ, 656, 293
- Jørgensen et al. (2004) Jørgensen, J. K., Hogerheijde, M. R., Blake, G. A., et al. 2004, A&A, 415, 1021
- Kauffmann et al. (2005) Kauffmann, J., Bertoldi, F., Evans, N. J., II, & the C2D Collaboration 2005, Astronomische Nachrichten, 326, 878
- Kirk et al. (2009) Kirk, J. M., Crutcher, R. M., & Ward-Thompson, D. 2009, ApJ, 701, 1044
- Kirk et al. (2007) Kirk, H., Johnstone, D., & Tafalla, M. 2007, ApJ, 668, 1042
- Könyves et al. (2010) Könyves, V., André, P., Men’shchikov, A., et al. 2010, A&A, 518, L106
- Lefloch et al. (1998) Lefloch, B., Castets, A., Cernicharo, J., & Loinard, L. 1998, ApJ, 504, L109
- Lovas (1992) Lovas, F. J. 1992, Journal of Physical and Chemical Reference Data, 21, 181
- Markwardt (2009) Markwardt, C. B. 2009, Astronomical Data Analysis Software and Systems XVIII, 411, 251
- Martin-Pintado et al. (1992) Martin-Pintado, J., Bachiller, R., & Fuente, A. 1992, A&A, 254, 315
- Motte et al. (1998) Motte, F., Andre, P., & Neri, R. 1998, A&A, 336, 150
- Nutter & Ward-Thompson (2007) Nutter, D., & Ward-Thompson, D. 2007, MNRAS, 374, 1413
- Offner & McKee (2011) Offner, S. S. R., & McKee, C. F. 2011, ApJ, 736, 53
- Omukai (2007) Omukai, K. 2007, PASJ, 59, 589
- Pineda et al. (2011) Pineda, J. E., Arce, H. G., Schnee, S., et al. 2011, arXiv:1109.1207
- Pon et al. (2009) Pon, A., Plume, R., Friesen, et al. 2009, ApJ, 698, 1914
- Ridge et al. (2006) Ridge, N. A., Di Francesco, J., Kirk, H., et al. 2006, AJ, 131, 2921
- Rosolowsky et al. (2008) Rosolowsky, E. W., Pineda, J. E., Foster, J. B., et al. 2008, ApJS, 175, 509
- Sadavoy et al. (2010a) Sadavoy, S. I., Di Francesco, J., Bontemps, S., et al. 2010, ApJ, 710, 1247
- Sadavoy et al. (2010b) Sadavoy, S. I., Di Francesco, J., & Johnstone, D. 2010, ApJ, 718, L32
- Saigo et al. (2008) Saigo, K., Tomisaka, K., & Matsumoto, T. 2008, ApJ, 674, 997
- Sault et al. (1995) Sault, R. J., Teuben, P. J., & Wright, M. C. H. 1995, Astronomical Data Analysis Software and Systems IV, 77, 433
- Schnee et al. (2010) Schnee, S., Enoch, M., Johnstone, D., et al. 2010, ApJ, 718, 306
- Schnee et al. (2009) Schnee, S., Rosolowsky, E., Foster, J., Enoch, M., & Sargent, A. 2009, ApJ, 691, 1754
- Schöier et al. (2005) Schöier, F. L., van der Tak, F. F. S., van Dishoeck, E. F., & Black, J. H. 2005, A&A, 432, 369
- Shirley et al. (2000) Shirley, Y. L., Evans, N. J., II, Rawlings, J. M. C., & Gregersen, E. M. 2000, ApJS, 131, 249
- Strom et al. (1976) Strom, S. E., Vrba, F. J., & Strom, K. M. 1976, AJ, 81, 314
- Tafalla et al. (2004) Tafalla, M., Myers, P. C., Caselli, P., & Walmsley, C. M. 2004, A&A, 416, 191
- Tiné et al. (2000) Tiné, S., Roueff, E., Falgarone, E., Gerin, M., & Pineau des Forêts, G. 2000, A&A, 356, 1039
- Tomida et al. (2010) Tomida, K., Machida, M. N., Saigo, K., Tomisaka, K., & Matsumoto, T. 2010, ApJ, 725, L239
- Walsh et al. (2007) Walsh, A. J., Myers, P. C., Di Francesco, J., et al. 2007, ApJ, 655, 958
- Ward-Thompson et al. (2007) Ward-Thompson, D., André, P., Crutcher, R., et al. 2007, Protostars and Planets V, B. Reipurth, D. Jewitt, and K. Keil (eds.), University of Arizona Press, Tucson, p.33-46
- Ward-Thompson et al. (1999) Ward-Thompson, D., Motte, F., & Andre, P. 1999, MNRAS, 305, 143
- Ward-Thompson et al. (1994) Ward-Thompson, D., Scott, P. F., Hills, R. E., & Andre, P. 1994, MNRAS, 268, 276
- Werner et al. (2004) Werner, M. W., Roellig, T. L., Low, F. J., et al. 2004, ApJS, 154, 1
- Williams et al. (2006) Williams, J. P., Lee, C. W., & Myers, P. C. 2006, ApJ, 636, 952
- Young et al. (2004) Young, C. H., Jørgensen, J.K., Shirley, Y. L., et al. 2004, ApJS, 154, 396
| Line | 11Rest frequency | beam size | rms22Per beam, in a 0.1 km s-1 channel |
|---|---|---|---|
| GHz | ″ | K | |
| NH2D (11,1 - 10,1 F=2-2) | 85.926270333Tiné et al. (2000) | 7.45.5 | 0.45 |
| SiO (2-1) | 86.8469644Schöier et al. (2005) | 7.65.7 | 0.42 |
| HCO+ (1-0) | 89.18852344Schöier et al. (2005) | 6.95.3 | 0.42 |
| HNC (1-0) | 90.66356844Schöier et al. (2005) | 7.25.4 | 0.42 |
| N2H+ (1-0) F1=2-1 F=3-2 | 93.17377755Lovas (1992) | 7.05.3 | 0.46 |
| C34S (2-1) | 96.412949544Schöier et al. (2005) | 6.94.9 | 0.47 |