Hole polaron formation and migration in olivine phosphate materials
Abstract
By combining first principles calculations and experimental XPS measurements, we investigate the electronic structure of potential Li-ion battery cathode materials LiMPO4 (M=Mn,Fe,Co,Ni) to uncover the underlying mechanisms that determine small hole polaron formation and migration. We show that small hole polaron formation depends on features in the electronic structure near the valence-band maximum and that, calculationally, these features depend on the methodology chosen for dealing with the correlated nature of the transition-metal -derived states in these systems. Comparison with experiment reveals that a hybrid functional approach is superior to GGA+U in correctly reproducing the XPS spectra. Using this approach we find that LiNiPO4 cannot support small hole polarons, but that the other three compounds can. The migration barrier is determined mainly by the strong or weak bonding nature of the states at the top of the valence band, resulting in a substantially higher barrier for LiMnPO4 than for LiCoPO4 or LiFePO4.
I Introduction
LiFePO4 is an olivine structured material with many properties that make it attractive for usage as a cathode in Li-ion rechargeable batteries. It is composed of inexpensive starting materials, and the existence of a stable end compound, FePO4, allows for full withdrawal of Li ions.Padhi et al. (1997) However, the intrinsic electronic conductivity of = 1.8x10⁻⁸ S/cm is prohibitively low,Yonemura et al. (2004) so that special processing techniques, such as nanostructuring, coating with carbon or doping with supervalent cations must be employed in order to make the material suitable for electrochemical cycling.Chung et al. (2002); Dominko et al. (2005); Delacourt et al. (2006); Herle et al. (2004) The underlying mechanism by which these techniques are successful is still hotly debated,Ravet et al. (2003); Chung et al. (2003, 2010); Hamelet et al. (2011); Kang and Ceder (2009); Zaghib et al. (2009) but whatever it is, the conductivity can be reliably raised by a factor of 106-108, rendering LiFePO4 an excellent, cycleable cathode material. LiMnPO4, LiCoPO4, and LiNiPO4 are all isostructural to LiFePO4 and have higher voltages, both calculated and measured Padhi et al. (1997); Amine et al. (2000); Zhou et al. (2004a); Wolfenstine and Allen (2005), suggesting they could be used as cathode materials with even more overall energy than LiFePO4. Unfortunately, these materials have similar or even poorer intrinsic conductivities,Oh et al. (2010); Wolfenstine et al. (2005); Tadanaga et al. (2003); Prabu et al. (2011) measured at (LiMnPO4) S/cm, (LiCoPO4) S/cm, and (LiNiPO4) S/cm. To compound the problem, techniques to raise these numbers have been only moderately successfulWolfenstine (2006); Kumar et al. (2011); Prabu et al. (2011). The conductivities can be raised by 102-105, but problems of strong capacity fade, perhaps associated with the still high resisitivity, continue to hamper their usefulness as practical cathode materials.
The olivine phosphates are now widely understood to be wide band-gap materials that exhibit polaronic rather than band-like transport.Zhou et al. (2004b); Zaghib et al. (2007); Hoang and Johannes (2011) Their electrochemically active center is the transition-metal ion with formal valency 2+ in the stoichiometric compound, that becomes 3+ upon withdrawal of a Li ion and associated electron or when, e.g., Li vacancies are created during synthesisHoang and Johannes (2011). The resulting localized hole and consequent contraction of the surrounding O ions are together known as a small hole polaron. In order to move through the crystal, the small polaron must hop from one transition-metal site to another. The barrier to this hopping creates the activated transport seen in experiment.Zhou et al. (2004b); Ellis et al. (2006); Zaghib et al. (2007)
In this work, we use first principles density-functional theory (DFT) and x-ray photoemission spectroscopy (XPS) to examine the effect of the electronic structure of LiMPO4 (M=Mn,Fe,Co,Ni) on small hole polaron formation and migration with the goal of understanding the differences in measured conductivities and potentially pinpointing techniques to raise them. We find that, calculationally, the formation of small hole polarons depends on which approximation to the exchange correlation functional is used. By comparing finely detailed features of the density of states (DOS) in our computational results to careful XPS measurements, we can determine which methodology provides the best agreement with the true electronic structure. We determine that the use of a hybrid functional that allows localization of electrons on both transition-metal and oxygen sites is necessary to reproduce the observed binding energies. Using this functional, we calculate formation energies and migration barriers for small hole polarons in each of the compounds. We find, in good agreement with experiment, that LiFePO4 hole polarons have the highest tendency to hop, followed by LiCoPO4 and LiMnPO4. We find that small hole polaron formation is highly unlikely in LiNiPO4, which may also become electronically unstable with any significant delithiation. The migration barriers depend strongly on the lattice distortion which, in turn, is determined by details of strong and weak bonding states formed with surrounding oxygen ions.
II Methodology
II.1 Computational
Our calculations employ the projector augmented wave method,Blochl (1994); Kresse and Joubert (1999) as implemented in the VASP code.Kresse and Furthmuller (1996a, b) For the exchange correlation potential, we use the Perdew-Burke-Ernzerhof version of the generalized gradient approximation (PBE-GGA),Perdew et al. (1996) the GGA+U correctionLiechtenstein et al. (1995) (U values were taken from the calculations of Zhou et al. Zhou et al. (2004c)), and the Heyd-Scuseria-Ernzerhof hybrid functional (HSE06).Heyd et al. (2003); Paier et al. (2006) The structures are fully relaxed within each type of calculation. The nudged elastic band (NEB)Mills et al. (1995) method was used to calculate the migration barrier of a polaron moving from one site to another.
To obtain our calculated binding energy spectra, we projected out the character of each ion from the DOS, and adjusted its intensity according to the Scofield cross-sections for x-raysScofield (1976) at 1487 eV, relative to the intensity of the transition-metal ion. The adjusted partial DOS are then summed and convolved with a Gaussian function to approximate the temperature broadening seen in experiment. This spectra is compared to the experimental binding energies measured by XPS.
II.2 Experimental
LiMnPO4 was prepared by a hydrothermal method using urea hydrolysis as the source of hydroxide ions.Allen et al. (2009) MnSOH2O, Li2SOH2O, 85% H3PO4 and urea were dissolved in enough water to make a 20 mL clear solution. The molar ratio, Li:Mn:PO4:urea, was 1:1:1:1.5. The solution was heated to 200∘ C in sealed, Teflon-lined, 45 mL autoclave for 15 hours. The product was isolated by centrifuge and dried under vacuum at 80∘ C. Phase purity was determined via x-ray powder diffraction using a Rigaku Ultima III x-ray diffractometer in a parallel beam geometry. Lattice constants were determined via Rietveld refinement of the parallel beam x-ray data using the Riqas program. Lattice constants of the obtained LiMnPO4, in spacegroup P, were = 10.456 , = 4.7503 , = 6.1006 , unit cell volume = 302.99 . LiFePO4 was prepared similarly using FeSO7H2O in place of MnSOH2O. The lattice constants of the obtained LiFePO4 were =10.3180 , =4.6901 , = 5.9960 , unit cell volume = 290.17 . LiCoPO4 samples were prepared via a citrate complexation route.Allen et al. (2011) Co(OH)2, LiH2PO4, and citric acid, 1, 1.01, 1.02, molar ratio, respectively, were mixed into deionized water until all solids were dissolved. The resulting solution was evaporated to dryness via a microwave oven. The resulting dried mass was removed, ground lightly with mortar and pestle and heated in air at a rate of 10∘ C min-1 to 600∘ C and the reactant mixture was held at this temperature for 12 h. Lattice constants were = 10.1950 , = 5.9179 , = 4.6972 for a unit cell volume of 283.40 . LiNiPO4 was obtained from the solid state reaction of LiH2PO4 with Ni(OH)2. The starting materials were mixed in a stoichiometric ratio via a mortar and pestle. The mixture was heated at 325∘ C for 12 hours, 500∘ C for 8 hours, 600∘ C for 12 hours and 700∘ C for 12 hours with intermittent grinding. All heating steps were done in air. Lattice constants were = 10.0319 , = 5.8522 , = 4.6779 , unit cell volume of 274.63 .
XPS spectra were acquired using a Kratos Axis 165 x-ray photoelectron spectrometer operating in hybrid mode, using monochromatic Al k radiation (1486.6 eV) at 220 W. The powder samples were attached to the sample holder using double sided conductive copper tape, charge neutralization was required to minimize sample charging. The spectrometer was at 5 x 10⁻⁸ Torr or lower throughout data collection. Survey spectra and Valence band high resolution spectra were collected with pass energies of 160 eV and 20 eV respectively. All data were calibrated to the hydrocarbon contamination peak at 284.8 eV.
III Results
III.1 Electronic structure and hole polaron formation
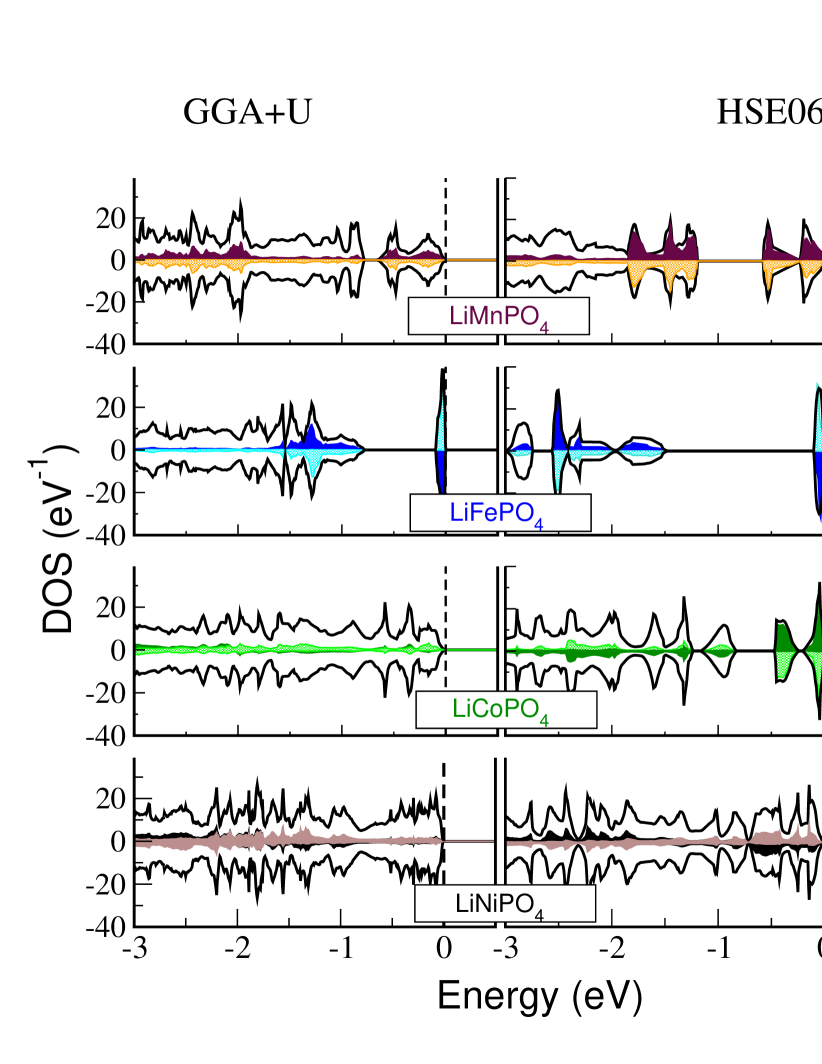
Since the creation of a hole polaron involves removing an electron from the valence-band maximum (VBM), the nature of the electronic states at and near the VBM is crucial in determining if the polaron can be formed.Hoang and Johannes (2011) We have identified the following two criteria that are necessary to computationally establish small hole polarons in the olivine phosphate materials: (1) There must be a narrow band at the VBM that produces a sharp peak in the DOS, with a finite gap separating it from the broad continuum of states below it; and (2) the composition of this band must be predominantly transition-metal-derived, with O-derived character comprising less than approximately 1/3 of the total. Furthermore, some corrective method must be applied to deal with the correlated transition-metal-derived states. In uncorrected GGA, these are overpenalized for localization and immediately delocalize throughout the crystal, whether or not the two aforementioned criteria are satisfied. In Fig. 1, we plot the total DOS, as well as the partial DOS (shaded region) that comes from transition metal character (remaining character may be assumed to be oxygen) for the four olivine phosphate compounds. As can be seen in Fig. 1 and Table 1, both criteria are filled for LiFePO4, regardless of which exchange correlation potential is used (GGA+U or HSE06). For LiMnPO4 and LiCoPO4, only the first criterion is filled, while the second depends on which methodology is applied. The difference between the two results is significant: if oxygen character dominates at the VBM, the hole created upon electron withdrawal will be delocalized, whereas if transition-metal character dominates, small hole polarons can form and there will be a typical redox center. Furthermore, the predominance of oxygen character at the VBM means that withdrawal of an electron produces oxygen ions that differ significantly from their preferred 2- valency, electronically destabilizing the compound and resulting in a tendency towards oxygen recombination and release as gas.Goodenough and Kim (2010); Love et al. (2011) For LiNiPO4 neither correction produces the necessary features. In the GGA+U calculation, the Ni character has been pushed well below the oxygen states, leaving almost none at the VBM. Although some Ni remains at the VBM in HSE06, the dominant contribution is still oxygen. Therefore, small hole polaron formation cannot be achieved. This indicates that electronic transport in this compound must proceed via another mechanism, and that electronic instability during charging is likely.
| Transition metal character at VBM | |||
| GGA | GGA+U | HSE06 | |
| LiMnPO4 | 71% | 39% | 60% |
| LiFePO4 | 88% | 85% | 89% |
| LiCoPO4 | 87% | 8% | 78% |
| LiNiPO4 | 94% | 9% | 34% |
III.2 XPS binding energies
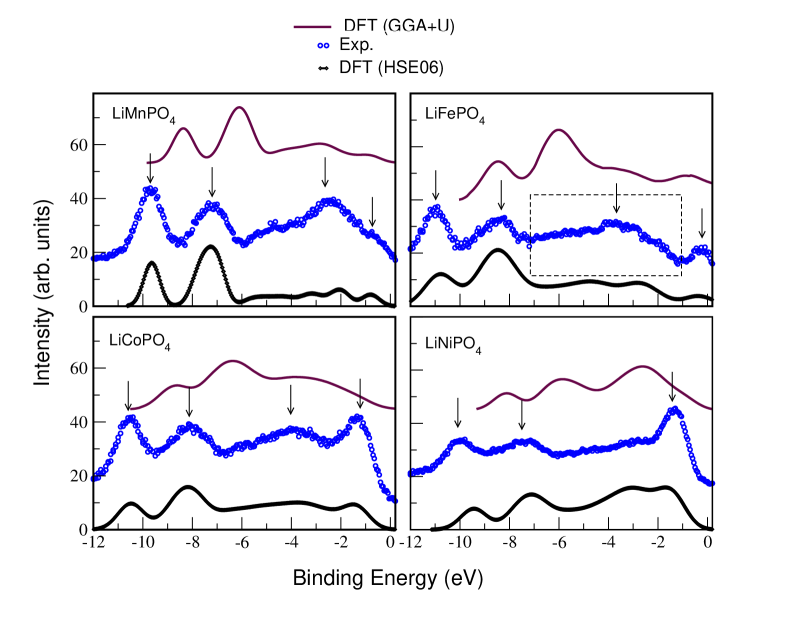
To establish which of our methodologies, GGA+U or HSE06, better reproduces the actual electronic structure in the olivine phosphates, and therefore to determine whether or not small hole polaron formation is possible, we compare both to measured XPS spectra in Fig. 2. For all four compounds, the peak positions are almost perfectly captured by the HSE06 calculation, whereas the GGA+U spectra are significantly compressed resulting in binding energies that are too low compared to experiment. Additionally, there are obvious differences near the VBM between the two methodologies and in all cases, the experimental spectra are much better matched by HSE06 than by GGA+U. The spectra as a whole are better represented at both high and low binding energies using HSE06 in comparison to GGA+U.
Calculated peak heights are somewhat distorted compared to measurement for all four compounds and in both methodologies. This can be attributed to the fact that we have to project out the separate atomic characters from the DOS to apply the Scofield cross-section parameters, and not all states are equally localized within the radii used for projection. This is most problematic for oxygen character which tends to be the most delocalized and therefore most missed in the projection. Oxygen has a small experimental photoionization cross-section so that missed character in the DOS remains uncorrected and produces exaggerated peak heights compared to experiment. The two peaks at highest binding energy, attributable to strongly bound P and O states, are stronger than in experiment in all four compounds. Since P has a high cross-section and O a low one, small errors in the ratio of the two will cause the peaks to be artificially high. The same effect is operative in the LiNiPO4 spectrum where Ni and O are very strongly hybridized. The delocalized oxygen character leads to the exaggerated peak at -3 eV.
Because an electron is withdrawn from the very top of the valence band, the character of the states there is extremely important for hole polaron formation. If transition metal character dominates, charge localization is possible and hole polarons will form. If oxygen character dominates, charge will delocalize and polarons will not form. The very good match between HSE06 binding energies and those measured in experimental XPS, indicates that the character of these states has been well-captured by this methodology, as strong shifts in the character would also show up as shifts in peak positions as can be seen in the GGA+U calculations. All spectra have two sharp peaks at high binding energy attributable to heavily bonded P and O states (the two leftmost arrows in Fig. 2). The next peak, located between -4 eV and -2 eV represents not a single kind of state, but a broad continumm of states composed of transition-metal and oxygen bonding and antibonding states which give rise to moderate secondary structure in the spectra, especially in in the calculations. A peak near the valence band maximum has previously been identified as the localized state necessary for small hole polaron formation in LiFePO4.Castro et al. (2010) In all of our spectra, we see a similar low energy peak peak in all of our spectra, but a comparison with the unbroadened and character-resolved DOS (Fig 1) shows that in LiNiPO4, it is not transition-metal dominated, nor is it even separated from the continuum of states below. In all three other compounds, this peak represents a separate, energy-localized and transition-metal dominated state in which polaron formation is possible. Temperature broadening mainly obscures the separation between this ”polaron state” and the continuum, but close inspection of the experimental spectrum does allow the interpretation that LiNiPO4 has only three clearly distinguishable peaks (plus a small shoulder) due to a merged first and second peak, whereas the other compounds have four. Comparison with calculation makes this interpretation the most reasonable. The lowest energy peak in LiNiPO4 is more closely associated with the second lowest peak in the other compounds and is not suitable as a ”polaron state”. We conclude that the VBM of LiNiPO4 is dominated by oxygen character, that no gap between the initial peak and the rest of spectrum exists and thus, small hole polarons will not form during delithiation of LiNiPO4 and oxygen will likely be evolved.
III.3 Small hole polaron conduction
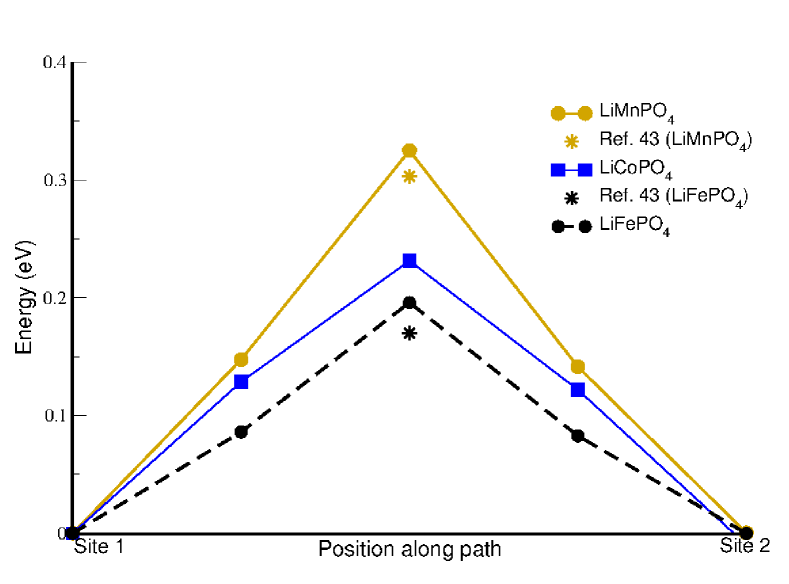
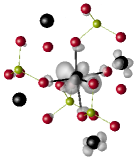
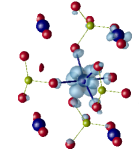
To understand how small hole polarons move through the olivine structure, we used a method similar to that of Refs. Maxisch et al., 2006; Ong et al., 2011 to calculate the migration barrier for a polaron hopping from one transition metal site to another. First we remove an electron from a given transition-metal site in a sixteen formula unit supercell of LiMPO4. We fully relax all the ionic positions to achieve the oxygen distortion around the hole, along with any other nearby distortions that occur. In a separate calculation, we remove an electron from an adjacent transition-metal site and again perform a relaxation. We find that the distortion of the lattice is negligible beyond a single unit cell, and is mainly constrained to the first shell of neighbors surrounding the hole, confirming the small polaron designation. We use a linear interpolation of the two structures and calculate the energies along a series of intermediate positions, using the NEB method. The highest energy we consider to be the polaron migration barrier. The positive (hole) charge density in this scenario ”follows” the distortion, hopping wholly or partially from one transition-metal site to the next without ever occupying an intermediate space. The migration barrier, therefore reflects mainly the energy required to distort the lattice. As can be seen in Fig. 3, the resulting numbers are 0.33 eV for LiMnPO4, 0.20 eV for LiFePO4, and 0.23 eV for LiCoPO4, following the trend of measured conductivities in these materials. The numbers for LiMnPO4 and LiFePO4 are shifted slightly higher, but otherwise in good agreement with Ref. Ong et al., 2011 using the same exchange correlation potential.
IV Discussion
IV.1 Effect of exchange-correlation corrections
In a Hartree-Fock calculation, the subtraction of the Hartree and exchange terms produces an exact cancelation of the electron self-interaction energy. When an approximation to the exchange term is made in DFT, this exact cancellation is compromised and leftover self-interaction contributes to the eigenvalues and total energy of the system.Parr and Yang (1989) This is especially problematic for systems with localized bands. Both the GGA+U and HSE06 methods are useful to counteract the erroneous self-interaction term, but they are different in their effects on the electronic structure. The GGA+U method applies a correction to the correlated bands (transition-metal -bands for the purposes of this article) only. Since all non-correlated bands are unaffected, one effect is that the occupied (down-shifted) bands are brought closer in energy to the oxygen bands below them, compared to GGA alone.V. I. Anisimov et al. (1991) The hybridization between the O bands and metal bands depends inversely on the energy distance between them, which systematically decreases with the increasing -value of the transition-metal ion. Consequently, the smaller energy separation in GGA+U causes a large increase in the amount of oxygen mixed into the transition-metal-derived bands at the valence band maximum (See Table 1 and Fig. 1). For LiCoPO4 and LiNiPO4, where the states are already quite low in energy, the downshift is so dramatic that the -derived bands are located within or even below the oxygen band complex resulting in a predominantly oxygen VBM character, which does not accurately represent the experimental data.
The HSE06 method, on the other hand, incorporates exact exchange along with the GGA approximation to the exchange-correlation potential, with each being used in a certain region of real space.Heyd et al. (2003) The exact exchange portion does not require any discrimination between ”correlated” and ”non-correlated” orbitals and therefore shifts both metal-derived and O-derived states downward, though not equally. Compared to GGA+U, the mixture of O character into the highest energy valence states is greatly reduced. Comparison with the XPS spectra show that this reduced hybridization better reproduces the experimental binding energies. For all but LiNiPO4, this results in a sharp peak with mainly transition-metal character at the VBM and a gap to the continuum of states below it. For the Ni-based compound, oxygen character at the VBM is reduced from the GGA+U value, but is still too high to allow small hole polaron formation. The good match between experiment and calculation shows that this is due to hybridization resulting from the legitimately low energy position of the Ni bands, and not due to computational artifacts.
| LiMnPO4 | M-O bond lengths | Ave | |||||
|---|---|---|---|---|---|---|---|
| Mn2+ | 2.13 | 2.13 | 2.15 | 2.25 | 2.27 | 2.27 | 2.20 |
| Mn3+ | 1.93 | 1.95 | 2.00 | 2.00 | 2.34 | 2.34 | 2.09 |
| LiFePO4 | |||||||
| Fe2+ | 2.06 | 2.06 | 2.12 | 2.21 | 2.25 | 2.25 | 2.16 |
| Fe3+ | 2.01 | 2.01 | 2.02 | 2.07 | 2.13 | 2.14 | 2.06 |
| LiCoPO4 | |||||||
| Co2+ | 2.04 | 2.05 | 2.05 | 2.11 | 2.16 | 2.18 | 2.10 |
| Co3+ | 1.94 | 1.94 | 2.00 | 2.10 | 2.13 | 2.14 | 2.04 |
IV.2 Lattice changes during polaron formation
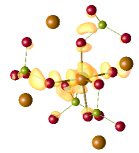
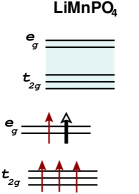
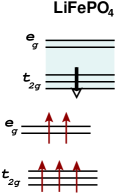
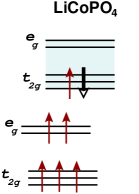
The lattice contraction around the removed electron depends strongly on the occupation of the metal states prior to withdrawal. In the olivine structure, the transition metal sits in a quasi-octahedral MO6 environment. The crystal field and ligand interactions split the 5 states into a lower three-fold degenerate manifold () and an upper doubly degenerate manifold (). The states are strongly exchange split such that the ground state is high spin in all cases. For LiMnPO4, the hole state is in a state, while for LiFePO4 and LiCoPO4, the hole sits in a state (See Fig. 4). The anti-bonding states are heavily mixed with oxygen - the result of strong -type bonding between metal and oxygen states, whereas the weak- or non-bonding states are much more lightly mixed with oxygen. Removing an electron from the anti-bonding states increases the bond strength and the surrounding octahedron contracts strongly. Removing an electron from the non-bonding states results in a much weaker shift of oxygen toward the transition-metal ion. This can be seen in Table 2 where the average Mn-O bond distance changes much more than Fe-O or Co-O. Lattice distortion around the Mn3+ ion is complicated by the fact that creation of a hole leaves a single electron in the doubly degenerate complex, stimulating a Jahn-Teller distortion which partially counteracts the overall contraction of the MnO6 octahedra. The two-long/four-short pattern typical of octahedral Jahn-Teller distortions is combined with an overall shrinking of all Mn-O bonds to produce four dramatically shorter bonds and two slightly longer ones. Thus, the average contraction in bond length (5%) belies the actual magnitude of the distortion: a 9% contraction of four bonds and a 3% expansion of two others. The average contraction of bond lengths in LiFePO4 is 4.3% and in LiCoPO4 is 2.7%. The strong distortion in the Mn-based material will disrupt small hole polaron migration (electronic conduction) since large local changes must propagate through the crystal. Such distortions are also likely to be detrimental to the structure during repeated electrochemical cycling, especially at high rates.
 |
 |
 |
 |
 |
 |
V Summary
Our investigation of four olivine phosphate compounds reveals that small hole polaron formation depends on the existence of a narrow, isolated band at the VBM that contains predominantly transition-metal character. The relevant electronic structure is sensitive to the particular approximation used for the exchange-correlation potential. GGA+U pushes the transition-metal bands down much further relative to the oxygen bands than does HSE06, thereby increasing the hybridization and mixing more oxygen into the valence band. A comparison with experimental XPS spectra shows that only HSE06 properly captures the true electronic structure for these materials at the VBM. Using this methodology, we find that LiMnPO4, LiFePO4, and LiCoPO4 can all support small hole polarons, while LiNiPO4 cannot due to a predominantly oxygen-derived valence band that delocalizes the hole upon electron removal. The hole polaron state in LiMnPO4 is within the strong-bonding complex and additionally supports a Jahn-Teller distortion, resulting in an overall stronger local deformation of the lattice and therefore higher migration barrier than in LiFePO4 or LiCoPO4 where the hole polaron occupies a weak- or non-bonding state. The order of barriers is LiFePO LiCoPO LiMnPO4, in agreement with experimental measurements of conductivity.
Acknowledgements.
We acknowledge useful technical discussions with Jeff Wolfenstine, T. Richard Jow and Shyue-Ping Ong. Funding was provided by the Army Research Laboratory and the Office of Naval Research.References
- Padhi et al. (1997) A. K. Padhi, K. S. Nanjundaswamy, and J. B. Goodenough, J Electrochem Soc 144, 1188 (1997).
- Yonemura et al. (2004) M. Yonemura, A. Yamada, Y. Takei, N. Sonoyama, and R. Kanno, J Electrochem Soc 151, A1352 (2004).
- Chung et al. (2002) S. Y. Chung, J. T. Bloking, and Y. M. Chiang, Nat Mater 1, 123 (2002).
- Dominko et al. (2005) R. Dominko, J. M. Goupil, M. Bele, M. Gaberscek, M. Remskar, D. Hanzel, and J. Jamnik, J Electrochem Soc 152, A858 (2005).
- Delacourt et al. (2006) C. Delacourt, C. Wurm, L. Laffont, J. B. Leriche, and C. Masquelier, Solid State Ionics 177, 333 (2006).
- Herle et al. (2004) P. S. Herle, B. Ellis, N. Coombs, and L. F. Nazar, Nat Mater 3, 147 (2004).
- Ravet et al. (2003) N. Ravet, A. Abouimrane, and M. Armand, Nature Mat. 2, 702 (2003).
- Chung et al. (2003) S. Y. Chung, J. T. Bloking, and Y. M. Chiang, Nature Mat. 2, 702 (2003).
- Chung et al. (2010) S.-Y. Chung, Y.-M. Kim, and S.-Y. Choi, Adv Funct Mater 20, 4219 (2010).
- Hamelet et al. (2011) S. Hamelet, M. Casas-Cabanas, L. Dupont, C. Davoisne, J. M. Tarascon, and C. Masquelier, Chem Mater 23, 32 (2011).
- Kang and Ceder (2009) B. Kang and G. Ceder, Nature 458, 190 (2009).
- Zaghib et al. (2009) K. Zaghib, J. B. Goodenough, A. Mauger, and C. Julien, 194, 1021 (2009).
- Amine et al. (2000) K. Amine, H. Yasuda, and M. Yamachi, Electrochem Solid St 3, 178 (2000).
- Zhou et al. (2004a) F. Zhou, M. Cococcioni, K. Kang, and G. Ceder, Electrochem Commun 6, 1144 (2004a).
- Wolfenstine and Allen (2005) J. Wolfenstine and J. L. Allen, J Power Sources 142, 389 (2005).
- Oh et al. (2010) S.-M. Oh, S.-W. Oh, C.-S. Yoon, B. Scrosati, K. Amine, and Y.-K. Sun, Adv Funct Mater 20, 3260 (2010).
- Wolfenstine et al. (2005) J. Wolfenstine, U. Lee, B. Poese, and J. L. Allen, J Power Sources 144, 226 (2005).
- Tadanaga et al. (2003) K. Tadanaga, F. Mizuno, A. Hayashi, T. Minami, and M. Tatsumisago, Electrochemistry 71, 1192 (2003).
- Prabu et al. (2011) M. Prabu, S. Selvasekarapandian, A. R. Kulkarni, S. Karthikeyan, G. Hirankumar, and C. Sanjeeviraja, Ionics 17, 201 (2011).
- Wolfenstine (2006) J. Wolfenstine, J Power Sources 158, 1431 (2006).
- Kumar et al. (2011) P. R. Kumar, M. Venkateswarlu, M. Misra, A. K. Mohanty, and N. Satyanarayana, J Electrochem Soc 158, A227 (2011).
- Zhou et al. (2004b) F. Zhou, K. S. Kang, T. Maxisch, G. Ceder, and D. Morgan, Solid State Commun 132, 181 (2004b).
- Zaghib et al. (2007) K. Zaghib, A. Mauger, J. B. Goodenough, F. Gendron, and C. M. Julien, Chem Mater 19, 3740 (2007).
- Hoang and Johannes (2011) K. Hoang and M. Johannes, Chem Mater 23, 3003 (2011).
- Ellis et al. (2006) B. Ellis, L. K. Perry, D. H. Ryan, and L. F. Nazar, J Am Chem Soc 128, 11416 (2006).
- Blochl (1994) P. E. Blochl, Physical Review B 50, 17953 (1994).
- Kresse and Joubert (1999) G. Kresse and D. Joubert, Phys. Rev. B 59, 1758 (1999).
- Kresse and Furthmuller (1996a) G. Kresse and J. Furthmuller, Phys. Rev. B 54, 11169 (1996a).
- Kresse and Furthmuller (1996b) G. Kresse and J. Furthmuller, Comput. Mat. Sci. 6, 15 (1996b).
- Perdew et al. (1996) J. P. Perdew, K. Burke, and M. Ernzerhof, Phys Rev Lett 77, 3865 (1996).
- Liechtenstein et al. (1995) A. I. Liechtenstein, V. I. Anisimov, and J. Zaanen, Physical Review B 52, R5467 (1995).
- Zhou et al. (2004c) F. Zhou, M. Cococcioni, C. A. Marianetti, D. Morgan, and G. Ceder, Physical Review B 70, 235121 (2004c).
- Heyd et al. (2003) J. Heyd, G. E. Scuseria, and M. Ernzerhof, J Chem Phys 118, 8207 (2003).
- Paier et al. (2006) J. Paier, M. Marsman, K. Hummer, G. Kresse, I. C. Gerber, and J. Angyan, J Chem Phys 124, 154709 (2006).
- Mills et al. (1995) G. Mills, H. Jonsson, and G. K. Schenter, Surf Sci 324, 305 (1995).
- Scofield (1976) Scofield, J. Electron Spectrosc. Relat. Phenom. 8, 129 (1976).
- Allen et al. (2009) J. L. Allen, T. R. Jow, and J. Wolfenstine, Mater. Res. Soc. Symp. Proc 1127, T03 (2009).
- Allen et al. (2011) J. L. Allen, T. R. Jow, and J. Wolfenstine, J Power Sources 196, 8656 (2011).
- Goodenough and Kim (2010) J. B. Goodenough and Y. Kim, Chem Mater 22, 587 (2010).
- Love et al. (2011) C. T. Love, W. Dmowski, M. D. Johannes, and K. E. Swider-Lyons, J. Solid State Chem. 184, 2412 (2011).
- Castro et al. (2010) L. Castro, R. Dedryvere, M. El Khalifi, P. E. Lippens, J. Breger, C. Tessier, and D. Gonbeau, J Phys Chem C 114, 17995 (2010).
- Maxisch et al. (2006) T. Maxisch, F. Zhou, and G. Ceder, Physical Review B 73, 104301 (2006).
- Ong et al. (2011) S. P. Ong, V. L. Chevrier, and G. Ceder, Physical Review B 83, 075112 (2011).
- Parr and Yang (1989) R. G. Parr and W. Yang, Density-functional theory of atoms and molecules (Oxford University Press, 1989).
- V. I. Anisimov et al. (1991) V. I. Anisimov, J. Zaanen, and O. K. Andersen, Phys. Rev. B 44, 943 (1991).