1–12
The importance of nebular emission for SED modeling of distant star-forming galaxies
Abstract
We highlight and discuss the importance of accounting for nebular emission in the SEDs of high redshift galaxies, as lines and continuum emission can contribute significantly or subtly to broad-band photometry. Physical parameters such as the galaxy age, mass, star-formation rate, dust attenuation and others inferred from SED fits can be affected to different extent by the treatment of nebular emission.
We analyse a large sample of Lyman break galaxies from 3–6, and show some main results illustrating e.g. the importance of nebular emission for determinations of the mass–SFR relation, attenuation and age. We suggest that a fairly large scatter in such relations could be intrinsic. We find that the majority of objects ( 60–70%) is better fit with SEDs accounting for nebular emission; the remaining galaxies are found to show relatively weak or no emission lines. Our modeling, and supporting empirical evidence, suggests the existence of two categories of galaxies, “starbursts” and “post-starbursts” (lower SFR and older galaxies) among the LBG population, and relatively short star-formation timescales.
keywords:
galaxies: starburst, galaxies: high-redshift, galaxies: evolution, galaxies: formation1 Introduction
Until recently the importance of nebular emission on the SED of high redshift galaxies and hence on on our understanding of the physical parameters of these objects was overlooked. For example, when Spitzer started to detect the rest-frame optical part of the spectrum of high-redshift galaxies redshifted into broad-band filters of its IRAC camera at 3.6 and 4.5 m, it was soon noted that some of these galaxies showed fairly large Balmer breaks [Egami et al.(2005)Egami, Kneib, Rieke, Ellis, Richard, Rigby, Papovich, Stark, Santos, Huang, Dole, Le Floc’h, & Pérez-González, Eyles et al.(2005)Eyles, Bunker, Stanway, Lacy, Ellis, & Doherty, (e.g. Egami et al. 2005, Eyles et al. 2005)]. Several authors interpreted the large break as being due to the presence of “old”, evolved stellar populations with ages of several hundred Myr [Eyles et al.(2005)Eyles, Bunker, Stanway, Lacy, Ellis, & Doherty, Labbé et al.(2010)Labbé, González, Bouwens, Illingworth, Oesch, van Dokkum, Carollo, Franx, Stiavelli, Trenti, Magee, & Kriek, (Eyles et al. 2005, Labbe et al. 2010)]. If true this would imply the presence of very early galaxy populations, and very large formation redshifts ().
However, since emission lines are ubiquituous in star-forming galaxies and since atomic physics causes most of the strong observed lines to be in the (rest-frame) optical part of the spectrum, longward of the Balmer break, nebular emission affects broad-band photometry differentially, and can cause an apparent Balmer break. The importance of this effect for high-z galaxies was pointed out by [Schaerer & de Barros(2009), Schaerer & de Barros (2009)], who showed that significantly younger ages could be obtained when accounting for nebular lines.
It has now become clear [Schaerer & de Barros(2009), Ono, , (Schaerer & de Barros 2010, Ono et al. 2010, Lidman et al. 2011)] that nebular emission (both lines and continuum emission) must be taken into account for the interpretation of photometric measurements of the SEDs of star-forming galaxies such as Lyman-alpha emitters (LAE) and Lyman break galaxies (LBGs) – the dominant galaxy populations at high-z.
Furthermore, as testified by the presence of Ly emission, a large (and possibly growing) fraction of the currently know population of star-forming galaxies at high redshift shows emission lines [Ouchi et al.(2008)Ouchi, Shimasaku, Akiyama, Simpson, Saito, Ueda, Furusawa, Sekiguchi, Yamada, Kodama, Kashikawa, Okamura, Iye, Takata, Yoshida, & Yoshida, Stark et al.(2010)Stark, Ellis, Chiu, Ouchi, & Bunker, (at least Ly!; cf.Ouchi et al. 2008, Stark et al. 2010 and others)].
In parallel a lot of diverse evidence for galaxies with strong emission lines and/or strong contributions of nebular emission to broad-band filters has been found at different redshifts, e.g. by [Shim et al.(2011)Shim, Chary, Dickinson, Lin, Spinrad, Stern, & Yan, , , , , Shim et al. (2011), McLinden et al. (2011), Atek et al. (2011), Trump et al. (2011), van der Wel et al. (2011)].
Here we briefly summarise our method to account for nebular emission in a SED plus photometric-redshift fitting code and present some results obtained from a systematic study of a large sample of 3–6 LBGs.
2 SED modeling
Several evolutionary synthesis models, such as PÉGASE, GALEV and others include nebular emission [fioc99, , Anders & Fritze-v. Alvensleben(2003), Zackrisson et al.(2008)Zackrisson, Bergvall, & Leitet, (cf. Fioc et al. 1999, Charlot & Longhetti 2001, Anders & Fritze 2003, Zackrisson et al. 2008)]. However, they were not used to analyse observations of high redshift galaxies.
Our SED fitting tool, described in [Schaerer & de Barros(2009), Schaerer & de Barros(2010), Schaerer & de Barros (2009, 2010)], is based on a version of the Hyperz photometric redshift code of [Bolzonella et al.(2000)Bolzonella, Miralles, & Pelló, Bolzonella et al. (2000)], modified to taking into account nebular emission. In [, de Barros et al. (2011, hereafter dB11)] we consider a large set of spectral templates based on the GALAXEV synthesis models of [Bruzual & Charlot(2003), Bruzual & Charlot (2003)], covering different metallicities and a wide range of star formation histories. A Salpeter IMF is adopted. Nebular emission from continuum processes and numerous emission lines is added to the spectra predicted from the GALAXEV models as described in [Schaerer & de Barros(2009), Schaerer& de Barros (2009)], proportionally to the Lyman continuum photon production. The intergalactic medium (IGM) is treated with the prescription of [Madau(1995), Madau (1995)].
The free parameters of our SED fits are: redshift , metallicity (of stars and gas), star formation (SF) history described by the timescale (i.e. SFR ), the age defined since the onset of star-formation, and attenuation described by the Calzetti law. In some models we also vary the strength of the Ly line from zero to its maximum predicted by case B [Schaerer & de Barros(2010), (see Schaerer et al. 2011)]. In [, dB11] we consider 3 sets of SF histories, exponentially declining SF with variable timescales, SFR=const, and rising star-formation following [, Finlator et al. (2011)]. We use Monte-Carlo simulations to determine probability distribution functions for each parameter/quantity.
3 Impact of nebular emission on physical parameters of star-forming galaxies from to 8
In [Schaerer & de Barros(2009), Schaerer & de Barros (2009)] we have demonstrated the effect nebular emission may have on age determinations of high-z galaxies. In [Schaerer & de Barros(2010), Schaerer & de Barros (2010)] we have applied our SED fitting tool to 6–8 galaxies recently observed with the new WFC3 camera onboard HST and other, more luminous galaxies. We have shown an overall trend of the star-formation rate (SFR) increasing with stellar mass, albeit with a large scatter. Also, we have shown that the specific SFR may be higher than previously thought, depending on model assumptions. We have also found indications for dust in some galaxies at this redshift, and a possible trend of increasing dust attenuation with galaxy mass. However, since only few of these galaxies are detected beyond 1.6–2 m, the uncertainties of the physical parameters are fairly large.
To improve on this aspect, and to examine systematically the effects of nebular emission on the physical parameters of distant galaxies, we have examined a large sample of 3–6 galaxies. Some results from this study [, (dB11)] are highlighted here.
3.1 3–6 galaxies: photometric data and selection
We have used the GOODS-MUSIC catalogue of [Santini et al.(2009)Santini, Fontana, Grazian, Salimbeni, Fiore, Fontanot, Boutsia, Castellano, Cristiani, de Santis, Gallozzi, Giallongo, Menci, Nonino, Paris, Pentericci, & Vanzella, Santini et al. (2009)] providing photometry in the U, B435, V606, i776, z850LP, J, H, K, bands mostly from the VLT and HST, and the 3.6, 4.5, 5.8, and 8.0 m bands from the IRAC camera onboard Spitzer. Using standard criteria we have selected U, B, V, and i-drop galaxies. To reduce the contamination rate (typically 10–20 %) we have only retained the objects whose median photometric redshifts agree with the targetted redshift range. This leaves us with a sample of 389, 705, 199, and 60 galaxies with median photometric redshifts of , 3.9, 4.9, and 6.0. See [, dB11] for more details.
3.2 Results – Two categories of high-z galaxies
One of the first results obtained when applying SED models with/without nebular emission to our large galaxy sample is that the majority of the objects ( 60–70 %) are better fit with nebular emission, irrespectively of the SF history. For the rest, the difference between fits with or without nebular emission is generally minor. The difference between these two categories corresponds overall to objects whose best-fit SED clearly shows nebular lines (for the majority), and weak or no lines for the rest. Empirically this can be verified for 3.8–5 galaxies, where H falls in the 3.6 m filter, whereas the 4.5 m filter remains essentially free of strong emission lines. Indeed, for this redshift range we find that the objects best fit with nebular lines show a systematically bluer (3.6-4.5) color than the other category [, (see de Barros et al. 2011b)]. Our first category strongly resembles the “H emitters” identified by [Shim et al.(2011)Shim, Chary, Dickinson, Lin, Spinrad, Stern, & Yan, Shim et al. (2011)] through their 3.6 m excess.
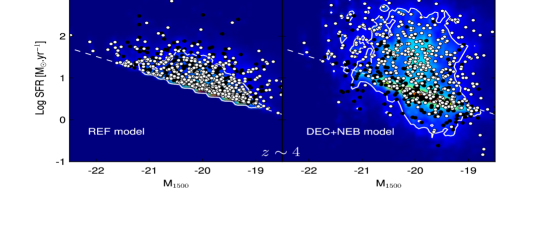
From our modeling we suggest that the two categories correspond to “starburst” and “post-starburst” phases. This is supported by their difference in (instantaneous) SFR, where the objects better fit with emission lines (“starbursts”) show on average a higher SFR than the “post-starburst” category (see Fig. 1), and also by an age difference. Interestingly we find a quite similar distribution of galaxies between these categories for all redshifts between 3 and 6.
3.3 Results – Mass–SFR relations and the specific SFR at high-z
The mass-SFR relation of galaxies and its evolution with redshift has drawn of lot of attention during the last few years. Some of the issues debated include the scatter in this relation and its behaviour at [Daddi et al.(2007)Daddi, Dickinson, Morrison, Chary, Cimatti, Elbaz, Frayer, Renzini, Pope, Alexander, Bauer, Giavalisco, Huynh, Kurk, & Mignoli, , (e.g. Daddi et al. 2007, Bouche et al. 2010)].
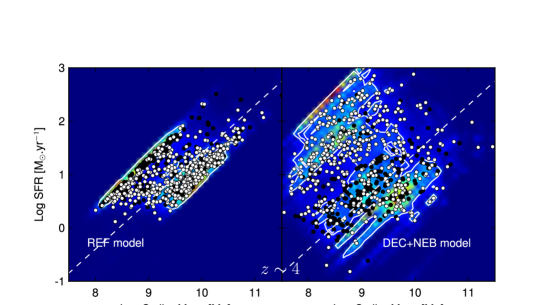
In Fig. 1 we show the derived SFR from our sample as a function of UV magnitude and stellar mass respectively, and how these relations depend on assumptions on the star-formation histories and on the treatment of nebular emission. The reference model (left panels) assumes SFR=const and ages 50 Myr, as often assumed in other studies. The derived SFR values are found on and above the SFR(UV) calibration of [Kennicutt(1998), Kennicutt (1998)] indicated by the dashed line, deviations from this line being due to dust attenuation. When nebular emission is treated and the SF history is kept free (among the declining SF histories) both effects contribute to increasing the scatter around the Kennicutt relation (right panels). Models with nebular emission naturally reveal a difference in SFR between the two categories discussed above, consistent with the observed color in the IRAC bands (3.6-4.5 m).
The derived stellar masses do not strongly depend on the treatment of nebular emission. On average we obtain a reduction of 30–40 % for 3–4 and somewhat more ( 70–80 %) at higher redshift.
As shown in Fig. 1 the existence of a tight mass–SFR relation relies on the assumption of constant SFR over long enough timescales ( 100 Myr). Again for variable SF histories and including nebular emission we find a large scatter (e.g. around the mean relation obtained by [Daddi et al.(2007)Daddi, Dickinson, Morrison, Chary, Cimatti, Elbaz, Frayer, Renzini, Pope, Alexander, Bauer, Giavalisco, Huynh, Kurk, & Mignoli, Daddi et al. (2007)] at shown in this Fig.). The median specific SFR (SFR ) of 3–5 galaxies is typically a factor 2–3 higher when nebular emission is accounted for both for SFR=const and for variable SFHs [, (cf. de Barros et al. 2011b)].
3.4 Results – Dust attenuation, galaxy ages and SF histories
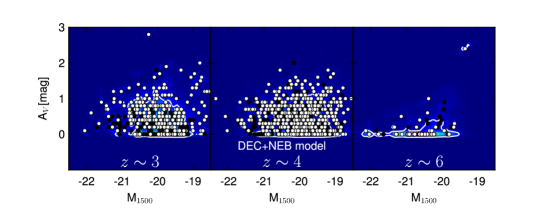
Our analysis also yields new information on dust attenuation and on trends with UV magnitude, galaxy mass, redshift etc. For illustration, we show the attenuation versus for the U-, B-, and i-drop samples in Fig. 2. A clear evolution of decreasing with redshift is found, both at a given UV magnitude and for the sample average. The exact value of the attenuation depends on model assumptions such as the SF history and of course also on the attenuation law. Taking nebular emission into account does not lead to a systematic shift of the inferred attenuation.
At 3–4 the median age of galaxies shows a wide range from very young to close to the maximum age allowed by cosmology. Including the effects of nebular emission yields on average somewhat younger ages (as already found in our earlier papers), but does not preclude old ages. No strong evolution of the average galaxy age with redshift is found between 3 and 5 e.g. at fixed UV magnitude or given stellar mass; at higher our sample appear significantly younger, though.
Interestingly declining SF histories are clearly favoured for the majority of galaxies, as they fit better than models assuming SFR=const or rising SF. As already mentioned above, declining SF histories also provide a natural explanation for the two galaxy categories identified (“starburst” and “post-starburst”). Other arguments, e.g. from galaxy statistics [, , (Lee et al. 2009, 2011)] or others [Stark et al.(2009)Stark, Ellis, Bunker, Bundy, Targett, Benson, & Lacy, (Stark et al. 2009)], also tend to favour short times scales of SF. Timescales and SF histories of high-z galaxies are, however, subject to debate [, , (e.g. Maraston et al. 2010, Finlator et al. 2011)]. For more detailed results and discussion of other implications see [, dB11] .
4 Conclusions
As our previous results on 6–8 galaxies [Schaerer & de Barros(2009), Schaerer & de Barros(2010), (Schaerer& de Barros 2009, 2010)], and the latest study of 3–6 objects ([, dB11]) show, it is important to include the effects of nebular emission in SEDs models when deriving physical parameters from broad-band photometric data. SED models including nebular lines and variable Ly can also be used to infer trends of Ly emission from photometric data, as shown in [Schaerer & de Barros(2010), Schaerer et al. (2011].
Accounting for nebular emission can lead to significant differences in the inferred age (which tend to become younger), masses (slightly lower), SFR , specific star-formation rate, attenuation and other parameters. We also find that the physical parameters depend quite significantly on the assumed star-formation histories. Our models favour relatively short (or recurrent?) star-formation timescales.
From our analysis of a large sample of high-z galaxies we find that the majority of objects ( 60–70%) is better fit with SEDs accounting for nebular emission (with a contribution proportionaly to the Lyman continuum flux). This category of apparently strongly SF objects (“starburst”) can also be distinguished empirically from the rest of the LBG population, which are probably closer to “post-starbursts”. We suggest that a fairly large scatter could be intrinsic in relations between SFR–mass and others. More detailed results and implications are presented and discussed in [, dB11].
References
- [Anders & Fritze-v. Alvensleben(2003)] Anders, P. & Fritze-v. Alvensleben, U. 2003, A&A, 401, 1063
- [] Atek, H., et al., 2011, ApJ, in press, arXiv1109.0639
- [Bolzonella et al.(2000)Bolzonella, Miralles, & Pelló] Bolzonella, M., Miralles, J.-M., & Pelló, R. 2000, A&A, 363, 476
- [] Bouche, N., et al., 2010, ApJ, 718, 1001
- [Bruzual & Charlot(2003)] Bruzual, G. & Charlot, S. 2003, MNRAS, 344, 1000
- [] Charlot, S., Longhetti, M. 2001, MNRAS, 323, 887
- [Daddi et al.(2007)Daddi, Dickinson, Morrison, Chary, Cimatti, Elbaz, Frayer, Renzini, Pope, Alexander, Bauer, Giavalisco, Huynh, Kurk, & Mignoli] Daddi, E., Dickinson, M., Morrison, G., et al. 2007, ApJ, 670, 156
- [] de Barros, S., Schaerer, D., Stark, D., 2011, A&A, in preparation (dB11)
- [] de Barros, S., Schaerer, D., Stark, D., 2011, SF2A-2011: Proceedings of the Annual meeting of the French Society of Astronomy and Astrophysics, arXiv:1111.6057
- [Egami et al.(2005)Egami, Kneib, Rieke, Ellis, Richard, Rigby, Papovich, Stark, Santos, Huang, Dole, Le Floc’h, & Pérez-González] Egami, E., Kneib, J.-P., Rieke, G. H., et al. 2005, ApJ, 618, L5
- [Eyles et al.(2005)Eyles, Bunker, Stanway, Lacy, Ellis, & Doherty] Eyles, L. P., Bunker, A. J., Stanway, E. R., et al. 2005, MNRAS, 364, 443
- [] Fioc, M, Rocca-Volmerange, B., 1999, A&A, 351, 869
- [] Finlator, K., et al., 2011, MNRAS, 410, 1703
- [Kennicutt(1998)] Kennicutt, Jr., R. C. 1998, ARAA, 36, 189
- [Labbé et al.(2010)Labbé, González, Bouwens, Illingworth, Oesch, van Dokkum, Carollo, Franx, Stiavelli, Trenti, Magee, & Kriek] Labbé, I., González, V., Bouwens, R. J., et al. 2010, ApJ, 708, L26
- [] Lee, K.S., et al., 2009, ApJ, 695, 368
- [] Lee, K.S., et al., 2011, arXiv:1111.1233
- [] Lidman., C., et al., 2011, MNRAS, in press, arXiv1109.1333
- [Madau(1995)] Madau, P. 1995, ApJ, 441, 18
- [] Maraston, C., et al., 2010, MNRAS, 407, 830
- [] McLinden, E.M., et al., 2011, ApJ, 730, 136
- [] Ono, Y., et al., 2010, ApJ, 724, 1524
- [Ouchi et al.(2008)Ouchi, Shimasaku, Akiyama, Simpson, Saito, Ueda, Furusawa, Sekiguchi, Yamada, Kodama, Kashikawa, Okamura, Iye, Takata, Yoshida, & Yoshida] Ouchi, M., Shimasaku, K., Akiyama, M., et al. 2008, ApJS,, 176, 301
- [Santini et al.(2009)Santini, Fontana, Grazian, Salimbeni, Fiore, Fontanot, Boutsia, Castellano, Cristiani, de Santis, Gallozzi, Giallongo, Menci, Nonino, Paris, Pentericci, & Vanzella] Santini, P., Fontana, A., Grazian, A., et al. 2009, A&A, 504, 751
- [Schaerer & de Barros(2009)] Schaerer, D. & de Barros, S. 2009, A&A, 502, 423
- [Schaerer & de Barros(2010)] Schaerer, D. & de Barros, S., 2010, A&A, 515, A73
- [Schaerer & de Barros(2010)] Schaerer, D. & de Barros, S., Stark, D., 2011, A&A, in press, arXiv1110.4398S
- [Shim et al.(2011)Shim, Chary, Dickinson, Lin, Spinrad, Stern, & Yan] Shim, H., Chary, R.-R., Dickinson, M., et al. 2011, ApJ, 738, 69
- [Stark et al.(2009)Stark, Ellis, Bunker, Bundy, Targett, Benson, & Lacy] Stark, D. P., Ellis, R. S., Bunker, A., et al. 2009, ApJ, 697, 1493
- [Stark et al.(2010)Stark, Ellis, Chiu, Ouchi, & Bunker] Stark, D. P., Ellis, R. S., Chiu, K., Ouchi, M., & Bunker, A. 2010, MNRAS, 408, 1628
- [] Trump, J.R., et al., 2011, ApJ, in press, arXiv1108.6075
- [] van der Wel, A., et al., 2011, ApJ, in press, arXiv1107.5256
- [Zackrisson et al.(2008)Zackrisson, Bergvall, & Leitet] Zackrisson, E., Bergvall, N., & Leitet, E. 2008, ApJ, 676, L9