11email: kohnaka@mpifr.de 22institutetext: UJF-Grenoble 1 / CNRS-INSU, Institut de Planétologie et d’Astrophysique de Grenoble (IPAG) UMR 5274, Grenoble, F-38041, France 33institutetext: INAF-Osservatorio Astrofisico di Arcetri, Instituto Nazionale di Astrofisica, Largo E. Fermi 5, 50125 Firenze, Italy 44institutetext: Observatoire de la Cote d’Azur, Departement FIZEAU, Boulevard de l’Observatoire, B.P. 4229, 06304 Nice Cedex 4, France
Spatially resolving the outer atmosphere of the M giant BK Vir in the CO first overtone lines with VLTI/AMBER ††thanks: Based on AMBER observations made with the Very Large Telescope Interferometer of the European Southern Observatory. Program ID: 081.D-0233(A) (AMBER Guaranteed Time Observation)
Abstract
Context. The mass-loss mechanism in normal K–M giant stars with small variability amplitudes is not yet understood, although they are the majority among red giant stars.
Aims. We present high-spatial and high-spectral resolution observations of the M7 giant BK Vir with AMBER at the Very Large Telescope Interferometer (VLTI). Our aim is to probe the physical properties of the outer atmosphere by spatially resolving the star in the individual CO first overtone lines.
Methods. BK Vir was observed between 2.26 and 2.31 m using the 16-32-48 m telescope configuration with an angular resolution of 9.8 mas and a spectral resolution of 12000.
Results. The uniform-disk diameters observed in the CO first overtone lines are 12–31% larger than those measured in the continuum. We also detected asymmetry in the CO line-forming region, which manifests itself as non-zero/non- differential and closure phases. The data taken 1.5 months apart show possible time variation on a spatial scale of 30 mas (corresponding to 3 stellar diameter) at the CO band head. Comparison of the observed data with the MARCS photospheric model shows that whereas the observed CO line spectrum can be well reproduced by the model, the angular sizes observed in the CO lines are much larger than predicted by the model. Our model with two additional CO layers above the MARCS photosphere reproduces the observed spectrum and interferometric data in the CO lines simultaneously. This model suggests that the inner CO layer at 1.2 is very dense and warm with a CO column density of cm-2 and temperatures of 1900–2100 K, while the outer CO layer at 2.5–3.0 is characterized by column densities of – cm-2 and temperatures of 1500–2100 K.
Conclusions. Our AMBER observations of BK Vir have spatially resolved the extended molecular outer atmosphere of a normal M giant in the individual CO lines for the first time. The temperatures derived for the CO layers are higher than or equal to the uppermost layer of the MARCS photospheric model, implying the operation of some heating mechanism in the outer atmosphere. This study also illustrates that testing photospheric models only with the spectra of strong molecular or atomic features can be misleading.
Key Words.:
infrared: stars – techniques: interferometric – stars: AGB, post-AGB – stars: late-type – stars: atmospheres – stars: individual: BK Vir| # | Night | PA | Seeing | Airmass | DIT | Number | Calibrator | ||
| (UTC) | (m) | (°) | (″) | (s) | of frames | ||||
| 1 | 2009 Jan 19 | 07:43:32 | 13.9/27.9/41.9 | 73 | 0.9 | 1.2 | 6 | 75 | Hya† |
| 2 | 2009 Feb 28 | 06:15:16 | 15.6/31.2/46.8 | 74 | 0.7 | 1.1 | 6 | 75 | Hya† |
| 3 | 2009 Apr 15 | 03:43:30 | 15.9/31.8/47.8 | 74 | 0.8 | 1.1 | 6 | 75 | Crv |
| Note: † means that the calibrator was observed before and after the science target. Seeing is in the visible. | |||||||||
1 Introduction
The mass loss in late evolutionary stages of low- and intermediate-mass stars (), particularly in the red giant branch (RGB) and asymptotic giant branch (AGB), is important not only for the evolution of the star itself but also for the chemical enrichment of the interstellar medium. The mass loss in Mira-type stars in the AGB phase, which are characterized by the large-amplitude pulsation with a variability amplitude of mag and a period of 1 year, has been observationally and theoretically intensively studied. However, normal (i.e., non-Mira-type) M giants show variability amplitudes of = 1–2 mag, much smaller than those of Mira stars, without clear periodic variations. They are classified as semi-regular or irregular variables. Among the M stars listed in the General Catalog of Variable Stars (GCVS) 4.2 (Samus et al. samus09 (2009)), there are 1987 stars classified as semi-regular or irregular giants (denoted as SRA, SRB, SRD, LB, and L in the catalog), in contrast to 1524 stars classified as Mira variables (see, however, Lebzelter et al. lebzelter95 (1995) for the uncertainty in the classification in the GCVS). There are also many semi-regular or irregular variables whose spectral type is unknown in the catalog. Therefore, normal M giants with small variability amplitudes may outnumber Mira stars considerably.
Despite their small variability amplitudes and the absence of clear periodicities, normal M giants are experiencing mass loss with mass-loss rates comparable to those in (optically bright) Mira stars. Normal M giants in the AGB phase show mass-loss rates of – yr-1 and expansion velocities of 5–15 km s-1 (e.g., Gonzalez Delgado et al. gonzalez_delgado03 (2003); Winters et al. winters03 (2003); De Beck et al. debeck10 (2010)). There is also evidence of significant mass loss in RGB stars with mass-loss rates up to yr-1 near the tip of the RGB (Origlia et al. origlia07 (2007), origlia10 (2010); Ita et al. ita07 (2007)).
The mass-loss rate () and expansion velocity () of our target, BK Vir, are estimated to be yr-1 and 4–7.5 km s-1, respectively (Gonzalez Delgado et al. gonzalez_delgado03 (2003); Winters et al. winters03 (2003)), which are approximately the same as in the prototypical Mira Cet with = yr-1 and = 1.5–7 km s-1(Winters et al. winters03 (2003)). This illustrates the importance of the contribution of normal M giants to the chemical enrichment of the interstellar medium.
For understanding the mass-loss mechanism in red giant stars, it is indispensable to probe the physical properties of the region between the upper photosphere and the innermost part of the circumstellar envelope, where the energy and momentum are expected to be deposited for the wind acceleration. It is now known from spectroscopy and high-spatial resolution observations in the IR that there is a dense, warm (1000–2000 K) molecular outer atmosphere, the so-called MOLsphere, extending to a few not only in Mira stars but also in normal K–M giants with small variability amplitudes (e.g., Tsuji et al. tsuji97 (1997); Tsuji tsuji01 (2001); Perrin et al. perrin04 (2004); Ohnaka ohnaka04 (2004); Ohnaka et al. ohnaka05 (2005); Takami et al. takami09 (2009)). This MOLsphere is considered to play an important role in driving mass outflows. In the case of Mira stars, the large-amplitude pulsation can fairly explain the presence of the extended atmosphere (e.g., Ohnaka et al. ohnaka06 (2006); Wittkowski et al. wittkowski07 (2007), wittkowski08 (2008); Woodruff et al. woodruff09 (2009)). However, the amplitudes of the stellar pulsation are much smaller in normal K–M giants, and therefore, the origin of the MOLsphere in these stars is by no means clear. In addition to the MOLsphere, the detection of UV emission lines as well as the H line suggests the presence of a chromosphere (e.g., Eaton eaton95 (1995); Isabel Pérez Martínez et al. isabel_perez_martinez11 (2011) and references therein). This means that there are both hot and warm components in the outer atmosphere of normal K–M giants, and the spectral analyses of the CO lines in the UV and IR support this picture (e.g., Wiedemann et al. wiedemann94 (1994); McMurry & Jordan mcmurry00 (2000)).
The multi-component nature of the outer atmosphere is a key to understanding the mass-loss mechanism in red giants. IR spectro-interferometry, which enables spatially resolved spectroscopy of molecular or atomic spectral features with a spatial resolution much higher than achieved with single-dish telescopes, is effective for probing the physical properties of the outer atmosphere. While Mira stars have been intensively studied by IR spectro-interferometry as mentioned above, IR spectro-interferometric observations of normal red giants are still very scarce. Recently, Martí-Vidal et al. (marti-vidal11 (2011)) have presented near-IR spectro-interferometric observations of the M6/7 giant RS Cap in the CO first overtone bands and H2O bands with a medium spectral resolution of 1500 using VLTI/AMBER. In this paper, we report on VLTI/AMBER observations of the M7 giant BK Vir in the individual CO first overtone lines near 2.3 m with a higher spectral resolution of 12000. BK Vir shows no peculiar features and, therefore, is a good representative of normal M giants (its evolutionary status is discussed in Sect. 4.1). It was selected also for technical reasons, such as the brightness and angular size appropriate for AMBER observations.
The paper is organized as follows. Our AMBER observations and data reduction are described in Sect. 2. The observational results are shown in Sect. 3 followed by the modeling of the data presented in Sect. 4. The implications of the results of the modeling are discussed in Sect. 5. Conclusions are presented in Sect. 6.
2 Observations
AMBER (Petrov et al. petrov07 (2007)) is the near-IR (1.3—2.4 m) spectro-interferometric instrument at VLTI. It enables us to obtain information on the amplitude and phase of the complex Fourier transform of the object’s intensity distribution with a spectral resolution of up to 12000 by combining three 8.2 m Unit Telescopes (UTs) or 1.8 m Auxiliary Telescopes (ATs). AMBER measures several quantities related to the complex Fourier transform of the object’s intensity distribution: visibility, differential phase (DP), and closure phase (CP). The visibility (or also called visibility amplitude) contains information about the size and shape of the object. The DP can measure the deviation of the object’s phase in a spectral feature from that in the continuum, and non-zero DP within a spectral feature means that the spectral feature-forming region is asymmetric. The CP is the sum of the measured phases around a closed triangle of baselines. The CP is always zero or for point-symmetric objects, and non-zero and non- CPs indicate an asymmetry in the object.
BK Vir was observed at 3 epochs between January and April 2009 with AMBER using the E0-G0-H0 telescope configuration with ATs, as summarized in Table 1. We used the high-spectral resolution mode in the band (HR_K) with a spectral resolution of 12000 in the wavelength range between 2.26 and 2.31 m, which includes the CO (2,0) band head at 2.294 m. The VLTI fringe-tracker FINITO was used to stabilize the fringes for a Detector Integration Time (DIT) of 6 s. This long DIT was necessary to achieve reasonable SNRs in the CO lines, where the correlated flux (i.e., flux visibility amplitude) is very low.
We reduced the data with amdlib ver2.2111Available at http://www.jmmc.fr/data_processing_amber.htm. We took the best 80% of the frames in terms of the fringe SNR (Tatulli et al. tatulli07 (2007)). The interferometric calibrators ( Hya and Crv) were observed just before and/or after BK Vir. We adopted angular diameters of 3.40 and 4.45 mas for Hya and Crv, respectively (Richichi & Perschron richichi05 (2005)). The errors of the calibrated visibilities, DPs, and CPs were estimated as described in Ohnaka et al. (ohnaka09 (2009)).
The AMBER data taken in HR_K mode before December 2009 are affected by the Fabry-Perot effect originating in the dichroics of the InfraRed Image Sensor (IRIS), which stabilizes the image motion 222AMBER data taken after the replacement of the IRIS dichroics in December 2009 do not show this effect any more.. This effect appears as time-dependent, high-frequency beating in raw visibilities, DPs, and CPs, when plotted as a function of wavelength. Fortunately, this effect is mostly removed by using the calibrators observed just before and/or after the science target, although the residual of this effect appears as the small-amplitude beating in some cases (as seen in the observed CP at wavelengths below 2.293 m in Fig. 1e).
The long DIT of 6 s makes the absolute calibration of the observed visibilities uncertain, because we cannot know the fraction of time during DIT when the fringes were lost, and the fringe tracking may work differently for the science target and the calibrator. Therefore, we took the following approach for the absolute calibration of the observed visibilities. We note that the -band uniform-disk diameters of BK Vir reported in the literature show little time variation within the measurement errors: mas (Dyck et al. dyck98 (1998)), mas (Perrin et al. perrin98 (1998)), and mas (Perrin et al. perrin03 (2003)). In the present work, we adopted a uniform-disk diameter of 10.73 mas, which has the smallest error among the above measurements. We scaled the observed calibrated visibilities in the continuum to those expected from the uniform disk with an angular diameter of 10.73 mas.
The wavelength calibration was carried out using the telluric lines
identified in the spectra of the calibrators.
As a template of the telluric lines, we convolved the atmospheric transmission
spectrum measured at the Kitt Peak National
Observatory333http://www.eso.org/sci/facilities/paranal/instruments/isaac/tools/
spectra/atmos_S_K.fits
to match the spectral resolution of AMBER.
The uncertainty in wavelength calibration is m (5.2 km s-1).
The wavelength scale was converted to the laboratory frame using a
heliocentric velocity of 16.5 km s-1 measured for BK Vir
(Gontcharov gontcharov06 (2006); Famaey et al. famaey05 (2005)).
Since no spectroscopic standard star was observed, we used the interferometric calibrators for the spectroscopic calibration to remove the telluric lines from the observed spectrum of BK Vir. However, both Crv (G5II) and Hya (K0/K1III) show CO absorption lines. In this case, the calibrated spectrum of the science target is derived as , where and denote the true and observed (i.e., including the atmospheric transmission and the detector’s response) spectra of the science target (or calibrator), respectively. To estimate the true spectrum of Hya, we used the high-resolution -band spectrum of Boo (K1III) obtained by Wallace & Hinkle (wallace96 (1996)), which has a similar spectral type to Hya. The spectrum of Boo, which has a spectral resolution of 89000, was convolved down to match the resolution of AMBER. This convolved spectrum of Boo reproduces the strength of the CO band head observed in Hya, indicating that it can be used as the true spectrum of Hya.
For Crv, however, no high-resolution CO spectra of stars with similar spectral types are available in the literature. Therefore, we estimated the true spectrum for Crv by constructing a model CO spectrum using the MARCS models (Gustafsson et al. gustafsson08 (2008)). The MARCS models represent spherically symmetric photospheres with molecular and atomic line opacities taken into account using the opacity sampling method. Each MARCS model is specified by effective temperature (), surface gravity (), microturbulent velocity (), chemical composition, and stellar mass (). These parameters derived for Crv are = 5100–5145 K, = 2.2–2.7 (given in units of cm s-2 throughout the paper), = 1.5–2.1 km s-1, and 3.0–3.7 (Luck et al. luck95 (1995); Takeda et al. takeda08 (2008); Lyubimkov et al. lyubimkov10 (2010)). The CNO abundances derived by Luck et al. (luck95 (1995)) suggest the mixing of CN-cycled material. We selected a model atmosphere with parameters as close to these values as possible from the MARCS model grid444http://marcs.astro.uu.se. The selected model is characterized with = 5250 K, = 2.5, = 2 km s-1, = 1 , and “moderately CN-cycled” chemical composition with C/N = 1.5. The stellar mass of this model is smaller than the observationally estimated values above. However, the atmosphere is approximately plane-parallel with a geometrical thickness of 1% of the stellar radius. In this case, the stellar mass does not affect the atmospheric structure noticeably. Using the temperature and pressure distributions of this model, we computed a synthetic spectrum for the CO first overtone lines using the line list of Goorvitch (goorvitch94 (1994)). The carbon abundance was adjusted to fit the CO band head in the uncalibrated spectrum of Crv. With constructed in this fashion, the calibrated spectrum of BK Vir was derived using the above equation. Although the strengths of the CO lines in two calibrators are very different (the line depths are 20–30% and 10% for Hya and Crv, respectively), the spectra of BK Vir calibrated with these stars agree well (see Fig. 3a, where both spectra calibrated with Hya (2009 Feb 28) and Crv (2009 Apr 15) are shown). This indicates that the calibrated CO line spectra of BK Vir are not significantly affected by the above, unusual spectroscopic calibration.
3 Results
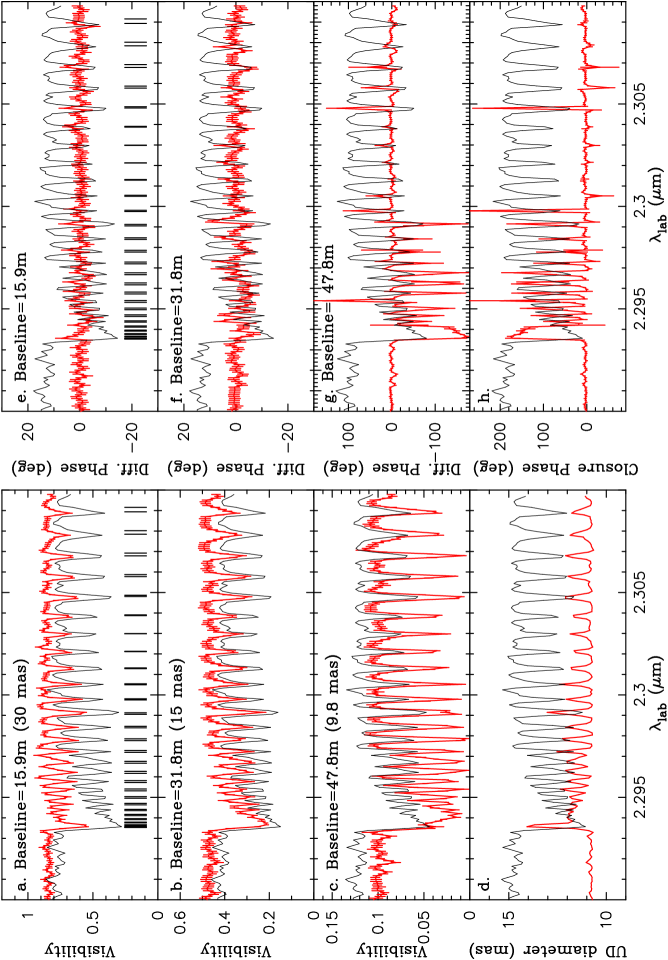
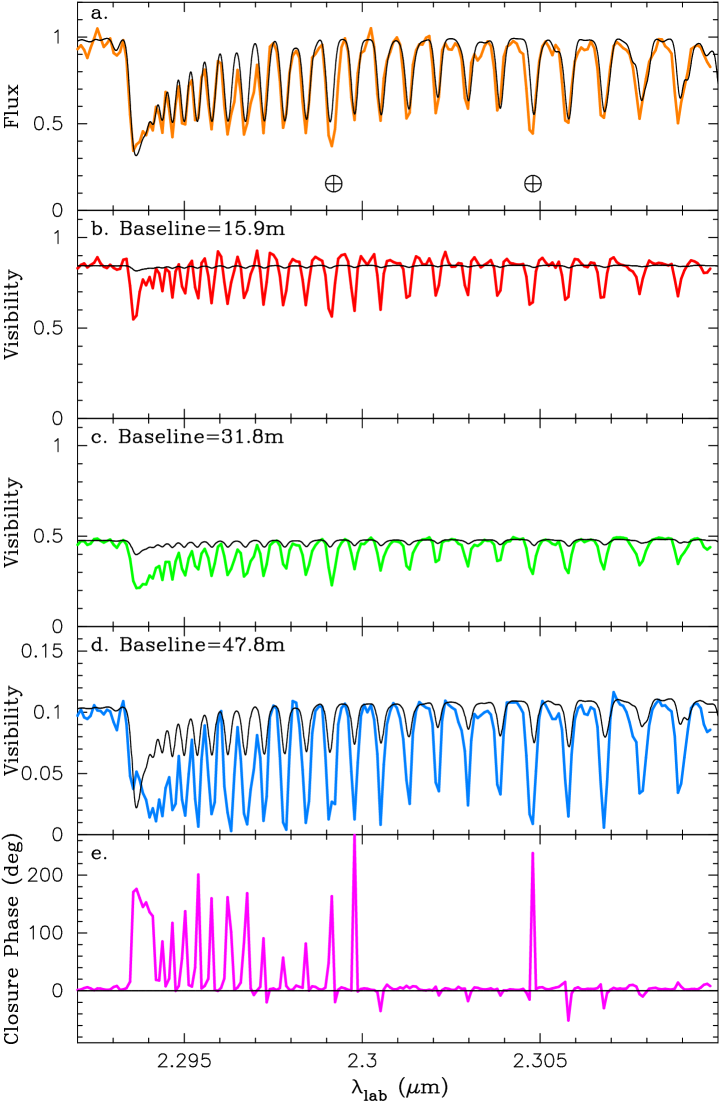
Figure 1 shows the observed visibilities, DPs, CPs, and spectrum from the data set #3. The results from the other data sets are similar, and therefore, not shown. The figure reveals significant signatures of the CO lines in the observed visibilities, DPs, and CPs. Thanks to the long DIT of 6 s, the visibilities as low as 0.01 could be measured in the CO lines. As plotted in Fig. 1d, the uniform-disk diameter obtained from the observed visibilities shows that the star appears larger in the CO lines (12–14 mas) than in the continuum (10.73 mas) by 12–31%. However, the uniform-disk fit in the CO lines is poor with reduced values much higher than 1 (as high as –), which means that the uniform disk is a poor representation of the object’s shape in the CO lines. Therefore, the uniform-disk diameter in the CO lines should be regarded as a very rough estimate of the characteristic size of the object.
Figures 1e–1h show the detection of non-zero DPs (particularly clear on the 47.8 m baseline) and non-zero/non- CPs in the CO lines, which indicate an asymmetry in the CO line-forming region. High-spatial resolution observations have revealed that asymmetries in the atmosphere of red giant stars are common. The images of the Mira star R Cas in the TiO bands obtained by Weigelt et al. (weigelt96 (1996)) show elongation, while the image in the continuum appears circular. The optical images of the prototypical Mira star Cet taken with the Hubble Space Telescope show significant asymmetries (Karovska et al. karovska97 (1997)). Tuthill et al. (tuthill99 (1999)) also revealed departures from circular symmetry in five Mira stars (including the above two stars) in the optical and near-IR. The aperture synthesis images of the Mira stars R Aqr and U Ori in the band obtained with the Infrared Optical Telescope Array (IOTA) show asymmetric, extended atmospheres (Ragland et al. ragland08 (2008); Pluzhnik et al. pluzhnik09 (2009)). U Ori shows asymmetry in the band as well (Mondal & Chandrasekhar mondal04 (2004)). There are more stars for which asymmetries are indicated from the detection of non-zero CPs. Bedding et al. (bedding97 (1997)) detected non-zero CPs for the Mira-like star R Dor. Ragland et al. (ragland06 (2006)) also report asymmetries in a sample of AGB stars based on the detection of non-zero CPs. More recently, Wittkowski et al. (wittkowski11 (2011)) have shown asymmetries in the CO first overtone bands in Mira stars by AMBER observations with a spectral resolution of 1500. Our AMBER observations are the first study to detect asymmetry in a red giant star in the individual CO lines.
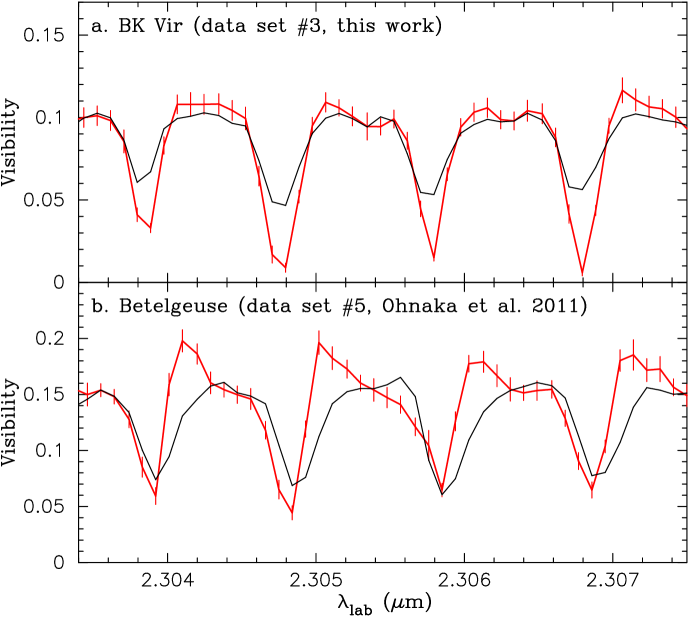
Figure 2a, which shows an enlarged view of the visibilities in four representative CO lines obtained on the 47.8 m baseline, reveals that the observed visibilities are approximately symmetric with respect to the line center. On the other hand, Fig. 2b shows the visibility of the red supergiant Betelgeuse observed on the 11.54 m baseline (data set #5 of Ohnaka et al. ohnaka11 (2011)). Because the angular diameter of Betelgeuse (42.5 mas, Ohnaka et al. ohnaka11 (2011)) is four times larger than that of BK Vir (10.73 mas), the 11.54 m baseline for Betelgeuse probes nearly the same spatial scale in terms of the stellar angular diameter as the 47.8 m baseline for BK Vir (0.9 stellar angular diameter). Figure 2b clearly shows that the observed visibilities are asymmetric with respect to the line center in the case of Betelgeuse: the visibilities are characterized by the minima in the blue wing and the maxima in the red wing. These asymmetric visibilities are interpreted as temporally variable, inhomogeneous gas motions within 1.3–1.4 over the stellar surface with velocity amplitudes of up to 20–30 km s-1 (Ohnaka et al. ohnaka09 (2009), ohnaka11 (2011)). The absence of such asymmetric visibilities in BK Vir suggests that the amplitude of the inhomogeneous velocity field is much smaller than the AMBER’s spectral resolution of 12000, say, 5 km s-1, and/or the spatial scale of the inhomogeneous gas motions is much smaller than the spatial resolution of the current AMBER data (9.8 mas). However, the former possibility is more favorable, because the non-zero DPs and non-zero/non- CPs shown in Fig. 1 indicate that the inhomogeneity is spatially resolved with the current spatial resolution.
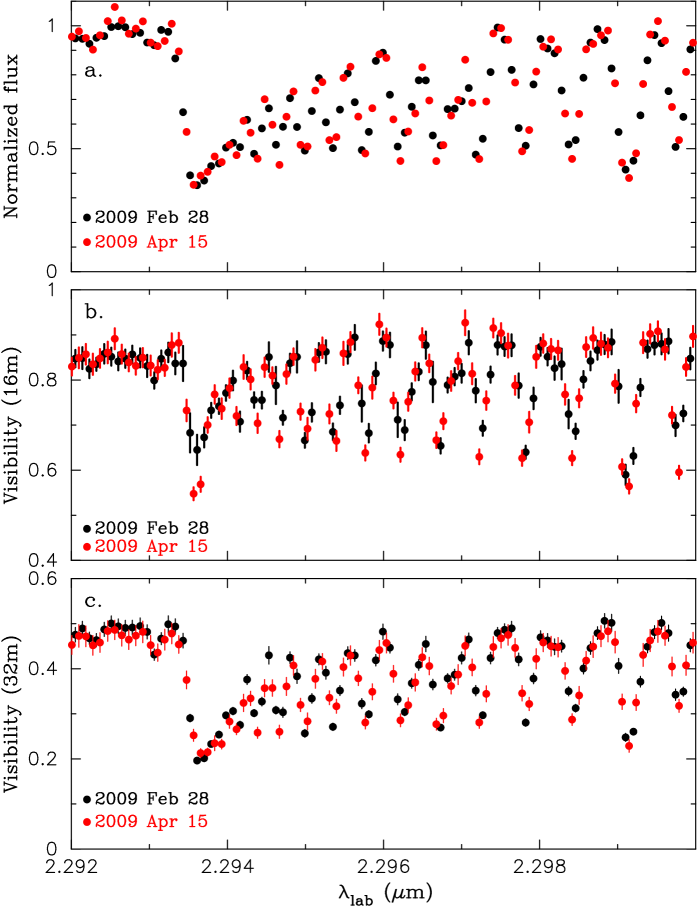
We examined time variation using the AMBER data taken at nearly the same points. The shortest and middle baselines of the data sets taken on 2009 Feb 28 and 2009 Apr 15 are almost the same (the 1 m difference in the longest baseline is too significant to study time variations). A comparison between these two data sets is shown in Fig. 3. The sampled wavelengths are slightly different for the two nights because of the difference in the correction to convert the observed wavelength scale to the heliocentric scale. Figures 3a and 3c show that the observed spectra and the visibilities on the 32 m baseline measured on the two nights form continuous curves, suggesting no time variation. This is also the case for the 16 m visibility shown in Fig. 3b except for the CO band head at 2.2936 m, where the visibility measured on Apr 15 is 12–20% lower than that measured on Feb 28. This suggests possible time variation on a spatial scale of 30 mas (3 stellar diameter). The decrease in the visibility corresponds to an increase in the uniform-disk diameter by 22% (from 16 to 19.5 mas) or an increase in the Gaussian FWHM by 14% (from 10.5 to 12 mas) between Feb 28 and Apr 15. However, the difference is within 3- of the data from Feb 28. Therefore, more observations are needed to definitively confirm time variations in the visibility.
4 Modeling of the AMBER data
4.1 Determination of stellar parameters
To interpret the AMBER observations, we use the MARCS models. As mentioned in Sect. 2, these models assume spherical symmetry. Whereas the asymmetry in the CO-line-forming region is detected, we use these spherical models as the first approximation. To select a MARCS model appropriate for BK Vir, we determined its stellar parameters (, , , , and chemical composition) as follows.
We estimated the effective temperature from the observed angular diameter and the bolometric flux obtained by integrating the photometric data available in the literature (Two-Micron Sky Survey, Neugebauer & Leighton neugebauer69 (1969); NOMAD Catalog, Zacharias et al. zacharias04 (2004); 2MASS, Skrutskie et al. skrutskie06 (2006); Fouque et al. fouque92 (1992); Kerschbaum & Hron kerschbaum94 (1994); IRAS Point Source Catalog). The photometric data were corrected for the interstellar extinction using = 0.023 (Schlegel et al. schlegel98 (1998)) and assuming . Combining the angular diameter of mas adopted in Sect. 2 and a derived bolometric flux of results in an effective temperature of K. While this agrees with the effective temperature of K derived by Dyck et al. (dyck98 (1998)), they obtained a higher bolometric flux of . If we adopt, as the uncertainty in the bolometric flux, a half of the difference between the values from Dyck et al. (dyck98 (1998)) and from the present work, the total error (i.e., error resulting from the uncertainties in the angular diameter and in the bolometric flux) in our effective temperature is K. Using the distance of 180 pc based on the Hipparcos parallax of mas (van Leeuwen vanleeuwen07 (2007)) and the above bolometric flux of , we derived a luminosity of 2700 ( = ). With the error in the parallax and the above error in the bolometric flux, the total uncertainty in the luminosity is .
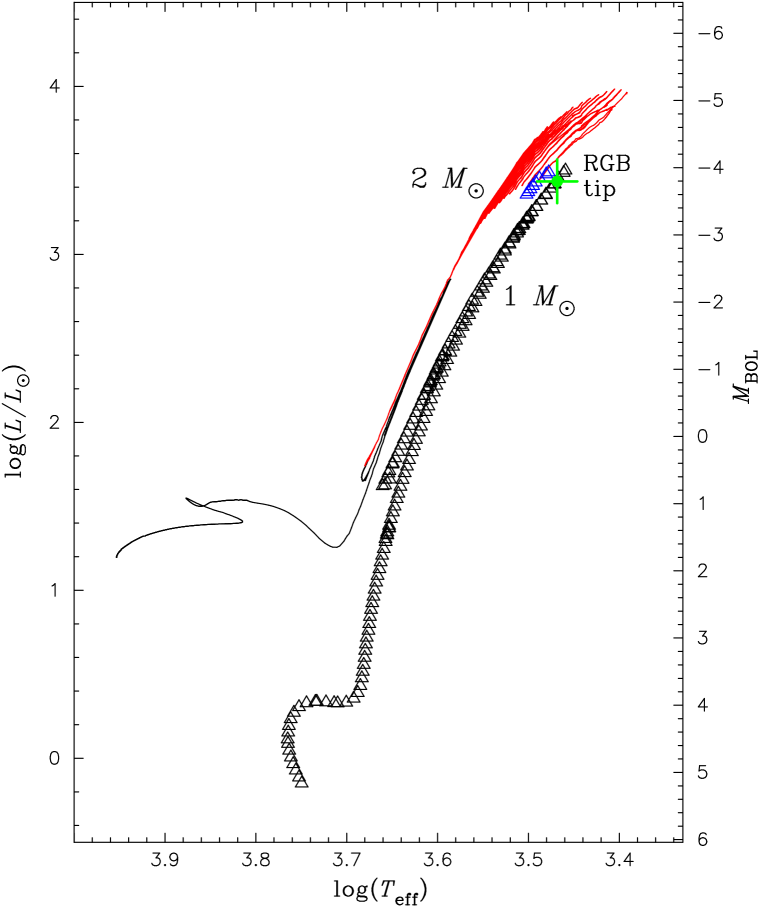
To estimate the stellar mass, we compared the position of BK Vir on the H-R diagram with theoretical evolutionary tracks. Figure 4 shows evolutionary tracks for 1 and 2 stars (Herwig herwig05 (2005)555http://astrowww.phys.uvic.ca/~fherwig and Bertelli et al. bertelli08 (2008), respectively), together with the observationally derived position of BK Vir. The figure suggests that the mass of BK Vir is close to 1 . The adoption of a stellar mass of 1 translates into a surface gravity of with a stellar radius of 201 (0.94 AU).
Whereas BK Vir is classified as an AGB star in most of the literature, Fig. 4 shows that the luminosity of BK Vir is just at the tip of the RGB. Moreover, Lebzelter & Hron (lebzelter99 (1999)) report negative detection of 99Tc, which would be strong evidence of the third dredge-up in the AGB. Therefore, we cannot conclude whether BK Vir is an RGB star or an early-AGB star that has not yet experienced the third dredge-up. In either case, however, the surface chemical composition is expected to be changed by the first dredge-up in the RGB phase, which mixes the CN-cycled material to the stellar surface. This makes the MARCS models with the “moderately CN-cycled” chemical composition (with [Fe/H] = 0.0) suitable for BK Vir.
No analysis of the micro-turbulent velocity in BK Vir is available in the literature. However, the high-resolution spectroscopic analysis of M7–8 giants with K by Tsuji (tsuji08 (2008)) shows micro-turbulent velocities of 3–4 km s-1. We adopt these values for BK Vir as well.
4.2 Comparison with the MARCS photospheric model
The MARCS model with the parameters as close to the derived values as possible is characterized by = 3000 K, = 0.0, = 1 , = 2 km s-1 (models with = 3–4 km s-1 are not available for this combination of , , , and chemical composition, and the model with = 2 km s-1 is the closest one). Using the temperature and pressure distributions of the downloaded MARCS model, we computed the monochromatic intensity profile and spectrum over the observed wavelength range using the CO line list of Goorvitch (goorvitch94 (1994)), as described in Ohnaka et al. (ohnaka06 (2006)). The monochromatic visibility was calculated by the Fourier transform of the monochromatic intensity profile. The intensity profile, visibility, and spectrum were then convolved with the AMBER’s spectral resolution. The angular scale of the model was determined so that the uniform-disk diameter derived from the model visibilities in the continuum matches the adopted value of 10.73 mas.
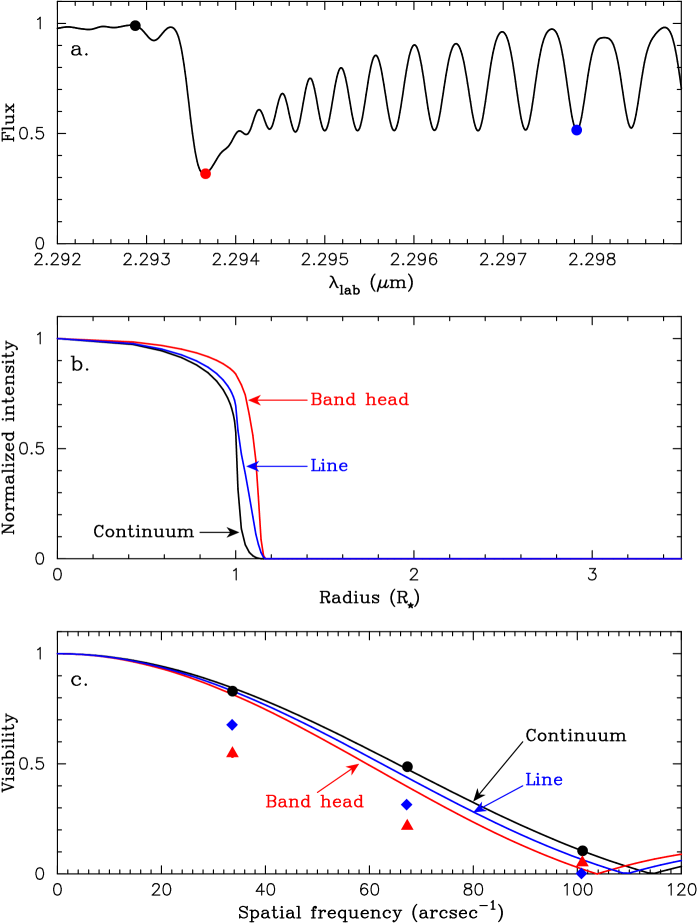
Figure 5 shows a comparison between the observed data (data set #3) and the predictions by the MARCS photospheric model. While the observed CO spectrum is well reproduced, the predicted visibilities in the CO lines are too high compared to the observed data. We also used other available MARCS models with slightly different stellar parameters ( = 2700–3100 K, = – , = 1–2 , and = 2–5 km s-1), but they cannot reproduce the observed visibilities in the CO lines, either. Figure 6 shows the intensity profiles and visibilities at three representative wavelengths in the continuum, at the CO band head, and in an isolated line. The figure illustrates that the photosphere extends to 1.17 in the CO band head and in the isolated line, but this geometrical extension is insufficient to explain the observed visibilities (Fig. 6c). The too high visibilities in the CO lines predicted by the MARCS model means the actual CO-line-forming layer is much more extended than the model predicts or there is an additional component contributing to the CO lines above the photosphere modeled by MARCS. Therefore, our AMBER observations have spatially resolved the MOLsphere in a normal M giant for the first time in the individual CO lines. The same trend was reported for the normal M6-7 giant RS Cap by Martí-Vidal et al. (marti-vidal11 (2011)) based on AMBER observations of the CO bands with a lower spectral resolution of 1500. These studies illustrate that testing photospheric models only with the spectra of strong molecular or atomic features can be misleading.
| Parameter | Searched range | Solution |
|---|---|---|
| CO column density of the inner layer: (cm-2) | (1–2) | |
| CO column density of the outer layer: (cm-2) | – | |
| Temperature of the inner layer: (K) | 1800 … 2300 ( = 100 K) | 1900–2100 |
| Temperature of the outer layer: (K) | 1200 … 2300 ( = 100 K) | 1500–2100 |
| Radius the inner layer: () | 1.2, 1.25, 1.3 | 1.2–1.25 |
| Radius the outer layer: () | 1.5, …, 3.5 ( = 0.5 ) | 2.5–3.0 |
4.3 Modeling of the MOLsphere
To characterize the physical properties of the MOLsphere, we interpreted the AMBER data with a model in which one or two extended CO layers with constant temperatures and densities are added above the MARCS photospheric model. This model is the same as that described in Ohnaka (ohnaka04 (2004)), but with the following modification: each layer is assumed to be geometrically thin with a thickness of 0.1 . The inner radius of each layer is used as the parameter to represent the size of the layer. The radius, temperature, and column density of each layer are changed as free parameters to fit the observed spectrum and visibilities simultaneously. We tentatively adopted a microturbulent velocity of 4 km s-1 for the CO layers based on the spectroscopic analysis of Tsuji (tsuji08 (2008)) for M7–8 giants. We first attempted to explain the observed data with models with one additional CO layer but could not reproduce the spectrum and visibilities simultaneously. Therefore, we attempted to explain the data with the models with two CO layers. Table LABEL:table_param gives the range of the parameters searched in our modeling. Note that the radius of the inner layer was set to be equal to or larger than 1.2 to avoid an overlap with the MARCS photospheric model, which extends to 1.17 .
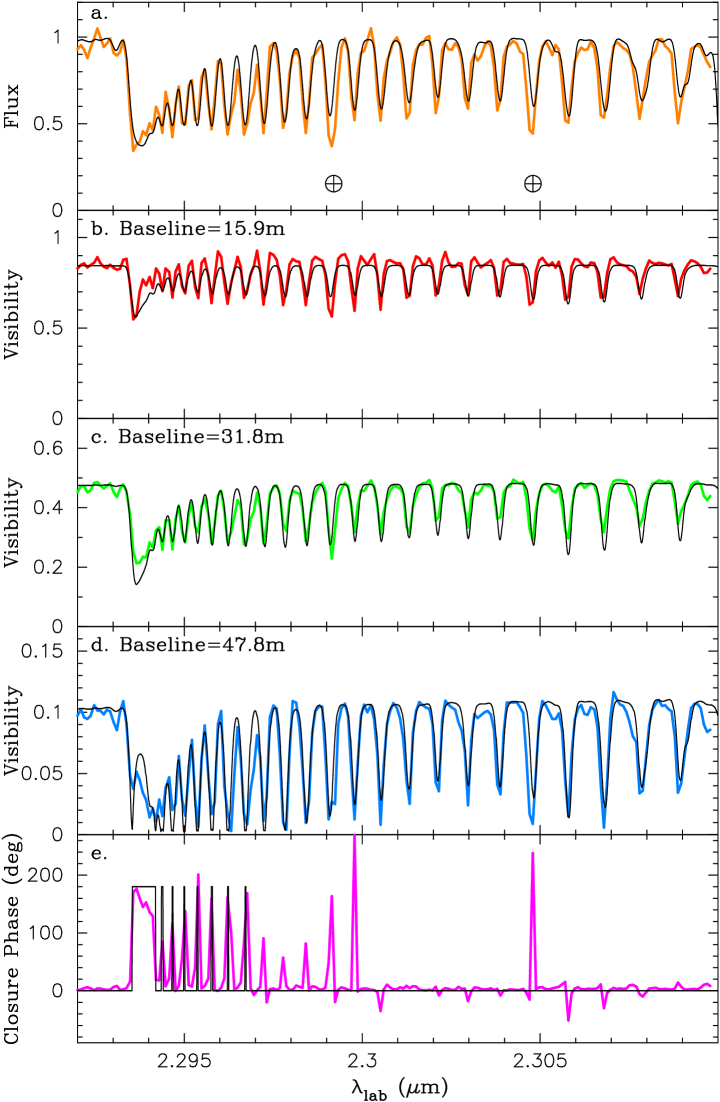
Figure 7 shows a comparison between the observed data (data set #3) and the best-fit model. The model intensity profiles and visibilities at three representative wavelengths (continuum, CO band head, and isolated CO line) are plotted in Fig. 8. This model is characterized by the inner CO layer at 1.2 with 2000 K and a CO column density of cm-2 and the outer CO layer at 2.5 with 1900 K and a column density of cm-2. The column densities of the inner and outer CO layer correspond to 16% and 0.016% of the CO column density in the MARCS photospheric model. We found the range of the radius, temperature and CO column density of the inner layer to be 1.2–1.25 , 1900–2100 K, and (1–2) cm-2, respectively. The derived ranges for the radius, temperature, and CO column density of the outer layer are 2.5–3.0 , 1500–2100 K, and – cm-2, respectively. As shown in Fig. 7, the observed visibilities and spectrum are well reproduced. The model also predicts the CP to jump in the CO lines, in particular at the CO band head, as seen in the AMBER data. This can be explained as follows. Figure 8b shows that the inner CO layer, which is optically thick, makes the star appear larger in the CO band head than in the continuum by 30%. Then the longest baseline samples the second visibility lobe in the CO band head, as shown in Fig. 8c (red line and red triangle at a spatial frequency of 100 arcsec-1). The phase in the second visibility lobe is , while the phases on the shortest and middle baselines in the first visibility lobe are zero. This results in a predicted CP of for the CO band head and leads to the jumps in the CP as observed. Because the model is spherically symmetric, the observed non-zero/non- CPs and non-zero DPs are not reproduced666The model DPs for the shortest and middle baselines are zero, and the model DP for the longest baseline is the same as the model CP with its sign flipped.. However, the overall agreement in the spectrum, visibilities, and CP suggests that our model represents the approximate picture of the outer atmosphere of BK Vir.
It is impossible to uniquely constrain the detected inhomogeneous structure from our observations. However, we estimated the flux contribution of asymmetric features from the observed CPs as follows. We added a Gaussian-shaped spot to the best-fit model image in the CO lines and computed the visibility and CP at the observed baselines. We changed the size and intensity of the Gaussian-shaped spot so that the observed non-zero/non- CPs (40–100°) can be reproduced without affecting the fit to the observed visibilities significantly. This experiment suggests that the flux contribution of the asymmetric feature is 3–5% of the total flux. These values agree with those estimated for other AGB stars. Ragland et al. (ragland06 (2006)) derived a flux contribution of 3% from a geometrical modeling (uniform disk + unresolved spot) of the asymmetric features detected in a sample of AGB stars in the -broadband. Wittkowski et al. (wittkowski11 (2011)) also suggest a flux contribution of up to 3% in the 2 m H2O band for the Mira star R Cnc.
The observed spectrum is nearly equally well reproduced by the MARCS-only model and MARCS+MOLsphere model, despite the clear disagreement between the observed visibilities and MARCS-only model. The reason is that the additional absorption due to the CO layers above the MARCS model is filled in by the extended emission of the same CO layers in the spatially unresolved spectrum. Therefore, good agreement between observation and model for spatially unresolved spectra of strong molecular features can be misleading, because these features can include the contribution from the extended outer atmosphere.

5 Discussion
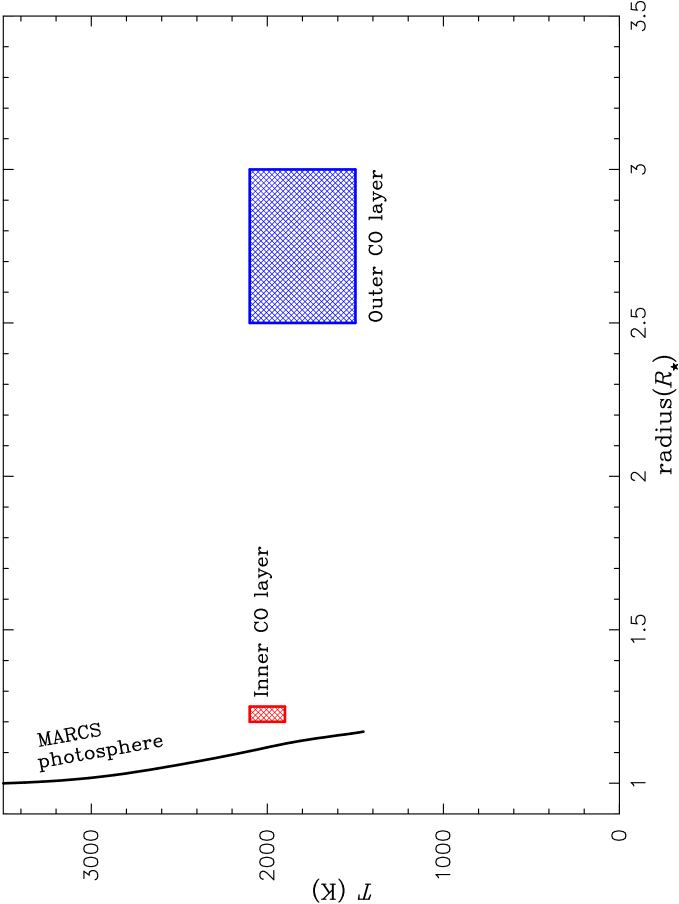
Figure 9 shows the temperature distribution of the MARCS photospheric model as a function of radius, together with the location and the temperature of the extended CO layers derived from our modeling. The temperature of the inner CO layer is noticeably higher than that of the uppermost layer of the MARCS photospheric model, although the height is approximately the same. The temperature of the outer CO layer is also higher than or equal to that of the top of the photosphere. This suggests a temperature inversion in the MOLsphere of BK Vir.
Given that our spectroscopic calibration method without a usual spectroscopic standard star gives the reliable CO line spectra of BK Vir as described in Sect. 2, the uncertainty in the spectra are unlikely to affect the result of our modeling.
We checked whether this is merely a result of approximating the temperature distribution in the outer atmosphere by two discrete layers. We set the temperatures of the CO layers to be below 1500 K, which is the temperature of the uppermost layer of the MARCS photospheric model, and attempted to reproduce the observed data. However, it turned out that such models cannot provide a reasonable fit to the observed spectrum and visibilities simultaneously. Therefore, the temperature inversion suggested in Fig. 9 is unlikely to be a result of the simplification we adopted for the structure of the outer atmosphere.
We also checked whether or not the assumption of local thermodynamical equilibrium (LTE) used in our model is valid for the CO layers. As described in Ohnaka (ohnaka04 (2004)), we compared the collisional and radiative de-excitation rates. The collisional de-excitation rate is estimated as , where is the number density of the primary collision partner, is the cross section, which is approximated with the geometrical cross section, and is the relative velocity between the collision partner and CO molecules. The CO column density of cm-2 derived for the inner layer and the layer’s geometrical thickness of 0.1 translates into a CO number density of cm-3. In chemical equilibrium at the temperature of 2000 K derived for the inner layer, number densities of H atoms and H2 molecules of and cm-3 are necessary to obtain the above CO number density. We take both H atoms and H2 molecules as the primary collision partner of CO molecules, which leads to cm-3. With a geometrical cross section of cm-2 and a relative velocity of 5 km s-1assumed, we obtain s-1 for the inner CO layer. In the case of the outer CO layer, the lower limit of the CO column density ( cm-2) translates into a CO number density of cm-3. For the temperatures of 1500–2100 K derived for the outer layer, the number densities of H atoms and H2 molecules are and cm-3 (1500 K) and and cm-3 (2100K), respectively. This leads to (H + H2) = (2–4) cm-3. With the above and , we obtain s-1 for the outer CO layer. These collisional de-excitation rates are much larger than radiative de-excitation rates of 0.6–1 s-1 found for the CO lines analyzed in the present work, which means the validity of LTE for our modeling. Therefore, it is unlikely that the high temperatures derived for the CO layers are just a result of non-LTE effects.
The temperature inversion implies the operation of some heating mechanism in the outer atmosphere within 3 . While the outwardly propagating shocks generated by the stellar pulsation can produce temperature jumps in Mira stars (e.g., Richter et al. richter03 (2003)), it is not clear whether this is the case for normal M giants, where the variability amplitudes are much smaller. Despite the remarkable difference in the variability amplitude, BK Vir shows the temperature inversion in the molecular component of the outer atmosphere. This implies that the stellar pulsation may not be the cause of the heating.
Some kind of heating is also required to explain the chromosphere common among M giants, although no UV or H observations of BK Vir are available in the literature. However, the (electron) temperature of the chromosphere inferred from the UV emission lines in M giants is much higher (6000—10000 K, Eaton & Johnson eaton88 (1988); Luttermoser et al. luttermoser94 (1994)) than the 1900–2100 K derived for the inner CO layer. Therefore, although the inner CO layer is warmer than the uppermost layer of the photosphere, the CO gas in the extended outer atmosphere represents a distinct component other than the chromosphere.
Still, the process responsible for the chromospheric heating may lead to the formation of both of the hot plasma and warm molecular gas in the outer atmosphere. For example, the magnetohydrodynamical (MHD) simulation of stellar winds in red giants by Suzuki (suzuki07 (2007)) shows the formation of transient hot gas bubbles embedded in cool gas outflows, although the simulation is still limited to stars with relatively high effective temperatures (3900 K) and much less luminous stars (1000 ) compared to BK Vir. However, as Airapetian et al. (airapetian10 (2010)) point out, this simulation assumes fully-ionized plasma, although the gas around K–M giants is only weakly ionized. The MHD simulation of Airapetian et al. (airapetian10 (2010)) reproduces the observed terminal wind velocities and mass-loss rates of K giants, but the agreement between the modeled and observed radial velocity fields is not yet satisfactory (comparison between the model of Airapetian et al. airapetian10 (2010) and observed data summarized in Crowley et al. crowley09 (2009) is shown in Harper harper11 (2011)). Since the simulation of Airapetian et al. (airapetian10 (2010)) assumes a nearly iso-thermal chromosphere, it does not include the cool, molecular component. The extension of these MHD simulations to cooler and more luminous stars including the modeling of thermal structures would be useful for understanding the origin of the MOLsphere in normal red giants.
The presence of the dense CO layers above the photosphere suggests that there can also be other molecular species in the MOLsphere. For example, TiO is one of such molecules, and the contribution from the MOLsphere can significantly affect the strength of the TiO bands observed in the optical. Hron et al. (hron10 (2010)) show that the MOLsphere models for the red supergiant Betelgeuse available in the literature predict the TiO bands to be too strong compared to the observed ones. This is because of the strong contribution from the TiO molecules in the MOLsphere. As possible reasons, they suggest the clumpy or patchy nature of the MOLsphere with a small filling factor and/or the crude nature of the current MOLsphere models. In addition, we suggest that the TiO bands may form by scattering in the MOLsphere. The line formation by scattering for electronic transitions (such as the TiO bands) is suggested by Hinkle & Lambert (hinkle75 (1975)). The construction of the MOLsphere model with this process taken into account is beyond the scope of this paper, but should be pursued to obtain a more comprehensive picture of the MOLsphere.
6 Concluding remarks
We have spatially resolved the normal M7 giant BK Vir in the individual CO first overtone lines with VLTI/AMBER. The uniform-disk diameter shows clear increases by 12–31% in the CO lines compared to the continuum. We detected non-zero/non- CPs and non-zero DPs in the CO lines, which reveal an asymmetry in the upper photosphere and outer atmosphere where the CO lines form. The visibilities, CPs, and DPs observed in the individual CO lines are symmetric with respect to the line center. This is in marked contrast with the red supergiant Betelgeuse, in which the vigorous inhomogeneous gas motions manifest themselves as the asymmetry in the visibilities in the blue and red wing of the lines. The absence of such asymmetry indicates that the amplitude of the inhomogeneous velocity field in BK Vir is much smaller (5 km s-1) than in Betelgeuse.
While the MARCS photospheric model can well reproduce the observed CO line spectrum of BK Vir, the angular size in the CO lines predicted by the model is too small. This indicates the presence of more extended CO layers than predicted by the photospheric model. Our model with two CO layers added above the MARCS model can explain the observed spectrum, visibilities, and CPs reasonably well. The derived temperatures of the two extended CO layers, 1900–2100 K and 1500–2100 K, are higher than or equal to that of the uppermost layer of the photosphere. This result suggests the operation of some heating mechanism in the outer atmosphere within 3 .
The present work illustrates that AMBER observations with high-spectral resolution are effective for constraining the physical properties of the outer atmosphere. Given that normal red giants with small variability amplitudes are not yet intensively studied by IR spectro-interferometry, it is indispensable to carry out a systematic survey of a sample of these stars with ranges of temperatures and luminosities. This will shed new light on the mass-loss mechanism not only in normal red giants but also in Mira stars.
Acknowledgements.
We thank the ESO VLTI team for supporting our AMBER observations. NSO/Kitt Peak FTS data on the Earth’s telluric features were produced by NSF/NOAO. This publication makes use of data products from the Two Micron All Sky Survey, which is a joint project of the University of Massachusetts and the Infrared Processing and Analysis Center/California Institute of Technology, funded by the National Aeronautics and Space Administration and the National Science Foundation.References
- (1) Airapetian, V. S., Carpenter, K. G., & Ofman, L. 2010, ApJ, 723, 1210
- (2) Bedding, T., Zijlstra, A. A., von der Lühe, O., et al. 1997, MNRAS, 286, 957
- (3) Bertelli, G., Girardi, L., Marigo, P., & Nasi, E. 2008, A&A, 484, 815
- (4) Crowley, C., Espey, B. R., Harper, G. M., & Roche, J. 2009, Proceedings of the 15th Cambridge Workshop on Cool Stars, Stellar Systems and the Sun, AIP Conference Proceedings, Vol. 1094, p.267
- (5) De Beck, E., Decin, L., de Koter, A., et al. 2010, A&A, 523, 18
- (6) Dyck, H. M., van Belle, G. T., & Thompson, R. R. 1998, AJ, 116, 981
- (7) Eaton, J. A. 1995, AJ, 109, 1797
- (8) Eaton, J. A., & Johnson, H. R. 1988, ApJ, 325, 355
- (9) Famaey B., Jorissen A., Luri X., et al. 2005, A&A, 430, 165
- (10) Fouque, P., Le Bertre, T., Epchtein, N., Guglielmo, F., & Kerschbaum, F. 1992, A&AS, 93, 151
- (11) Gontscharov, G. A. 2006, Astron. Lett., 32, 759
- (12) González Delgado, D., Olofsson, H., Kerschbaum, F., et al. 2003, A&A, 411, 123
- (13) Goorvitch, D. 1994, ApJS, 95, 535
- (14) Gustafsson, B., Edvardsson, B., Eriksson, K., et al. 2008, A&A, 486, 951
-
(15)
Harper, G. 2011, Presentation at “From Atoms to Stars:
the impact of Spectroscopy on Astrophysics”,
http://media.atomstars.org/presentations/harper.pdf - (16) Herwig, F. 2005, ARA&A, 43, 435
- (17) Hinkle, K. H., & Lambert, D. L. 1975, MNRAS, 170, 447
-
(18)
Hron, J., Aringer, B., & Paladini, C. 2010, Poster presentation at
“The Origin and Fate of the Sun: Evolution of Solar-mass Stars Observed with
High Angular Resolution”,
http://www.eso.org/sci/meetings/2010/stars2010/Presentations
/P-hron_molsphere-poster.pdf - (19) Isabel Pérez Martínez, M., Schröder, K.-P., & Cuntz, M. 2011, MNRAS, 414, 418
- (20) Ita, Y., Tanabé, T., Matsunaga, N., et al. 2007, PASJ, 59, S437
- (21) Karovska, M., Hack, W., Raymond, J., & Guinan, E. 1997, ApJ, 482, L175
- (22) Kerschbaum, F., Hron, J. 1994, A&AS, 106, 397
- (23) Lebzelter, T., Kerschbaum, F., & Hron, J. 1995, A&A, 298, 159
- (24) Lebzelter, T., & Hron, J. 1999, A&A, 351, 533
- (25) Luck, R. E., & Wepfer, G. G. 1995, AJ, 110, 2425
- (26) Luttermoser, D. G., Johnson, H. R., & Eaton, J. A. 1994, ApJ, 422, 351
- (27) Lyubimkov, L. S., Lambert, D. L., Rostopchin, S. I., Rachkovskaya, T. M., & Poklad, D. B. 2010, MNRAS, 402, 1369
- (28) Martí-Vidal, I., Marcaide, J. M., Quirrenbach, A., et al. 2011, A&A, 529, A115
- (29) McMurry, A. D., & Jordan, C. 2000, MNRAS, 313, 423
- (30) Mondal, S., & Chandrasekhar, T. 2004, MNRAS, 348, 1332
- (31) Neugebauer, G., & Leighton, R. B. 1969, Two-micron sky survey (NASA SP-3047, Washington)
- (32) Ohnaka, K. 2004, A&A, 424, 1011
- (33) Ohnaka, K., Bergeat, J., Driebe, T., et al. 2005, A&A, 429, 1057
- (34) Ohnaka, K., Scholz, M., & Wood, P. 2006, A&A, 446, 1119
- (35) Ohnaka, K., Hofmann, K.-H., Benisty, M., et al. 2009, A&A, 503, 183
- (36) Ohnaka, K., Weigelt, G., Millour, F., et al. 2011, A&A, 529, A163
- (37) Origlia, L., Rood, R., Fabbri, S., et al. 2007, ApJ, 667, L85
- (38) Origlia, L., Rood, R., Fabbri, S., et al. 2007, ApJ, 718, 522
- (39) Perrin, G. 2003, A&A, 400, 1173
- (40) Perrin, G., Coudé du Foresto, V., Ridgway, S. T., et al. 1998, A&A, 331, 619
- (41) Perrin, G., Ridgway, S. T., Coudé du Foresto, V., Mennesson, B., Traub, W. A., & Lacasse, M. G. 2004, A&A, 418, 675
- (42) Petrov, R. G., Malbet, F., Weigelt, G., et al. 2007, A&A, 464, 1
- (43) Pluzhnik, E., Ragland, S., le Coroller, E., et al. 2009, ApJ, 700, 114
- (44) Ragland, S., Traub, W. A., J.-P. Berger, et al. 2006, ApJ, 652, 650
- (45) Ragland, S., le Coroller, H., Pluzhnik, E., et al. 2008, ApJ, 679, 746
- (46) Richichi, A., & Percheron, I. 2005, A&A, 434, 1201
- (47) Richter, He., Wood, P. R., Woitke, P., Bolick, U., & Sedlmayr, E. 2003, A&A, 400, 319
- (48) Samus, N. N., Durlevich, O. V., et al. 2009, General Catalogue of Variable Stars, GCVS database, Version 2011 Jan (Institute of Astronomy of Russian Academy of Sciences and Sternberg State Astronomical Institute of the Moscow State University, Moscow)
- (49) Schlegel, D., Finkbeiner, D., & Davis, M. 1998, ApJ, 500, 525
- (50) Skrutskie, M. F., Cutri, R. M., Stiening, R., et al. 2006, AJ, 131, 1163 (The 2MASS All-Sky Catalog of Point Sources)
- (51) Suzuki, T. K. 2007, ApJ, 659, 1592
- (52) Takami, H., Goto, M., Gaessler, W., et al. 2009, PASJ, 61, 623
- (53) Takeda, Y., Sato, B., & Murata, D. 2008, PASJ, 60, 781
- (54) Tatulli, E., Millour, F., Chelli, A., et al. 2007, A&A, 464, 29
- (55) Tsuji, T., 2001, A&A, 376, L1
- (56) Tsuji, T. 2008, A&A, 489, 1271
- (57) Tsuji, T., Ohnaka K., Aoki, W., & Yamamura, I. 1997, A&A, 320, L1
- (58) Tuthill, P. G., Haniff, C. A., & Baldwin, J. E. 1999, MNRAS, 306, 353
- (59) van Leeuwen, F. 2007, A&A, 474, 653
- (60) Wallace, L., & Hinkle, K. H. 1996, ApJS, 107, 312
- (61) Weigelt, G., Balega, Y., Hofmann, K.-H., & Scholz, M. 1996, A&A, 316, L21
- (62) Wiedemann, G., Ayres, T. R., Jennings, D. E., & Saar, S. H. 1994, ApJ, 423, 806
- (63) Winters, J. M., Le Bertre, T., Jeong, K. S., Nyman, L.-Å., & Epchtein, N. 2003, A&A, 409, 715
- (64) Wittkowski, M., Boboltz, D. A., Ohnaka, K., Driebe, T., & Scholz, M. 2007, A&A, 470, 191
- (65) Wittkowski, M., Boboltz, D. A., Driebe, T., Le Bouquin, J.-B., Millour, F., Ohnaka, K., & Scholz, M. 2008, A&A, 479, L21
- (66) Wittkowski, M., Boboltz, D. A., Ireland, M., et al. 2011, A&A, 532, L7
- (67) Woodruff, H. C., Ireland, M. J., Tuthill, P. G., et al. 2009, ApJ, 691, 1328
- (68) Zacharias N., Monet D.G., Levine S.E., et al. 2004, BAAS, 36, 1418, Naval Observatory Merged Astrometric Dataset (NOMAD)