Charge Exchange X-ray Emission of Nearby Star-forming Galaxies
Abstract
Properties of hot gas outflows from galaxies are generally measured from associated X-ray line emission assuming that it represents atomic transitions in thermally excited hot gas. X-ray line emission, however, can also arise from the charge exchange between highly ionised ions and neutral species. The K triplet of He-like ions can be used as a powerful diagnostic, because the charge exchange X-ray emission (CXE) favours the inter-combination and forbidden lines, while the thermal emission favours the resonance line. We analyse the O VII triplet of a sample of nine nearby star-forming galaxies observed by the XMM-Newton reflection grating spectrometers. For most galaxies, the forbidden lines are comparable to or stronger than the resonance lines, which is in contrast to the thermal prediction. For NGC 253, M51, M83, M61, NGC 4631, and the Antennae galaxy, the observed line ratios are consistent with the ratio of the CXE; for M94 and NGC 2903, the observed ratios indicate multiple origins; for M82, different regions show different line ratios, also indicating multiple origins. We discuss other possible mechanisms that can produce a relatively strong forbidden line, such as a collisional non-equilibrium-ionization recombining/ionizing plasma, which are not favoured. These results suggest that the CXE may be a common process and contribute a significant fraction of the soft X-ray line emission for galaxies with massive star formation.
keywords:
atomic processes – plasmas – ISM: jets and outflows – ISM: abundances – galaxies: starburst – galaxies: individual: (M82, NGC 253, M51, M61, M83, M94, NGC 2903, NGC 4631, the Antennae) – X-rays: galaxies1 Introduction
Galaxies with massive star formation are the primary source that ejects metals into galactic halos and the intergalactic medium. The properties of outflows driven by SN explosions and stellar winds are fundamental to the understanding of feedback processes of galaxies. In previous studies, the energy and metals of outflows are generally inferred from fitting observed spectra with thermal models.
The X-ray line emission, however, can arise not only from hot plasma, but also from its interaction with neutral cool gas. For example, highly ionised ions in the solar wind can readily pick up electrons from neutral species of a comet. These electrons, captured in excited states of the ions, will cascade down, leading to X-ray line emission. This process is called charge exchange X-ray emission (CXE, also called charge transfer) and explains the bright cometary X-ray emission (e.g., Lisse et al., 1996; Cravens, 1997, 2002). The process can be represented by:
| (1) |
where a highly ionised ion (like O7+) picks up an electron from a neutral species (like H) and produces an excited ion . For historical studies and recent developments of the CXE, we refer the readers to Dennerl (2010) and references therein.
The charge-exchange cross-sections are quite large compared to the cross-sections of electron collisional excitation. For example, at collision velocities of a few hundred km/s, the charge-exchange cross-sections of O7+ and O8+ are cm2, compared to those of electron collisional excitation (cm2). This makes the CXE important even though it takes place in a very thin region compared to the tenuous hot gas.
Different from the thermal emission, the CXE contributes only emission lines. If the X-ray line emission, or part of it, is due to the CXE, the measurement of the thermal and chemical properties of the hot outflow based on thermal-only models will be misleading. To correctly understand the hot outflow, it is crucial to determine the origin of the X-ray line emission and to separate the contributions from the CXE and the thermal emission.
With the unprecedented spatial resolution of Chandra, the extra-planar diffuse X-ray emission of a number of edge-on disk galaxies has been found to be correlated with H emission (e.g., Wang et al., 2001; Cecil et al., 2002; Strickland et al., 2000, 2004; Li et al., 2008); in less-inclined galaxies, X-ray emission is also found to be correlated morphologically with H emission (e.g., Tyler et al., 2004). Lallement (2004) speculated on the importance of the CXE between the hot outflow and cool halo gas for starburst galaxies. In the scenario of the CXE, H emission represents entrained cool gas clouds/filaments, while the X-ray emission arises from their interfaces with the surrounding hot plasma. The spatial correlation between the H and X-ray emissions is thus naturally explained.
A marginal detection of an emission line at 0.459 keV is reported for the X-ray cap above the disk of the starburst galaxy of M82, which may be due to the CXE of C VI () (Tsuru et al., 2007). The direct evidence for the CXE occurring in M82 is from the line ratios of the O VII K triplet (Ranalli et al., 2008; Liu et al., 2011).
The K triplet of He-like ions is a powerful diagnostic that can be used to reveal the origin of the X-ray line emission (for a recent review, see Porquet et al., 2010). It consists of a resonance line, two inter-combination lines, and a forbidden line. For a thermal plasma in ionization equilibrium, the electron collisional excitation is efficient and favours the resonance line, while for the CXE, the electron downward cascade favours the triplet states and thus the forbidden line. Therefore, the line ratios of the triplet can be used to determine the origin of the X-ray line emission.
In a previous paper (Liu et al., 2011), we analysed the K triplets of He-like ions of O VII, Ne IX, and Mg XI of M82 observed by the XMM-Newton Reflection Grating Spectrometers (RGSs). The O VII triplet is found to be dominated by the forbidden line, and the intensity ratio of the O VII triplet is consistent with an origin of the CXE. The flux contributions of the CXE are 90%, 50%, and 30% to the O VII, Ne IX, and Mg XI triplets, respectively. The O VII triplet was also used to show the possible presence of charge exchanges between the hot gas and the cool gas spiral in the inner bulge of M31 (Liu et al., 2010).
In this paper, we study the O VII triplet for a sample of additional eight star-forming galaxies, in comparison with M82. In all these galaxies, the forbidden lines are comparable to or stronger than the resonance lines, which is in contrast to the thermal prediction. We discuss the other possible mechanisms that can produce a relatively strong forbidden line, such as a collisional non-equilibrium-ionization recombining/ionizing plasma and resonance scattering, which are found to be not favoured for our sample galaxies. It shows that the CXE may be a common process in galaxies with massive star formation.
The paper is structured as follows. We describe the observation sample in §2. The analysis results are presented in §3. The conclusion and discussion are given in §4. Errors are given at 1 confidence level.
2 Observation sample
| name | obs ID | (ks) | d (Mpc)b | notec |
|---|---|---|---|---|
| M82 (NGC 3034) | 0206080101 | 62 | 3.9 | SB |
| 0560181301 | 25 | |||
| NGC 253 | 0152020101 | 72 | 3.2 | SB |
| 0125960101 | 43 | |||
| M51 (NGC 5194) | 0303420101 | 38 | 8.0 | spiral/nuSB |
| 0303420201 | 27 | |||
| M94 (NGC 4736) | 0404980101 | 42 | 5.0 | spiral/nuSB |
| 0094360601 | 14 | |||
| M83 (NGC 5236) | 0110910201 | 25 | 4.7 | bar-spiral/nuSB |
| NGC 2903 | 0556280301 | 73 | 9.4 | bar-spiral/nuSB |
| M61 (NGC 4303) | 0205360101 | 26 | 12.1 | bar-spiral/nuSB |
| NGC 4631 | 0110900201 | 42 | 6.7 | spiral/nuSB |
| Antennae | 0085220201 | 38 | 21.6 | SB |
| 0500070401 | 17 |
-
Note: a is the useful exposure time after removing intense flare periods. b The distance is the mean distance adopted from NED (NASA/IPAC extragalactic database). c SB denotes for starburst and nuSB denotes for massive nuclear star formation. M82, NGC 253, and NGC 4631 are edge-on galaxies, while others are close to face-on.
The XMM-Newton RGSs (den Herder et al., 2001) are unique to provide high-resolution spectra for extended sources. Besides M82, we select eight star-forming galaxies from the XMM-Newton RGS data archive, which are bright enough for the analysis of the O VII triplet. We exclude the ones identified as Seyfert galaxies, for which photoionization by AGN may be important. Thus, we have in total a sample of nine galaxies—three starburst-dominated galaxies and six more normal spirals with nuclear starburst regions. They are listed in Table 1.
There are two RGSs on-board XMM-Newton. CCD4 of RGS2 covering the O VII triplet failed early in the mission. Thus only RGS1 data are used in the present work. For those having multiple exposures (M82, NGC 253, M51, M94, and the Antennae), we use the two longest exposures with similar observational configurations. The observation IDs are listed in Table 1. The XMM-Newton software Science Analysis System (SAS, version 10.0) is used for the reduction of photon events.
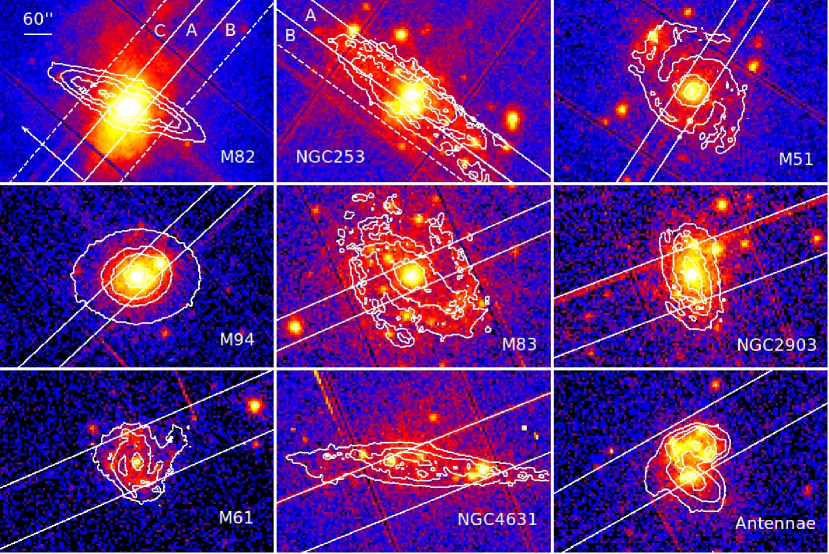
For extended sources, emission lines are broadened according to the relation Å, where the angular extent of the source is in units of arcmin. To obtain sufficient spectral resolution, for bright galaxies (M82, NGC 253, M51, M94, and M83) we limit the spectral extraction to events within 60′′ distance of the cross-dispersion direction. For faint galaxies (NGC 2903, M61, NGC 4631, and the Antennae), the extraction regions are 120′′ distance of the cross-dispersion direction. The corresponding extraction regions are outlined on the 0.5-2 keV European Photon Imaging Camera (EPIC) pn images of the galaxies in Fig. 1.
We find that M82 shows qualitatively different characteristics of the O VII triplet at different cross-dispersion directions, which was not noticed in previous studies. This spatial variation of the O VII triplet of M82 is discussed in §3.2. For the disk galaxy NGC 253, which has sufficient counting statistics in the off-disk region, we also extract the spectra of the off-disk region (60′′ in the cross-dispersion direction) represented by the dashed line (denoted as B) in Fig. 1. As NGC 253 is offset from the RGS center, only one off-disk side is useful (see Fig. 5).
3 Analysis and Results

The RGS spectra of the central region of the sample galaxies, corrected for the effective area, are plotted in Fig. 2. The emission lines are prominent in all galaxies and generally dominate the spectra. The emission lines are not necessarily from the thermal emission of the hot gas. Below we analyse their O VII triplets, the intensity ratios of which are sensitive to the origin of the X-ray line emission.
3.1 Line ratios of the O VII triplets

| name | (Å)b | (Å)b | /dof | ||||||
|---|---|---|---|---|---|---|---|---|---|
| NGC 253 A | 0.90.6 | 0.80.4 | 2.10.6 | 3.30.5 | 0.150.06 | 0.160.06 | 5.8/9 | 3.21.5 | 1.50.1 |
| M51 | 1.10.5 | 0.60.8 | 2.00.6 | 2.70.7 | -0.070.02 | 0.090.02 | 8.2/9 | 2.41.4 | 1.20.2 |
| M94 | 1.80.7 | 1.00.5 | 1.90.6 | 4.00.9 | -0.010.02 | 0.110.03 | 4.6/9 | 1.60.8 | 1.00.1 |
| M83 | 1.31.1 | 1.10.7 | 1.90.7 | 4.51.0 | 0.030.05 | 0.070.04 | 3.0/9 | 2.31.5 | 1.60.3 |
| NGC 2903 | 1.30.4 | 0.00.2 | 1.60.5 | 3.20.6 | 0.030.03 | 0.110.03 | 9.5/9 | 1.20.4 | 1.00.1 |
| M61 | 1.11.2 | 1.70.8 | 2.31.0 | 4.91.3 | 0.100.04 | 0.100.03 | 3.6/9 | 3.62.6 | 1.00.2 |
| NGC 4631 | 0.81.0 | 0.80.5 | 1.31.0 | 5.01.1 | 0.100.05 | 0.110.03 | 7.3/9 | 2.62.1 | 1.10.2 |
| Antennae | 0.51.0 | 1.10.6 | 1.10.7 | 5.20.8 | 0.010.05 | 0.060.04 | 5.2/9 | 4.42.9 | 1.00.2 |
| NGC 253 B | 0.40.2 | 0.60.3 | 1.50.4 | 3.80.4 | 0.070.01 | 0.070.01 | 12.0/9 | 5.31.9 | 1.90.2 |
| M82 Ad | 1.50.5 | 2.00.4 | 3.00.6 | 7.00.8 | 0.110.02 | 0.080.01 | 6.9/7 | 3.31.0 | 2.30.2 |
| M82 B | 1.10.4 | 1.00.3 | 1.80.4 | 5.50.5 | 0.120.02 | 0.080.01 | 2.0/9 | 2.51.0 | 2.20.2 |
| M82 C | 2.10.7 | 0.00.4 | 1.00.6 | 4.41.0 | -0.090.02 | 0.100.02 | 11.7/9 | 0.50.5 | 2.40.3 |
-
Note: For the meanings of the symbols, see eq (2). a and are in units of photons/s/cm2. b and are the wavelength shift and dispersion, respectively. c and refer to the continuum-subtracted fluxes within 18.5 – 19.5 Å and 21.4 – 22.4 Å, respectively. d The two data points between 21.3 and 21.5 Å are neglected when fitting the triplet of M82 A (see discussion in §3.2).
The observed O VII triplets of the galaxies are plotted in Fig. 3. For the edge-on galaxies of NGC 253 and NGC 4631, the O VII triplets are heavily blended. The forbidden lines are relatively well separated for others. Except for the C region of M82, Fig. 3 shows that for all galaxies the forbidden lines are comparable to or stronger than the resonance lines.
To study the line ratios of the O VII triplets quantitatively, we fit a model of three Gaussians and a constant continuum to each of the observed triplets, which is written as
| (2) |
where (21.6, 21.8 and 22.1 Å) are the wavelengths of the resonance, inter-combination, and forbidden lines, respectively, and the corresponding fluxes, the dispersion, and the wavelength shift. In total, we have 15 bins of data, with 6 parameters. The errors are estimated using the bootstrap method. The wavelength dispersions are largely determined by the spatial extent, while the wavelength shifts are mainly determined by the spatial offset between the peak X-ray line emission region and the adopted nominal center. As the XMM-Newton RGS is slit-less, we can not remove point sources from the RGS spectra. Therefore, the continua of the RGS spectra are dominated by point sources and instrument background. As a result, we choose to fit the triplets with a local continuum within a fitting region extending beyond the triplets. The fitted continua are generally close to the fluxes at the wings of the O VII triplets. The fitting results are plotted in Fig. 3 and listed in Table 2.
The often-used line ratio
| (3) |
which is a diagnostic of temperature of thermal plasmas, is calculated and listed in Table 2. Because the inter-combination lines are poorly constrained due to blending, the ratio is not included.
For a thermal plasma in ionization equilibrium, the ratio is smaller than 1.2 for temperatures higher than 0.1 keV. All the fitted ratios are larger than 1.2, except for M82 C, which is discussed in the next section. Therefore, the majority of the O VII triplets of the sample galaxies can not come from the ionization-equilibrium hot gas directly, but may originate from the CXE.
For the CXE, the experiment measured ratio (Beiersdorfer et al., 2003). For galaxies of M51, M83, and M82 B, the triplets are relatively well resolved, and the fitted ratios are in good agreement with the predicted value of the CXE. For M94 and NGC 2903, the triplets are also relatively resolved, but their ratios are , which indicate multiple origins. Except for M82 C and NGC 253 B, the ratios of other galaxies are consistent with the value of the CXE within 1 errors.
3.2 O VII triplets of M82


The observed triplet of M82 A in Fig. 3 shows a feature around 21.4 Å, which can not be fitted with the model of three Gaussians. As shown in Fig. 1, for M82, the RGS cross-dispersion direction is not parallel to the outflow direction, and the O VII triplet will have a different wavelength shift for different cross-dispersion position. Therefore, in the top panel of Fig. 4, we plot the cross-dispersion distributions of M82 for photons between 21.25 and 21.55 Å and between 22.1 and 22.4 Å. The photons between 22.1 and 22.4 Å are peaked around the center, while the photons between 21.25 and 21.55 Å have a plateau from -30′′ to 90′′. Thus, we divide the cross-dispersion direction into three regions: B (-90′′ – -30′′), A (-30′′ – 30′′), and C (30′′ – 90′′), which are denoted in Fig. 1. The O VII triplets of the three regions are plotted in the bottom panel of Fig. 4.
The O VII triplets of the three regions, however, are not simply shifted according to the spatial offsets, but have different line intensity ratios. The peak around 21.5 Å of the C region can not be identified as the forbidden line of the O VII triplets, otherwise, it will have a shift of 0.6 Å, which is larger than the shift provided by the spatial offset. Instead, it is identified as the resonance line, as evidenced by the relative shift from the O VIII line at 18.8 Å. For the B region, the forbidden line is dominant; for the C region, however, the resonance line is dominant. The three lines peak at 21.4, 21.9, and 22.2 Å of the A region can not be fitted with a single triplet lines, but are a mixture of features of B and C regions. As a result, we have neglected the two data points between 21.3 and 21.5 Å when fitting the triplet of M82 A. The different ratios of the O VII triplets of different regions indicate complicated processes and multiple origins of the X-ray emission of M82.
3.3 Cross-dispersion profiles of the O VII triplets

While the origin of O VII triplets can be tested through their line ratios, we can not directly tell the origin of other lines such as the O VIII line. However, we can still get some hints by comparing the spatial distribution of such lines with that of the O VII triplet in the cross-dispersion direction.
In Fig. 5, we plot the cross-dispersion distributions of the O VII triplet (21.4–22.4 Å), the O VIII line (18.5–19.5 Å), and the emission between 14 and 18 Å for six relatively bright galaxies. We see that the profiles of the O VIII line are similar to those of the O VII triplet, except for M94, the O VIII line of which is more centered. The similarity between the distributions of the O VIII line and the O VII triplet indicates that they may have a similar origin.
The distributions of the emission between 14 and 18 Å of the bright galaxies (M82, NGC 253, M51, and M94) are more centered compared to the corresponding profiles of the O VII triplet. It may be due to the concentration of the point sources of power-law continuum, as suggested by the increasing continua at 14 – 18 Å in the spectra of Fig. 2. Nevertheless, for NGC 253 and M51, the profiles of the emission between 14 and 18 Å and the O VII triplet appear to be similar outside the center.
If most of the O VIII line emission is indeed primarily from the CXE, it is then interesting to calculate the observed flux ratios of the O VIII line to the O VII triplet (), which are listed in Table 2. The charge exchange cross sections are similar for O8+ and O7+ions, and the efficiencies of producing a photon are also similar for the resulting excited O7+ and O6+ ions (Greenwood et al., 2001). If only a single charge exchange collision occurs (collisionally thin case), the flux ratio reflects the composition ratio of O8+/O7+ of the interacting hot gas. The observed flux ratios of are , which means the ratios of O8+/O7+ are also for the interacting hot gas. These ratios correspond to a temperature of K in a thermal equilibrium plasma.
4 Conclusion and discussion
We have analysed the O VII triplets of a sample of nine nearby star-forming galaxies. All the observed ratios (eq.3) of the galaxies are larger than 1.2, which is the upper limit for a thermal plasma with temperatures higher than 0.1 keV. For NGC 253, M51, M83, M61, NGC 4631, and the Antennae, the observed ratios are consistent with the laboratory measured ratio of the CXE, while for M94 and NGC 2903, the observed ratios indicate multiple origins. For M82, the O VII triplets of different regions show different line ratios. The cross-dispersion profiles of the O VIII line are similar to those of the O VII triplet, indicating that the O VIII lines may have a similar origin. Below we discuss the CXE and other possible mechanisms for the O VII triplet emission of a high ratio.
4.1 AGN contribution
In our sample, three galaxies (M51, M61, and M94) show low level AGN activities, which can complicate the interpretation of the O VII triplets. A high ratio is also expected from the recombining ions due to the photoionization by an AGN. However, at least for M61 and M94, the analysis of the Chandra images indicates that the AGN is weak and unlikely to be important. The Chandra image of the nucleus of M61 reveals that the soft X-ray emission traces an ultraviolet star-forming spiral down to an unresolved core (1.5′′), and the soft X-ray emission of the core accounts for only 15% of the total soft X-ray emission in the central 8′′ region (Jimenez-Bailon et al., 2003). For M94, the X-ray emission is resolved into a diffuse component and a cluster of stellar X-ray sources, which appear to follow a recent episode of starburst, and shows no evidence of an AGN (Eracleous et al., 2002).
4.2 Non-equilibrium-ionization model
A collisionl non-equilibrium-ionization (NEI) recombining/ionizing plasma can also produce a relatively strong forbidden line (e.g., Oelgoetz & Pradhan, 2004). In a NEI recombining plasma, the recombination lags the cooling (e.g., Breitschwerdt & Schmutzler, 1999), and the delayed recombination can produce a strong forbidden line. For the star-forming galaxies studied here, however, the X-ray emission is spatially correlated with the filamentary H emission. This fact is consistent with the scenario that X-ray emission arises from the interfaces between the hot outflow and the entrained cold gas, but would be difficult to explain for the NEI model in which the emission should come from the bulk of the outflow, where the low density regions will be the most over-ionized.
Furthermore, most of the O VII triplet emission arises from the central region of the galaxies. According to Chevalier & Clegg (1985), in an adiabatic free-flow. The initial temperature is generally estimated to be around K (e.g., Veilleux et al., 2005). If we adopt a star-forming region of 100 pc (as in the case of M82), when it extends to 0.5 kpc, the temperature decreases a factor of 10, still far above the fully stripping temperature of O8+ ion ( K). A mass-loading factor of 10 will help the plasma to cool to about K, the peak O6+ ion temperature. But the mass-loading leads to a high density, hence an equilibrium condition. Thus, especially in the central regions where most of the O VII triplet emission arises from, a NEI recombining plasma seems unlikely to be important.
It is also possible to produce a high ratio in an ionizing NEI plasma (e.g., Liedahl, 1999), such as supernovae remnants (SNR), in which the heating generally precedes the ionization. The inner-shell collisional ionization of O5+ ions can lead to excited O6+ ions and to the enhanced forbidden line emission. However, this happens only in a short transition region when the O5+ fraction is large. In fact, the observed O VII triplets of SNR generally show a thermal-like ratio (e.g., Rasmussen et al., 2001; Behar et al., 2001). For the observed (accumulated plasma) spectra of the sample galaxies, the O VIII emission is stronger than the O VII triplet, which means that the O5+ ion fraction is negligible.
4.3 Resonance scattering
Another process that may have effect on the line ratios is resonance scattering. The resonance line has a larger optical depth due to its large oscillator strength compared to the forbidden line. If the optical depth is large enough, the resonance line intensity can then be re-distributed from the central optical thick region to the outer optical thin region (Gilfanov et al., 1987), and the ratio is increased in the central region and reduced outside. For the off-disk O VII triplets of M82 B and NGC 253 B, the ratios are higher than the ratio of thermal models, which can not be due to resonance scattering. Furthermore if resonance scattering is important for the O VII resonance line, so is for the O VIII line. For thermal models, the ratio of of corresponds to an ion ratio of O7+/O6+, which means the scattering optical depth of the O VIII line is times larger than that of the O VII resonance line. Thus, if resonance scattering is important, the profiles of the O VIII line should be flatter than those of the O VII triplet, which is not observed in Fig. 5.
4.4 CXE model
For the CXE, we can estimate the required property of the hot gas assuming that all the oxygen ions are in O7+ state and can participate in the exchange. Then, the O VII triplet flux is , where is the emission radius and assumed to be 0.5 kpc, the velocity (1000 km s-1), the distance (4 Mpc for M82), and the O7+ ion density. Taking the solar oxygen abundance (), we find that an electron density of cm-3 is enough to produce the observed central O VII triplet flux of M82 ( photons cm-2s-1). The effective interacting surface area can, in principle, be substantially greater than , depending on the topology of the cool gas and the dynamics of the turbulent mixing of the hot and cool gases. The lack of spatial information limits further estimates, but the details of the CXE process can be better constrained with future spatially-resolved high-resolution X-ray spectroscopy.
Since the majority of the O VII triplets are consistent with the CXE and the emission between 14 and 20 Å is likely to have a similar origin, one can not measure the temperature and metal abundances of the hot gas assuming thermal models alone. Instead, one needs to incorporate the CXE in the spectral modelling. The relative abundances of different ions can be obtained by comparing the observed spectra with the CXE models, as has been done for the solar wind based on X-ray spectra of comets (e.g., Schwadron & Cravens, 2000; Kharchenko et al., 2003). For M82, the relative abundances of O, Ne, and Mg were found to be similar to the solar values based on the CXE fluxes of their K triplets (Liu et al., 2011). In some galaxies, one may need to consider the CXE and the thermal emission simultaneously, as shown by the ratios of M94 and NGC 2903 and the O VII triplets of M82. For such a task, a detailed modelling of the CXE is needed. The CXE cross sections of heavy elements of Ne, Mg, and Fe need to be calculated and/or experimentally measured.
Acknowledgements
We appreciate our referee’s critical and constructive report. This research has made use of XMM-Newton archival data. XMM-Newton is an ESA science mission with instruments and contributions directly funded by ESA Member States and the USA (NASA). We also use images from DSS-2 (POSS-II), which was made by the California Institute of Technology with funds from the National Science Foundation, the National Geographic Society, the Sloan Foundation, the Samuel Oschin Foundation, and the Eastman Kodak Corporation. JRL and SM thank the Chinese Academy of Sciences for financial support and QDW acknowledges the support by NASA via the grant NNX10AE85G.
References
- Behar et al. (2001) Behar, E., Rasmussen, A. P., Griffiths, R. G., Dennerl, K., Audard, M., Aschenbach, B., Brinkman, A. C. 2001, A&A, 365, L242
- Beiersdorfer et al. (2003) Beiersdorfer, P., Boyce, K. R., Brown, G. V., Chen, H., et al. 2003, Science, 300, 1558
- Breitschwerdt & Schmutzler (1999) Breitschwerdt, D. & Schmutzler, T. 1999, A & A, 347, 650
- Cecil et al. (2002) Cecil, G., Bland-Hawthorn, J., Veilleux, S. 2002, ApJ, 576, 745
- Chevalier & Clegg (1985) Chevalier, R. A. & Clegg, A. W. 1985, Nature, 317, 44
- Cravens (1997) Cravens, T. E. 1997, Geophys. Res. Lett., 24, 105
- Cravens (2002) Cravens, T. E. 2002, Sci. 296, 1042
- Dennerl (2010) Dennerl, K. 2010, SSR., 157, 57
- den Herder et al. (2001) den Herder, J. W. et al. 2001, A&A, 365, L7
- Eracleous et al. (2002) Eracleous, M., Shields, J. C., Chartas, G., Moran, E. C. 2002, ApJ, 565, 108
- Gilfanov et al. (1987) Gilfanov, M. R., Syunyaev, R. A., Churazov, E. M. 1987, SvAL, 13, 3
- Greenwood et al. (2001) Greenwood, J. B., Williams, I. D., Smith, S. J. & Chutjian, A. 2001, Phs. Rev. A, 63, 062707
- Jimenez-Bailon et al. (2003) Jimenez-Bailon, E., Santos-Lleo, M., Mas-Hesse, J. M., Guainazzi, M., Colina, L., Cervino, M., Gonzalez Delgado, Rosa M. 2003, ApJ, 593, 127
- Kharchenko et al. (2003) Kharchenko, V., Rigazio, M., Dalgarno, A., Krasnopolsky, V. A. 2003, ApJ, 585, L73
- Lallement (2004) Lallement, R. 2004, A&A, 422, 391
- Liedahl (1999) Liedahl, D. A. 1999, X-Ray Spectroscopy in Astrophysics, edited by J. V. Paradijs and J. A. M. Bleeker, Lecture Notes in Physics, 520, 189
- Li et al. (2008) Li, J, Li, Z., Wang, Q. D.; Irwin, J. A., Rossa, J. 2008, MNRAS, 390, 59
- Lisse et al. (1996) Lisse, C. M., et al. 1996, Science, 274, 205
- Liu et al. (2010) Liu, J., Wang, Q. D., Li, Z. & Peterson, J. R. 2010, MNRAS, 404, 1879
- Liu et al. (2011) Liu, J., Mao, S., Wang, Q. D. 2011, MNRAS, 415, L64
- Oelgoetz & Pradhan (2004) Oelgoetz, J. & Pradhan, A. K. 2004, MNRAS, 354, 1093
- Porquet et al. (2010) Porquet, D., Dubau, J. & Grosso, N. 2010, SSR., 157, 103
- Ranalli et al. (2008) Ranalli, P., Comastri, A., Origlia, L., & Maiolino, R. 2008, MNRAS, 386, 1464
- Rasmussen et al. (2001) Rasmussen, A. P., Behar, E., Kahn, S. M., den Herder, J. W., van der Heyden, K 2001, A&A, 365, L231
- Schwadron & Cravens (2000) Schwadron, N. A. & Cravens, T. E. 2000, ApJ, 544, 558
- Strickland et al. (2000) Strickland, D. K., Heckman, T. M., Weaver, K. A., Dahlem, M. 2000, AJ, 120, 2965
- Strickland et al. (2004) Strickland, D. K., Heckman, T. M., Colbert, E. J. M., Hoopes, C. G., Weaver, K. A., 2004, ApJS, 151, 193
- Tyler et al. (2004) Tyler, K., Quillen, A. C., LaPage, A., Rieke, G. H. 2004, ApJ, 610, 213
- Tsuru et al. (2007) Tsuru, T. G. et al. 2007, PASJ, 59, 269
- Veilleux et al. (2005) Veilleux, S., Cecil, G., Bland-Hawthorn, J. 2005, ARAA, 43, 769
- Wang et al. (2001) Wang, Q. D., Immler, S., Walterbos, R., Lauroesch, J. T., Breitschwerdt, D. 2001, ApJ, 555, L99