1–12
Spectral Energy Distributions of a set of H ii regions in M33 (HerM33es)
Abstract
Within the framework of the HerM33es Key Project for Herschel and in combination with multi-wavelength data, we study the Spectral Energy Distribution (SED) of a set of H ii regions in the Local Group Galaxy M33. Using the H emission, we perform a classification of a selected H ii region sample in terms of morphology, separating the objects in filled, mixed, shell and clear shell objects. We obtain the SED for each H ii region as well as a representative SED for each class of objects. We also study the emission distribution of each band within the regions. We find different trends in the SEDs for each morphological type that are related to properties of the dust and their associated stellar cluster. The emission distribution of each band within the region is different for each morphological type of object.
keywords:
(ISM:) dust, ISM: evolution, (ISM:) H ii regions, galaxies: M33.1 Introduction
The study of the star formation rate (SFR) in galaxies of different types has been lately improved due to the new available data. Remarkably, the focus has been turned to the closest galaxies as well as to star-forming regions within our Galaxy. For these nearby objects, the resolution of the data offers us an opportunity to test whether the proposed SFR calibrators trace indeed the location of the stellar births (Churchwell et al. 2006; Relaño & Kennicutt 2009, among others). Recently, a new study on the star-forming regions in the Magellanic Clouds has analysed the relation of the amount of flux at the different wavelengths via the SEDs of these objects (Lawton et al. 2010).
Within the HerM33es Key Project (Kramer et al. 2010) we are obtaining maps of the entire galaxy M33 at wavelengths between 100 m and 500 m using PACS and SPIRE instruments on Herschel. Verley et al (2010) identified a set of H ii regions in the north of M33 showing a shell-like morphology in these infrared bands, and also traced by the H emission. In order to further study this phenomenon we have analysed the SEDs of a set of H ii regions in M33 covering different morphologies. The resolution of our data (from to ) is good enough to perform such as study.
2 SED of H ii regions
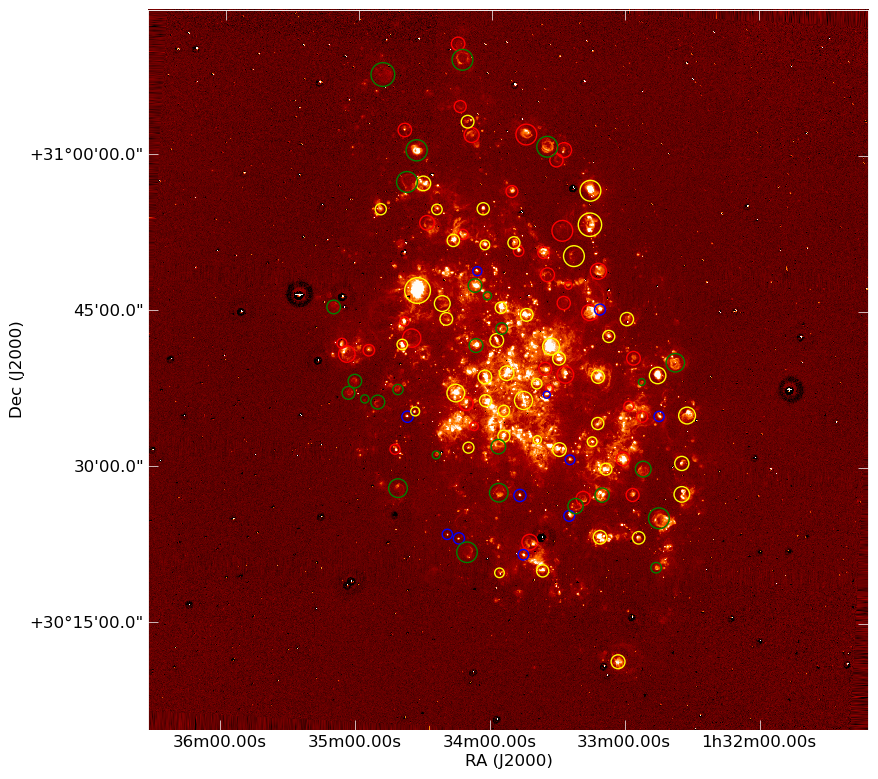
We use an H image of M33 (Hoopes & Walterbos 2000) to identify a set of H ii regions for which clear morphology can be recognised. A morphological classification was obtained with the following criteria: filled regions are objects showing a compact knot, mixed regions are those presenting several compact knots and filamentary structures, and shells are regions showing arcs. We add another classification for the most spherical, closed shells called clear shells. Out of the 120 selected H ii regions, 9 are filled, 47 mixed, 37 shell and 27 clear shells. Our sample is distributed over the whole disk of M33 (see Fig. 1, left).
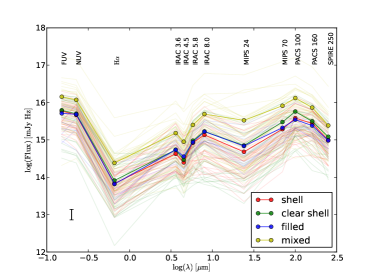
We use multi-wavelength data from FUV (GALEX) to 250 m (Herschel) smoothed to a common 20′′ resolution and regridded to a 6′′ pixel size (corresponding to those of the 250 m Herschel image) to obtain the SED for each region. Photometry was performed using individual apertures for each object and local background was subtracted to eliminate the contribution of the diffuse medium to the H ii region fluxes. In Fig. 1 (right) we show the SEDs for our objects together with a characteristic SED for each classification obtained with the mean values in each band for all the H ii regions in the corresponding classification. From Fig. 1 (right) we observe the following trends: (i) mixed regions are more luminous in all bands as they normally have several knots of star formation, (ii) the slope of the SED between the FUV-NUV wavelength range and H is steeper for shells and clear shells than for filled and mixed, (iii) filled and mixed objects have more 24 m relative to 8 m than the shells and clear shells do.
3 Dust Temperature
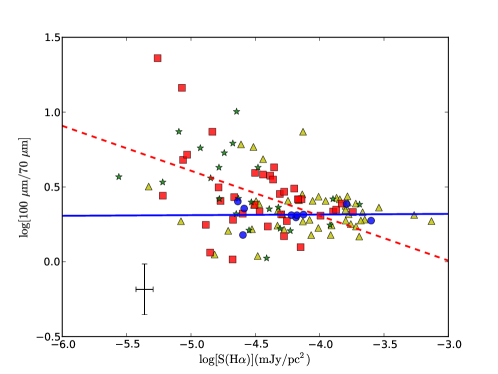
The 100 m/70 m, 160 m/70 m or 160 m/100 m ratios normally trace the temperature of the warm dust emitting from 24 m to 160 m. In Fig. 2 (left) we plot the 100 m/70 m ratio versus the H surface brightness for our sample. At high H surface brightness the 100 m/70 m flux density ratio decreases showing that highly luminous H ii regions tend to have warmer dust. This agrees with the correlation observed by Boquien et al. (2010, 2011) in M33, and in a similar study by Bendo et al. (2011) who observed M81, M83 and NGC 2403 with Herschel.
However, the filled regions seem to have a constant 100 m/70 m ratio, independent of the H surface brightness. For shells and clear shells there is a dispersion in the 100 m/70 m ratio showing that these regions present a range of dust temperatures. For the shells, the relative location between stars and dust can affect more the temperature of the dust than the intensity of the stellar radiation field and therefore they tend to present a wider dust temperature range.
4 Emission line profiles for clear shells
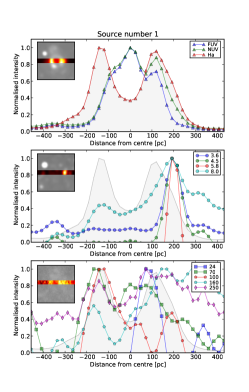
We have performed a multi-wavelength study of the emission distribution in the interior of the clear shells. From FUV to 250 m we have obtained profiles in the horizontal (East-West) direction crossing the centre of the H ii regions. Each profile corresponds to the integration of a line of 4 pixels () width perpendicular to the direction of the profile.
In Fig. 2 (right) we show the emission line profile for one of the clear shells of our sample. The H profile shows the characteristic double peak of the shell emission, and there is a displacement between the H and FUV/NUV emission, with the FUV/NUV emission located in the inner part of the region. The ratio H/FUV is lower in the centre than in the boundaries of the shell, which could be due to: (i) the existence of a young stellar population within the shell, or (ii) the ionising photons from the central cluster reaching the shell and ionising the gas within the rim. The emission at all IR bands follows clearly the H shape of the shell: at 24 m and 250 m the emission decays in the centre of the shell and they are enhanced at the boundaries. The same trend, though not so clear, is seen at 70 m, 100 m, and 160 m. The emission of the Polycyclic Aromatic Hydrocarbon molecules (PAH) at 8 m is marked by the location of the shell boundaries.
References
- [Bendo et al. (2011)] Bendo, G. J., Boselli, A., Dariush, A. et al. 2011, astro-ph, 1109.0237
- [Boquien et al. (2010)] Boquien, M., Calzetti, D., Kramer, C. et al. 2010, A&A, 518, 70
- [Boquien et al. (2011)] Boquien, M., Calzetti, D., Combes, F. et al. 2011, AJ, 142, 111
- [Churchwell et al. (2006)] Churchwell, E., Povich, M. S., Allen, D. et al. 2006, ApJ, 649, 759
- [Hoopes & Walterbos (2000)] Hoopes, C. G., Walterbos, R. A. M. 2000, ApJ, 541, 597
- [Kramer et al. (2010)] Kramer, C., Buchbender, C., Xilouris, E. M. et al. 2010, A&A, 518, 67
- [Lawton et al. (2010)] Lawton, B., Gordon, K. D., Babler, B. et al. 2009, ApJ, 716, 453
- [Relaño, M. & Kennicutt, R. C. Jr. (2009)] Relaño, M. & Kennicutt, R. C. Jr. 2009, ApJ, 699, 1125
- [Verley et al. (2010)] Verley, S., Relaño, M., Kramer, C. et al. 2010, A&A, 518, 68